Annual asylum applications by country of lodging
- Eurostat dataset
- migr_asyappctza
- Reference period
- 2025
- Unit of measure
- applications
Key estimates
- EU aggregate (2025): 800 800 applications.
- Highest value: Germany at 168 450 applications; lowest: Liechtenstein at 80.0 applications.
- Cross-country mean 26 002 applications, standard deviation 48 689, coefficient of variation 187.2% across 32 reporting countries.
- Aggregate change 2014→2025: +32.0% on a constant panel of 31 countries.
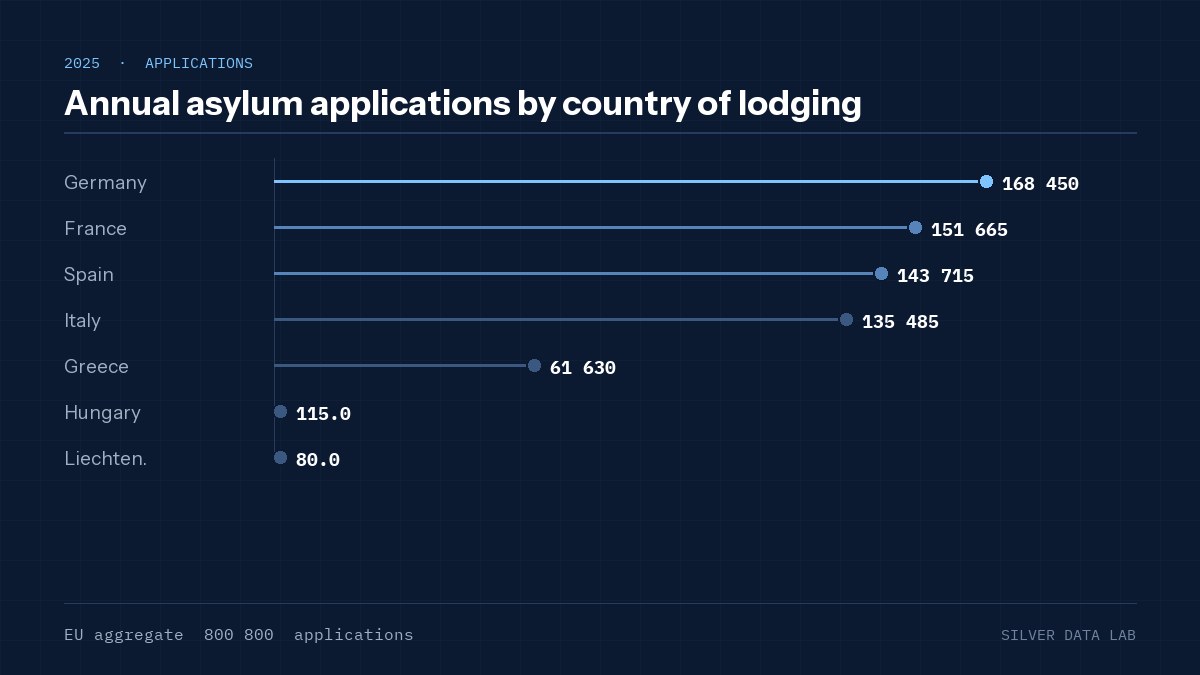
How concentrated is Europe's asylum caseload? Eurostat dataset migr_asyappctza reports annual asylum applications by country of lodging for 32 reporting countries, with 2025 as the most recent period carrying broad coverage. The European aggregate stands at 800 800 applications. Application counts measure administrative load, not population change, and the two are frequently conflated.
The five highest values in 2025 are recorded by Germany (168 450), France (151 665), Spain (143 715), Italy (135 485), Greece (61 630), all expressed in applications. At the opposite end of the distribution sit Liechtenstein (80.0), Hungary (115.0), Montenegro (145.0), Slovakia (165.0), Lithuania (380.0). The ratio between the highest and the lowest observation is 2105.62, while the median country reports 3 060 applications against a mean of 26 002 applications.
Dispersion is wide: the standard deviation across countries is 48 689 applications, giving a coefficient of variation of 187.2%. The mean sits above the median, which indicates that the distribution is pulled by the upper tail rather than being symmetric. Any European average quoted for this indicator therefore describes a synthetic country that few Member States resemble.
Between 2014 and 2025 the summed value across the 31 countries reporting in both periods moved by +32.0%. The largest relative increases are observed in Spain (+2459.5%), Slovenia (+983.1%), Iceland (+905.9%); the largest decreases, or the smallest increases, in Hungary (-99.7%), Sweden (-89.5%), Denmark (-86.7%). Because the panel is held constant, this change is not an artefact of countries entering or leaving the sample.
This indicator has no normatively preferred direction; its analytical value lies in the structure of the distribution and in how national positions move relative to each other over time. The estimates above are reproducible: the dataset identifier, filter dimensions and reference period are stated in the methodological note, and the series can be re-downloaded from the Eurostat dissemination API at any time.
Methodological note
Source: Eurostat, dataset migr_asyappctza ('Asylum applicants by type, citizenship, age and sex - annual aggregated data'), extracted from the Eurostat dissemination API (JSON-stat 2.0) on the dataset update of 2026-07-09. Filter dimensions: citizen=TOTAL; applicant=TOTAL; sex=T; age=TOTAL; unit=PER. Unit of measure: applications. Reference period: 2025. Geographic perimeter: national reporting units with two-character geo codes (32 countries with a non-missing observation); European and euro-area aggregates are excluded from the cross-country statistics and reported separately. Descriptive statistics (mean, median, population standard deviation, coefficient of variation) are computed unweighted over reporting countries. Change over time is computed on a constant panel: only countries with a non-missing observation in both the base and the reference period enter the calculation, which removes composition effects but may differ from the officially published aggregate. No imputation, seasonal adjustment or re-scaling has been applied beyond what Eurostat performs at source. Flagged provisional and estimated observations are retained as published.
Source data
The underlying series can be inspected and re-downloaded from the Eurostat data browser.