Spain's Children Face the EU's Highest Risk of Poverty or Social Exclusion
Silver Data Lab Research Desk · Statistical analysis · Published on 11 June 2026
- Data source
- Eurostat
- Reference period
- 2025
- Last updated
- 13 October 2026
Re-checked against the source on 21 October 2026. No value in its datasets has moved between the snapshots we hold. Every revision we have observed →
Key estimates
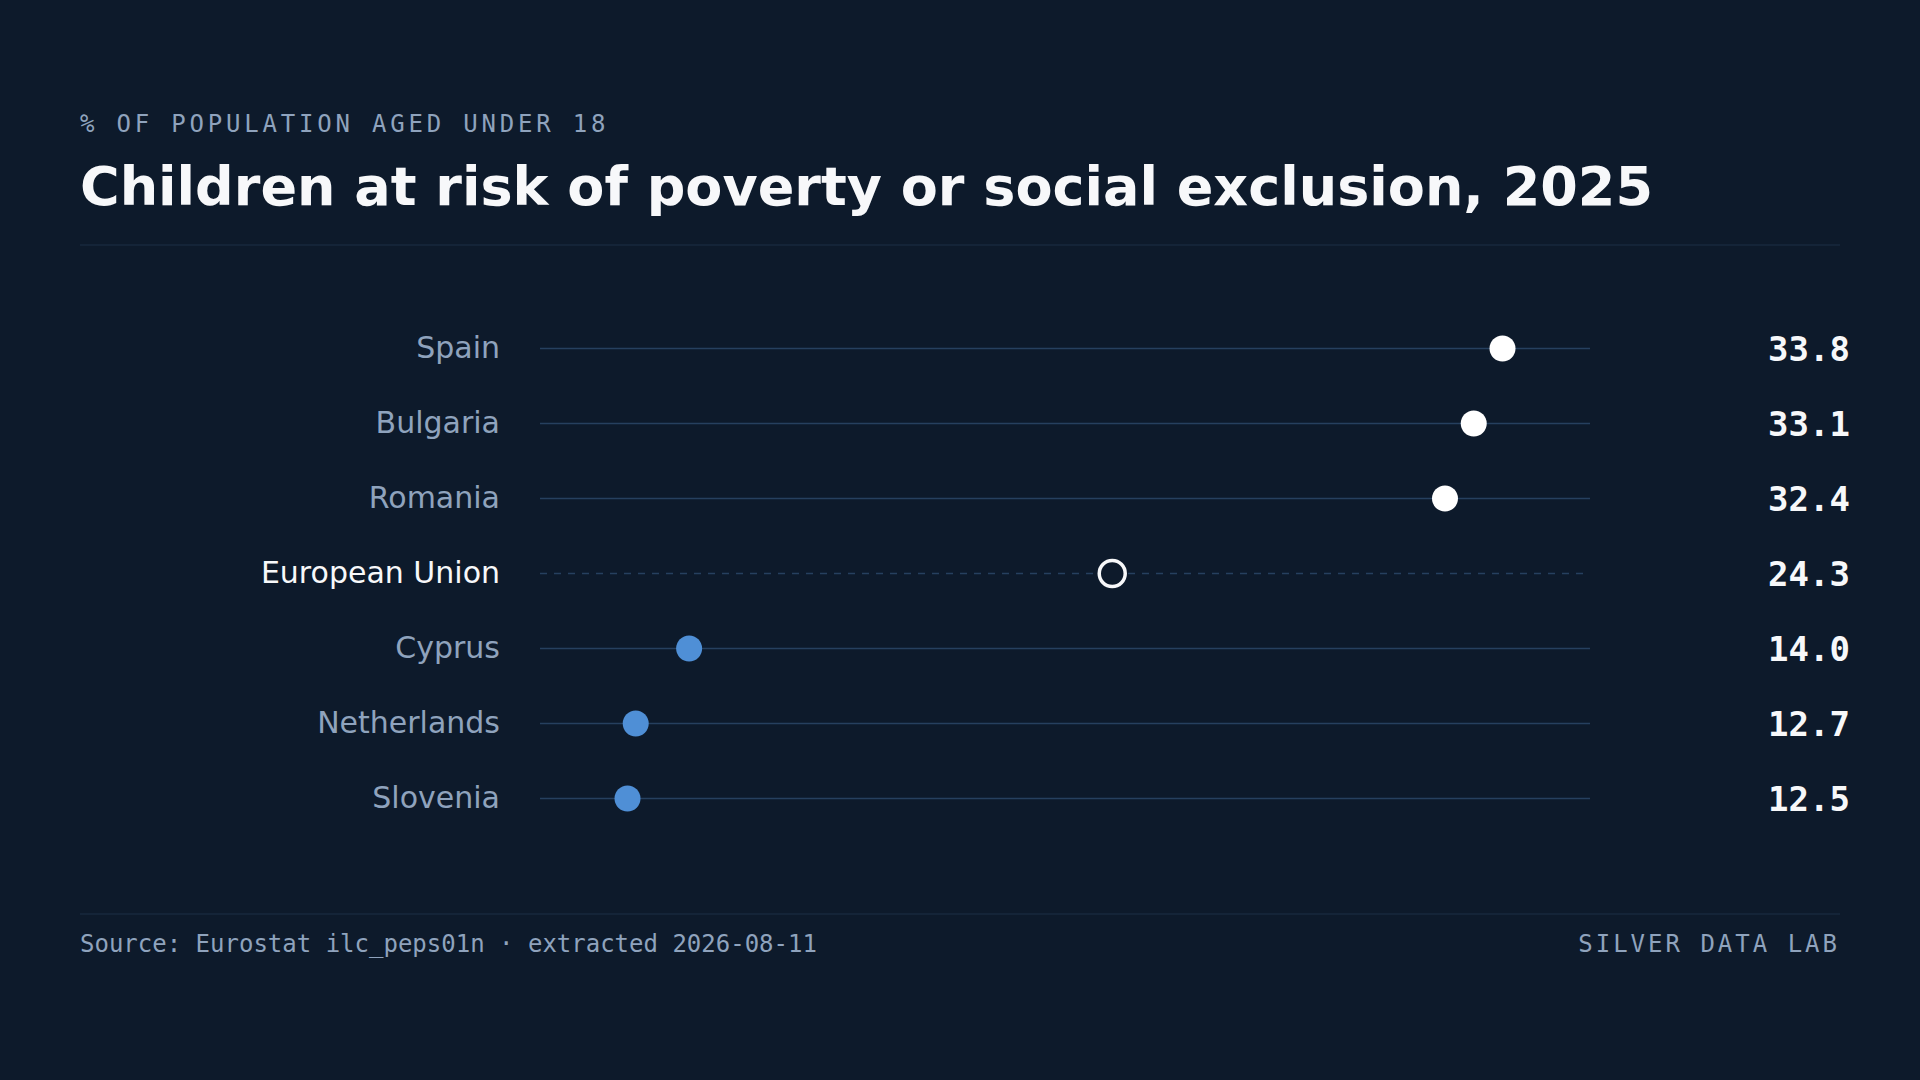
- 24.3% of children in the EU were at risk of poverty or social exclusion in 2025, against 20.9% for the population as a whole.
- Spain records 33.8%, the highest in the Union — above Bulgaria at 33.1% and Romania at 32.4%.
- Slovenia records 12.5%, the Netherlands 12.7% and Cyprus 14.0%.
- The child rate stands above the general one in eighteen Member States and below it in nine.
- France at 27.5% and Italy at 27.1% are both above the EU figure.
Higher than the adult rate in eighteen Member States, lower in nine
The at-risk-of-poverty-or-social-exclusion measure applied to the under-eighteens gives 24.3% across the EU in 2025. The same measure applied to the whole population gives 20.9%.
Children in Europe are more likely to be poor than Europeans in general, by 3.4 percentage points. That figure is an average of two opposite patterns: the child rate stands above the general rate in eighteen Member States and below it in nine. Where it is below, the distance runs from 0.1 points in Finland to 7.1 in Latvia, and Croatia sits 5.0 points clear in the same direction. Each of those distances is derived by subtraction from the two published rates.
Spain at the top
Spain records 33.8%, the highest child poverty risk in the Union.
That position is the finding, because Spain is not the poorest Member State. Bulgaria at 33.1% and Romania at 32.4% follow it, and both have substantially lower national incomes: Bulgaria's GDP per capita is 68 on the EU index against Spain's 92.
A country with a third more output per head than Bulgaria records a marginally higher share of children at risk. Whatever produces that outcome, it is not the general level of Spanish prosperity.
Spain is also where the two rates are furthest apart: 33.8% for children against 25.7% for the population as a whole, a distance of 8.1 points where the EU's is 3.4. The Spanish general rate is itself the fifth highest in the Union, and the child rate stands further above it than anywhere else.
Greece follows at 29.6%, France at 27.5% and Italy at 27.1% — placing three of the Union's four largest economies above the EU figure.
Where children do best
Slovenia records 12.5%, the Netherlands 12.7%, Cyprus 14.0% and Denmark 14.8%.
Slovenia is the strongest performer in the Union on this measure and it also records the lowest overcrowding among eastern Member States and one of the lowest NEET rates. On indicators concerning young people specifically, Slovenia performs consistently better than its income would predict.
What the composite conceals
This is the same three-part composite used for the general population: low income relative to the national median, severe material deprivation, or very low household work intensity. A child is counted if any one applies.
Because children do not have incomes of their own, all three conditions are properties of the household they live in. Child poverty in this framework is household poverty observed through the children in it, and a country can reduce it either by raising household incomes or by changing which households have children.
Children at risk of poverty or social exclusion, 2025
| Country | % of population under 18 | Gap to EU averagepercentage points, derived |
|---|---|---|
| Spain | 33.8 | +9.5 |
| Bulgaria | 33.1 | +8.8 |
| Romania | 32.4 | +8.1 |
| European Unionaggregate | 24.3 | — |
| Cyprus | 14.0 | −10.3 |
| Netherlands | 12.7 | −11.6 |
| Slovenia | 12.5 | −11.8 |
This table as data: CSV · JSON
Every Member State for this indicator+
Members see every Member State for this indicator here, not only the rows the ranking prints. Become a Member
Embed this chart
Paste this code into a page. The frame carries the source and the extraction date, and links back to the study.
What these figures cannot tell you
- The income threshold is national
- Like the general measure, the income component uses 60% of each country's own median. A Spanish child and a Bulgarian child counted here live in households at very different absolute income levels.
- Children are counted through their households
- Under-eighteens have no independent income, so every component of this measure describes the household. The indicator identifies children living in poor households rather than a separate condition of childhood.
- A composite
- A child is counted once whether one, two or three conditions apply, and the headline rate cannot show which of the three is driving a country's result.
- Survey data
- Figures come from EU-SILC, a sample survey, and are estimates rather than counts.
Frequently asked questions
- How many children in the EU are at risk of poverty?
- 24.3% of those aged under 18 in 2025, against 20.9% for the population as a whole. Children face a higher risk than the general population in most Member States.
- Which EU country has the worst child poverty?
- Spain, at 33.8% in 2025, ahead of Bulgaria at 33.1% and Romania at 32.4%. Spain's position is notable because its GDP per capita is well above both.
- Which EU country has the least child poverty?
- Slovenia, at 12.5% in 2025, followed by the Netherlands at 12.7% and Cyprus at 14.0%.
- Why is child poverty higher than adult poverty?
- Because households with children are more likely to meet one of the three conditions in the composite — low relative income, material deprivation or low work intensity. Children have no income of their own, so the measure describes the households they live in.
Methodological note
The indicator is Eurostat's at-risk-of-poverty-or-social-exclusion rate restricted to the population aged under 18, using the same three-part definition as the general measure: income below 60% of the national median, severe material and social deprivation, or very low work intensity in the household.
Values are for 2025, the most recent year with complete coverage of the 27 Member States at the extraction date, and match the reference year of the general poverty study published alongside it.
The same table is extracted a second time for the whole population and declared below beside the child series, so each comparison between the two rates rests on its own archived extraction. The distances between them — 3.4 points for the EU, 8.1 for Spain, and the country figures quoted above — are derived by Silver Data Lab by subtraction. The GDP per capita comparisons come from the economy and finance category.
Source data
This study draws on 2 datasets from Eurostat. Each can be inspected and re-downloaded from its catalogue, and the filters below are the ones applied.
Persons at risk of poverty or social exclusion by age and sex
ilc_peps01n
- Filters applied:
- freq=A · age=Y_LT18 · sex=T · unit=PC · time=2025
- Extracted:
- 2026-10-21
- Source last updated:
- 2026-10-20
Persons at risk of poverty or social exclusion by age and sex
ilc_peps01n
- Filters applied:
- freq=A · age=TOTAL · sex=T · unit=PC · time=2025
- Extracted:
- 2026-10-21
- Source last updated:
- 2026-10-20
Download the data
The data the study you have just read is built on, exactly as it was downloaded and archived.
Yours as a Member.
Data downloadable by Members
How to cite
Record the vintage as well as the study: the figures on this page are the ones extracted on the dates below.
Silver Data Lab Research Desk (2026). Spain's Children Face the EU's Highest Risk of Poverty or Social Exclusion. Silver Data Lab, published 11 June 2026, last updated 13 October 2026. https://www.silverdatalab.com/studies/child-poverty-in-the-eu
- Data: Eurostat, Persons at risk of poverty or social exclusion by age and sex (ilc_peps01n), filters freq=A, age=Y_LT18, sex=T, unit=PC, time=2025; extracted 2026-10-21; source last updated 2026-10-20. https://doi.org/10.2908/ilc_peps01n
- Data: Eurostat, Persons at risk of poverty or social exclusion by age and sex (ilc_peps01n), filters freq=A, age=TOTAL, sex=T, unit=PC, time=2025; extracted 2026-10-21; source last updated 2026-10-20. https://doi.org/10.2908/ilc_peps01n
Silver Data Lab's analysis is licensed CC BY 4.0. The statistics remain their publisher's and keep its terms of reuse.
Ask the research desk
A question about this study — a definition, a filter, a break in the series, what the figures can and cannot support — answered by the desk that made the extraction.
Members can write to the research desk
Other studies on the same dataset
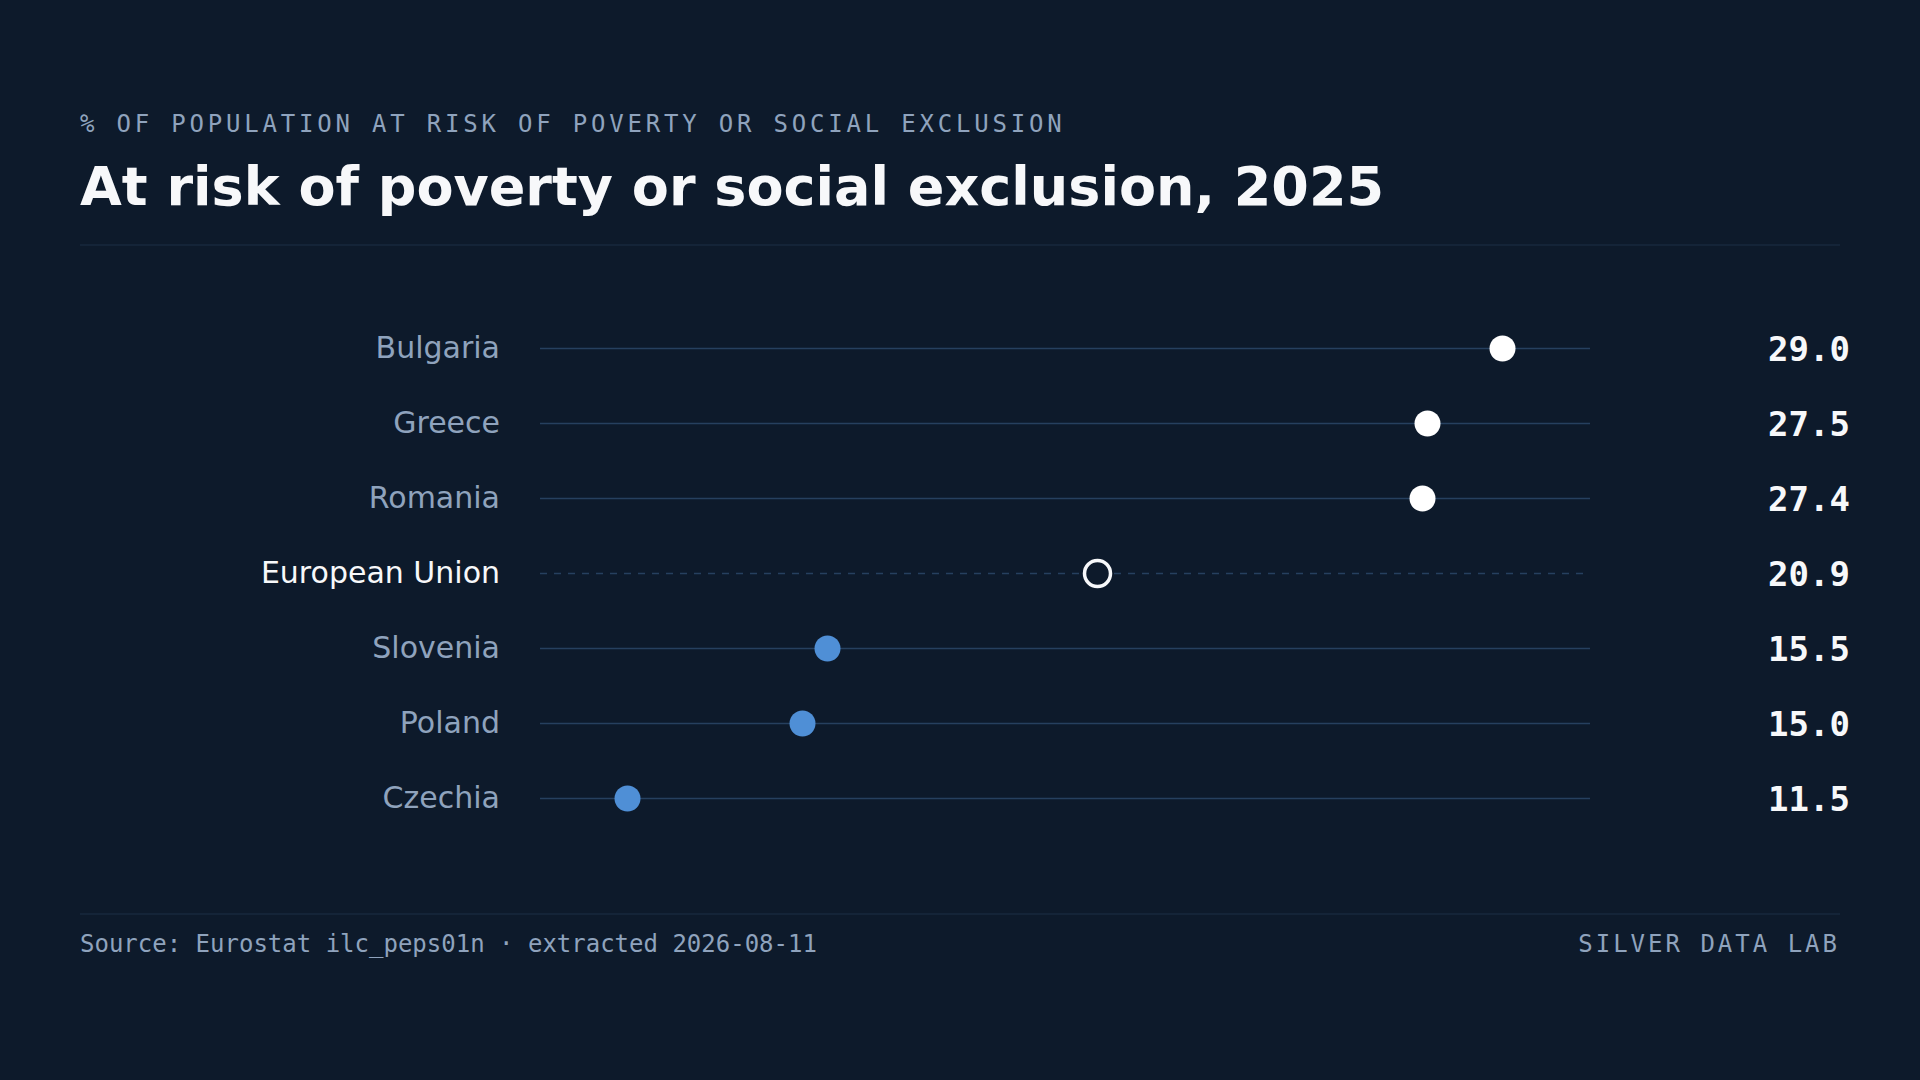
One in Five Europeans Is at Risk of Poverty or Exclusion
20.9% of the EU population was at risk of poverty or social exclusion in 2025 — roughly one person in five.
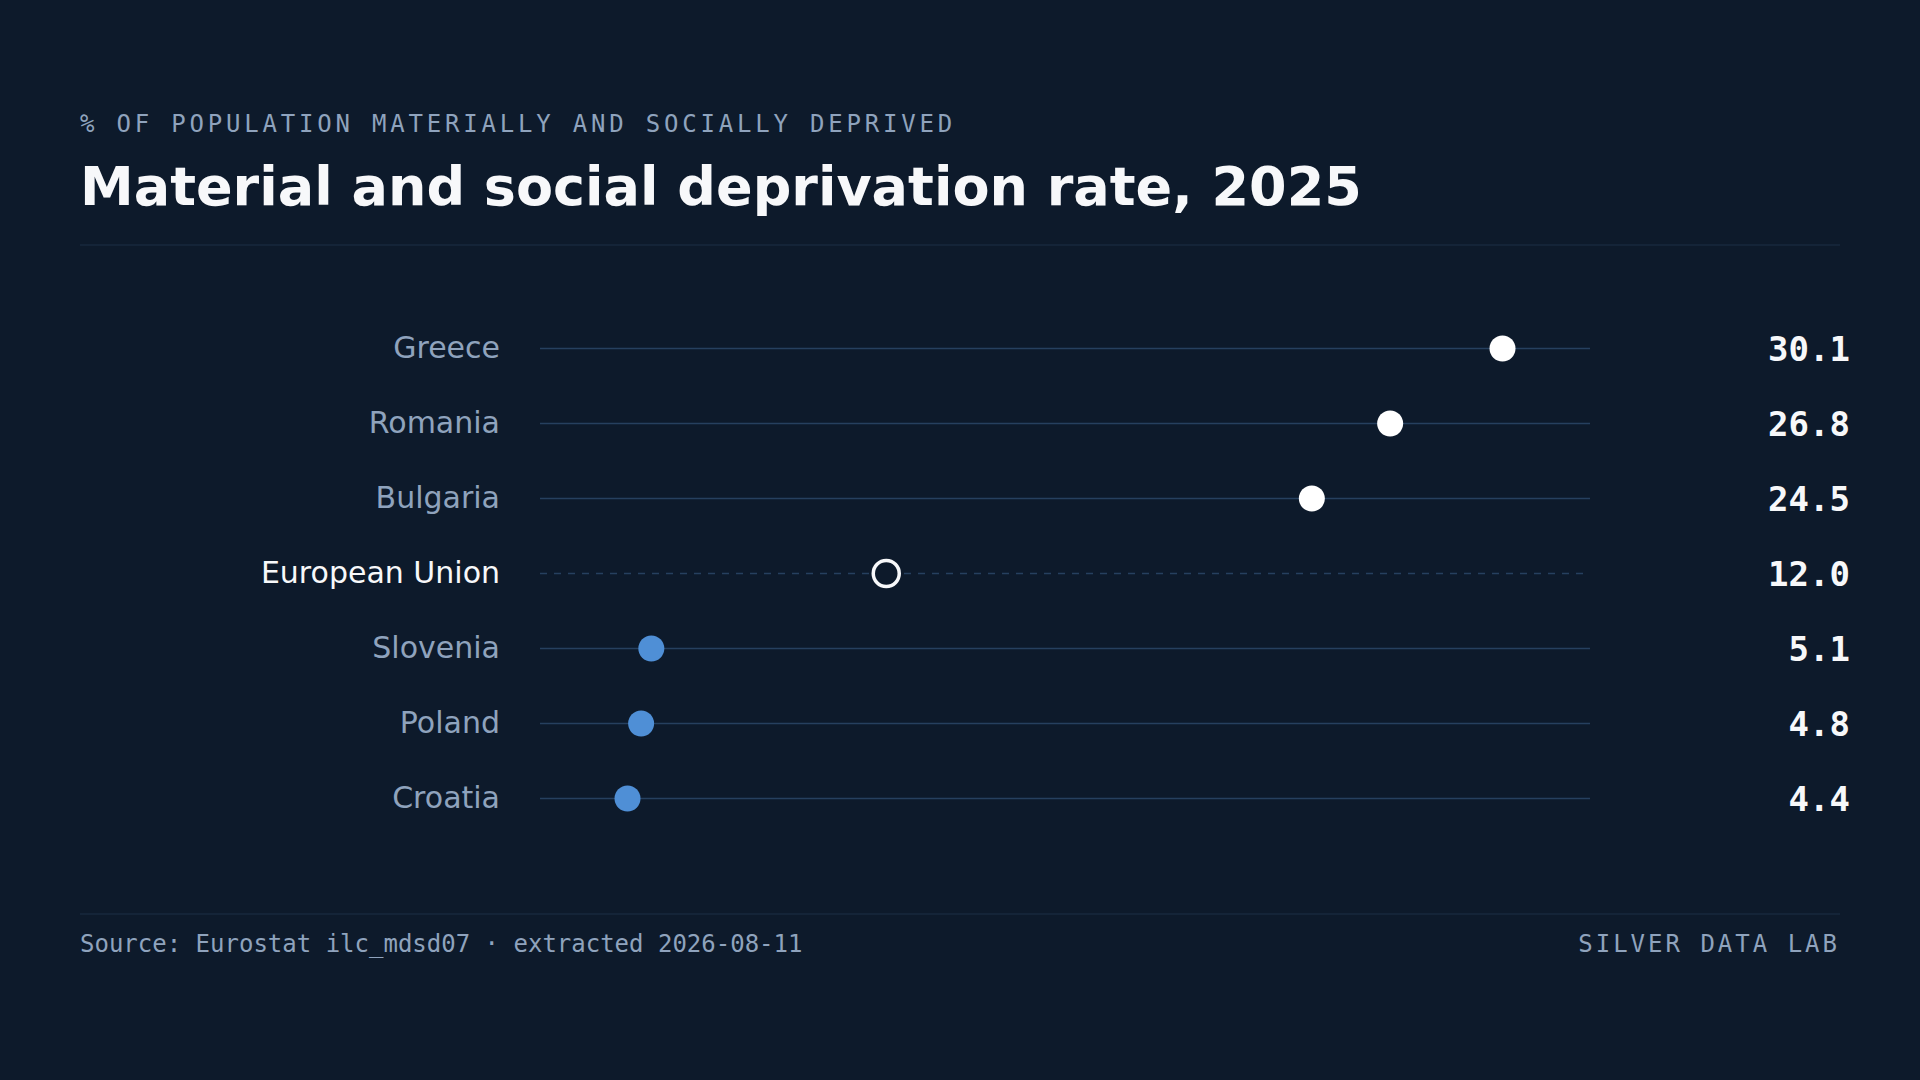
Croatians Are the Least Likely in the EU to Go Without Essentials
12.0% of the EU population was materially and socially deprived in 2025, against 20.9% at risk of poverty or social exclusion.
Studies where the same country leads or trails
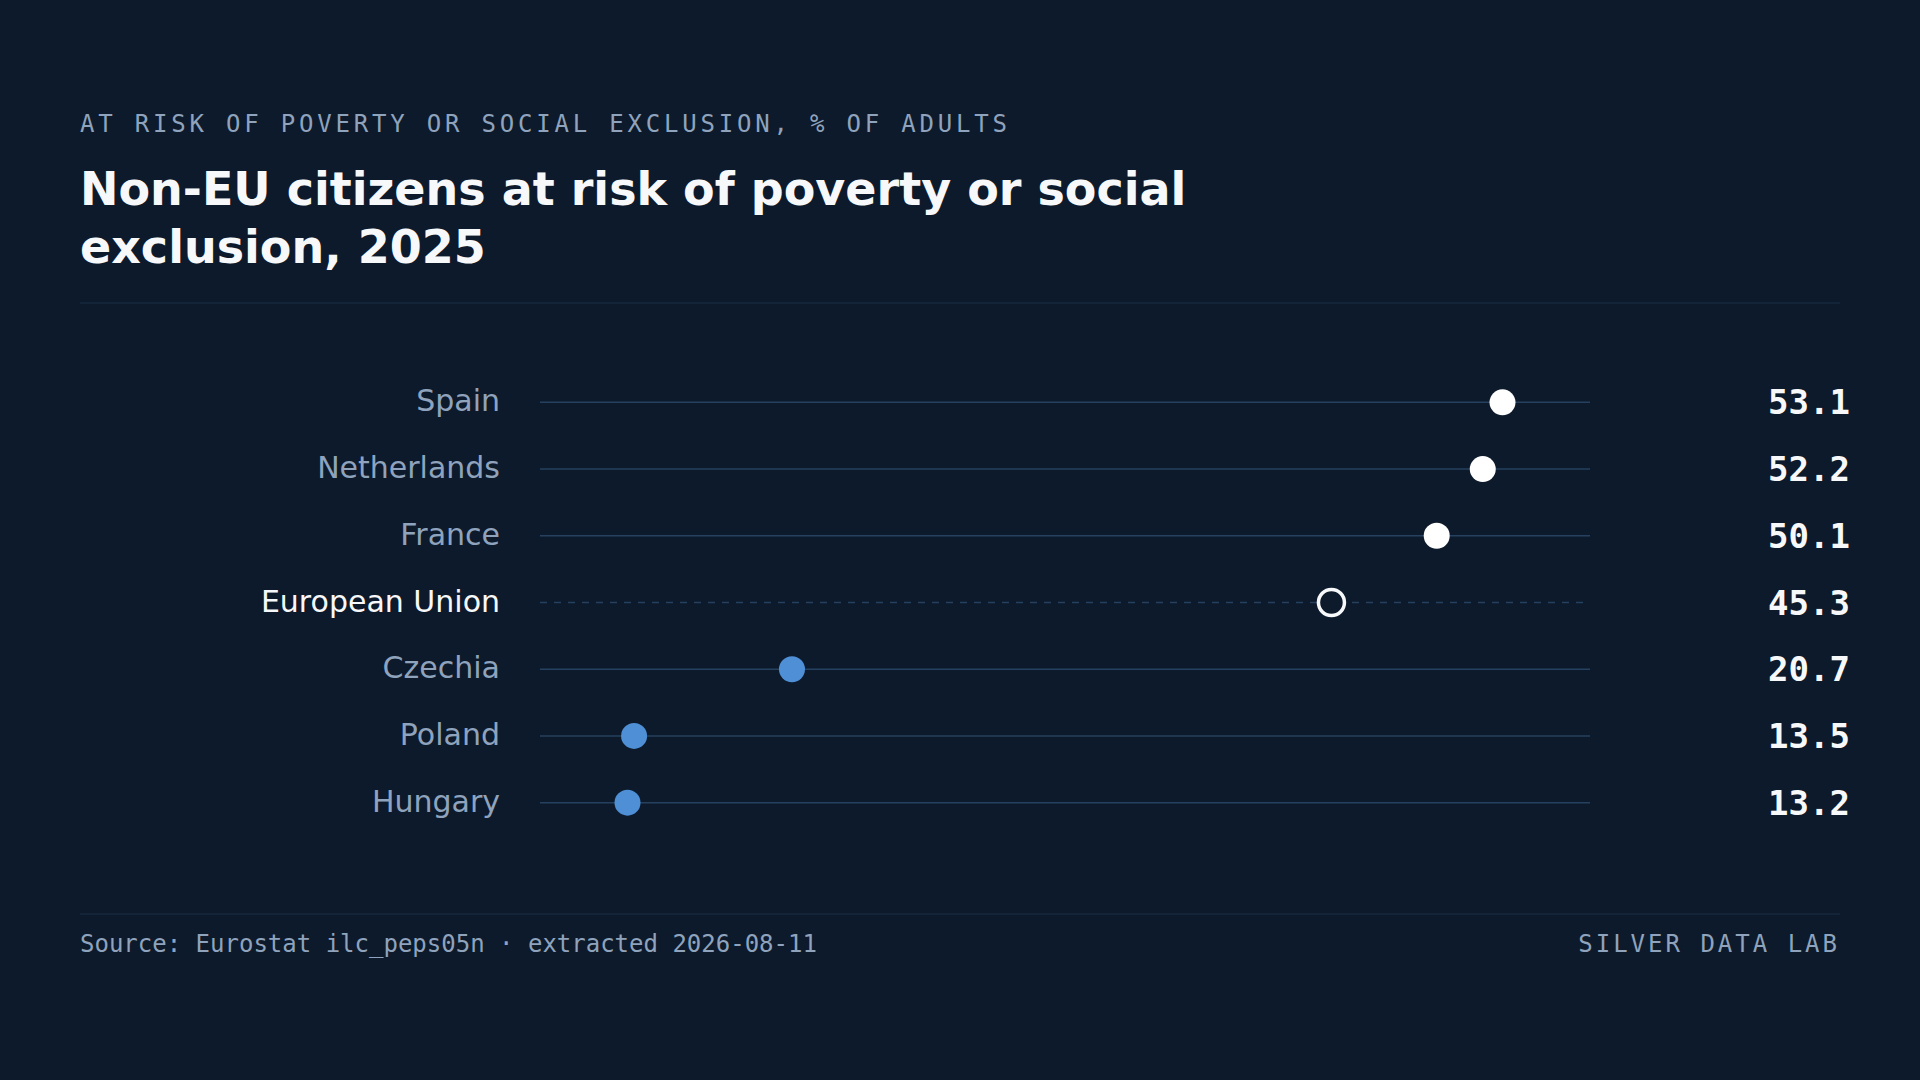
52.2% of Adult Non-EU Citizens in the Netherlands Risk Poverty or Exclusion
45.3% of non-EU citizens aged 18 and over in the EU were at risk of poverty or social exclusion in 2025, against 18.2% of nationals.
Latvian Women Outlive Latvian Men by 9.8 Years, the Widest Gap in the EU
Life expectancy at birth across the EU was 81.5 years in 2024: 84.1 for women and 78.9 for men.
EU Jobless Figures Miss Nearly Half of People Who Want a Job or More Hours
23.9 million people aged 20 to 64 in the EU wanted more paid work in 2025 than they were able to get — 11.0% of the extended labour force.