Energy Prices Fell on Average in the EU but Rose 7.6% in Austria
Silver Data Lab Research Desk · Statistical analysis · Published on 09 February 2026
- Data source
- Eurostat
- Reference period
- 2025
- Last updated
- 11 October 2026
Re-checked against the source on 11 August 2026. No value in its datasets has moved between the snapshots we hold. Every revision we have observed →
Key estimates
- Energy prices in the EU fell 0.6% on average in 2025.
- Austria records +7.6%, Romania +7.5% and Belgium +4.7%.
- France records -5.4%, Cyprus -5.2% and Czechia -4.4%.
- The spread between Austria and France is 13 percentage points on the same commodity class.
- Energy orders the Member States differently from the headline rate, food more differently still, and services tracks the headline most closely.
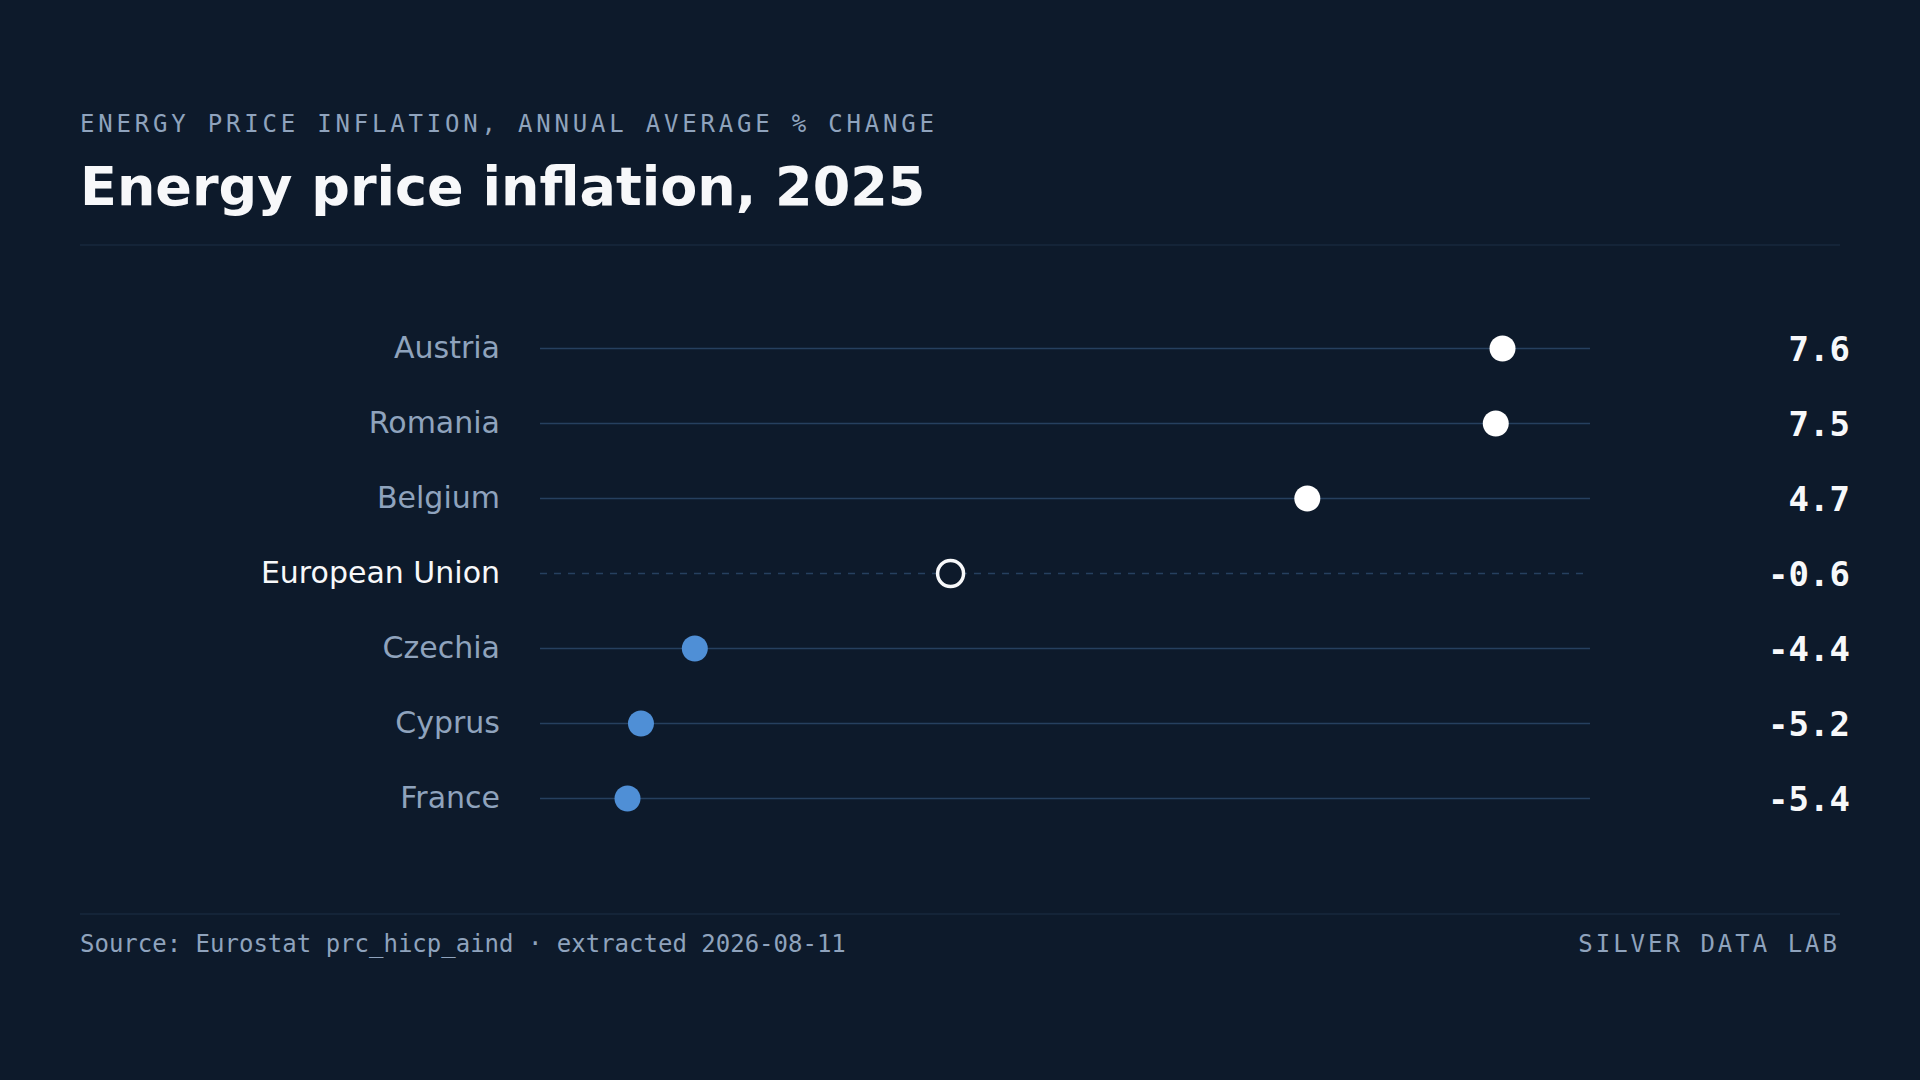
A negative number across the Union
Energy prices in the EU were 0.6% lower on average in 2025 than in 2024. After three years in which energy drove European inflation upward, the direction reversed.
That is the aggregate. Underneath it, national rates run from +7.6% to -5.4%.
Why the spread is so wide on a traded commodity
Wholesale gas and electricity are traded across an integrated European market. The price a household pays is not.
Between the wholesale market and the meter sit network charges, taxes and levies, national price caps, the timing of tariff changes, and the residue of the emergency support schemes introduced in 2022. Most of those are national, and several of them were being withdrawn during 2025 on different timetables.
Austria at +7.6% is largely a case of support being removed: measures that had suppressed household energy prices expired, and the index recorded the increase as inflation even though the underlying wholesale price was falling. Nothing about Austrian energy became more expensive to produce.
That is the central difficulty in reading this indicator for 2025. It is measuring the unwinding of interventions as much as the movement of energy prices.
The falls
France records -5.4%, Cyprus -5.2%, Czechia -4.4% and Finland -3.8%. In these Member States regulated tariffs or market prices moved down over the year.
France's position reflects a regulated electricity tariff that was reduced in 2025, following the period in which the same mechanism had held prices below market levels and was being repaid.
Why this matters for the headline rate
Energy has an outsized effect on measured inflation relative to its weight in the basket, because it moves further and faster than almost anything else.
In 2025 that effect ran downward: a negative energy component pulled headline inflation below what food and services alone would have produced. The overall inflation study on this site reports the result, and the services study reports the component that pushed the other way.
It does not follow that the headline ranking is the energy ranking. Ranking the Member States by each component and comparing those orders with the order of the headline rate, services comes closest to it, energy is further away, and food is furthest of the three. Energy moves the level of a country's headline rate more than anything else in the basket; it is not what decides that country's position among the twenty-seven.
Energy price inflation, 2025
| Country | annual average % change | Gap to EU averagepercentage points, derived |
|---|---|---|
| Austria | 7.6 | +8.2 |
| Romania | 7.5 | +8.1 |
| Belgium | 4.7 | +5.3 |
| European Unionaggregate | -0.6 | — |
| Czechia | -4.4 | −3.8 |
| Cyprus | -5.2 | −4.6 |
| France | -5.4 | −4.8 |
This table as data: CSV · JSON
Every Member State for this indicator+
Members see every Member State for this indicator here, not only the rows the ranking prints. Become a Member
Embed this chart
Paste this code into a page. The frame carries the source and the extraction date, and links back to the study.
What these figures cannot tell you
- 2025 measures policy withdrawal as much as prices
- Emergency energy support introduced across the Union from 2022 was removed on different national timetables. Where a subsidy ended, the index records a price increase even if the underlying cost of energy fell. Austria is the clearest case.
- Household prices, not wholesale prices
- The index measures what households pay, which includes network charges, taxes and levies set nationally. Wholesale energy markets are integrated across Europe; retail prices are not.
- An annual average
- The figure compares average 2025 prices with average 2024 prices. Within-year timing of tariff changes affects the annual average in ways that a point-to-point comparison would not show.
- Composition of the energy category
- The category combines electricity, gas, heating fuels and motor fuels. Member States differ in the mix households consume, so the same commodity movements produce different national indices.
Frequently asked questions
- Did energy prices fall in the EU?
- On average yes. EU energy prices were 0.6% lower in 2025 than in 2024, after three years in which energy drove European inflation upward. Sixteen Member States were above the EU figure and twelve recorded outright increases.
- Which EU country had the highest energy inflation?
- Austria, at 7.6% in 2025, followed by Romania at 7.5% and Belgium at 4.7%. The Austrian figure largely reflects the expiry of measures that had been suppressing household energy prices rather than a rise in underlying costs.
- Where did energy prices fall most?
- France, at -5.4%, followed by Cyprus at -5.2% and Czechia at -4.4%. France's regulated electricity tariff was reduced during the year.
- Why do energy prices differ so much between EU countries?
- Because wholesale energy markets are integrated but retail prices are not. Network charges, taxes, levies, price caps and the timing of tariff changes are all national, and in 2025 emergency support schemes were being withdrawn on different national timetables.
Methodological note
This study uses the energy special aggregate of the harmonised index of consumer prices, as the annual average rate of change for 2025.
Values cover all 27 Member States and the EU aggregate as published. The count of Member States with a positive rate treats Malta, at 0.0%, as neither a rise nor a fall.
The comparison of component rankings with the headline ranking is derived by Silver Data Lab: each of energy, food and services is ranked across the 27 Member States, as is the all-items index declared below, and the orders are compared by rank correlation. It is reported as a correspondence between rankings and nothing more — no component is said to cause another.
The attribution of the Austrian increase to the withdrawal of support measures is offered as an explanation consistent with the data rather than as a finding from it: this extraction contains prices, not policy. The comparisons with food, services and headline inflation draw on companion studies on this site.
Source data
This study draws on 2 datasets from Eurostat. Each can be inspected and re-downloaded from its catalogue, and the filters below are the ones applied.
HICP - annual data (average index and rate of change)
prc_hicp_aind
- Filters applied:
- freq=A · unit=RCH_A_AVG · coicop=NRG, CP011, SERV · time=2025
- Extracted:
- 2026-08-11
- Source last updated:
- 2026-02-06
HICP - annual data (average index and rate of change)
prc_hicp_aind
- Filters applied:
- freq=A · unit=RCH_A_AVG · coicop=CP00 · time=2025
- Extracted:
- 2026-08-11
- Source last updated:
- 2026-02-06
Download the data
The data the study you have just read is built on, exactly as it was downloaded and archived.
Yours as a Member.
Data downloadable by Members
How to cite
Record the vintage as well as the study: the figures on this page are the ones extracted on the dates below.
Silver Data Lab Research Desk (2026). Energy Prices Fell on Average in the EU but Rose 7.6% in Austria. Silver Data Lab, published 09 February 2026, last updated 11 October 2026. https://www.silverdatalab.com/studies/energy-inflation-in-the-eu
- Data: Eurostat, HICP - annual data (average index and rate of change) (prc_hicp_aind), filters freq=A, unit=RCH_A_AVG, coicop=NRG, CP011, SERV, time=2025; extracted 2026-08-11; source last updated 2026-02-06. https://doi.org/10.2908/prc_hicp_aind
- Data: Eurostat, HICP - annual data (average index and rate of change) (prc_hicp_aind), filters freq=A, unit=RCH_A_AVG, coicop=CP00, time=2025; extracted 2026-08-11; source last updated 2026-02-06. https://doi.org/10.2908/prc_hicp_aind
Silver Data Lab's analysis is licensed CC BY 4.0. The statistics remain their publisher's and keep its terms of reuse.
Ask the research desk
A question about this study — a definition, a filter, a break in the series, what the figures can and cannot support — answered by the desk that made the extraction.
Members can write to the research desk
Other studies on the same dataset
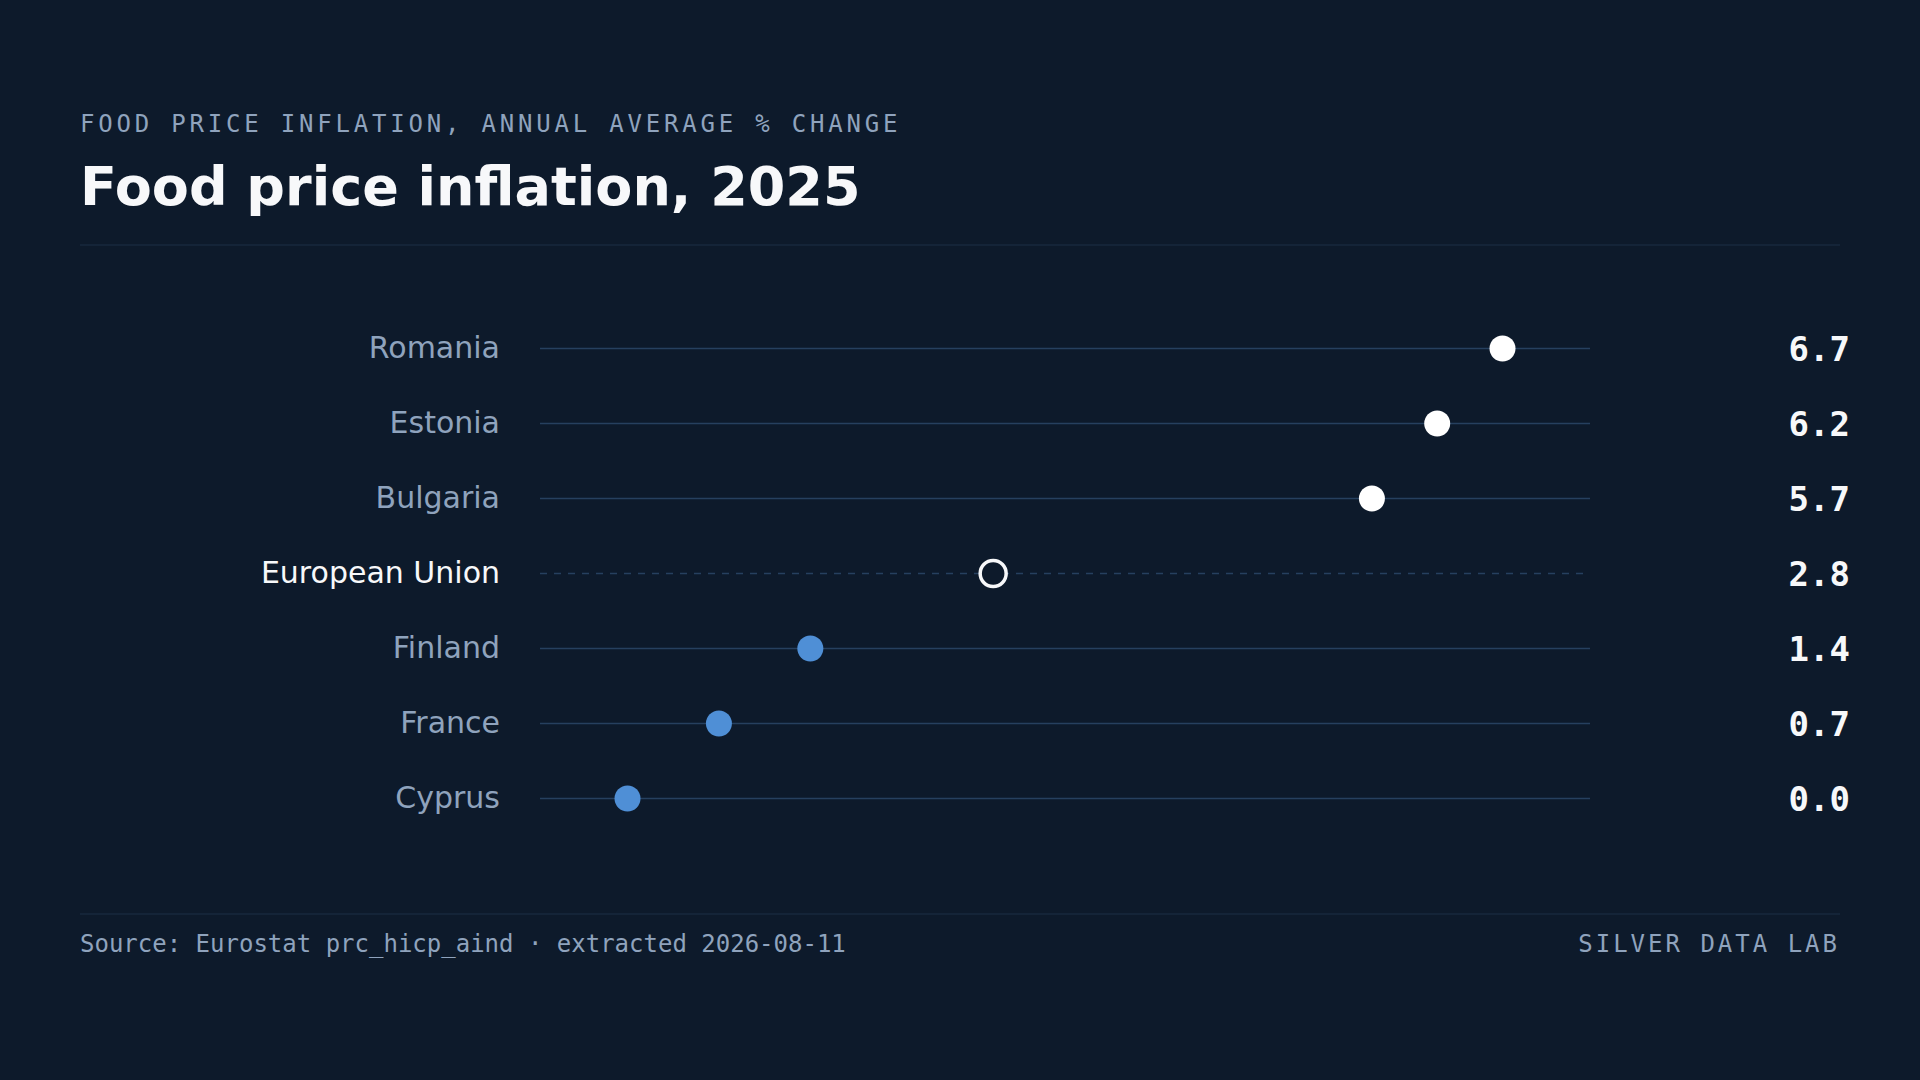
Food Prices Rose 6.7% in Romania and Not at All in Cyprus
Food prices in the EU rose 2.8% on average in 2025.
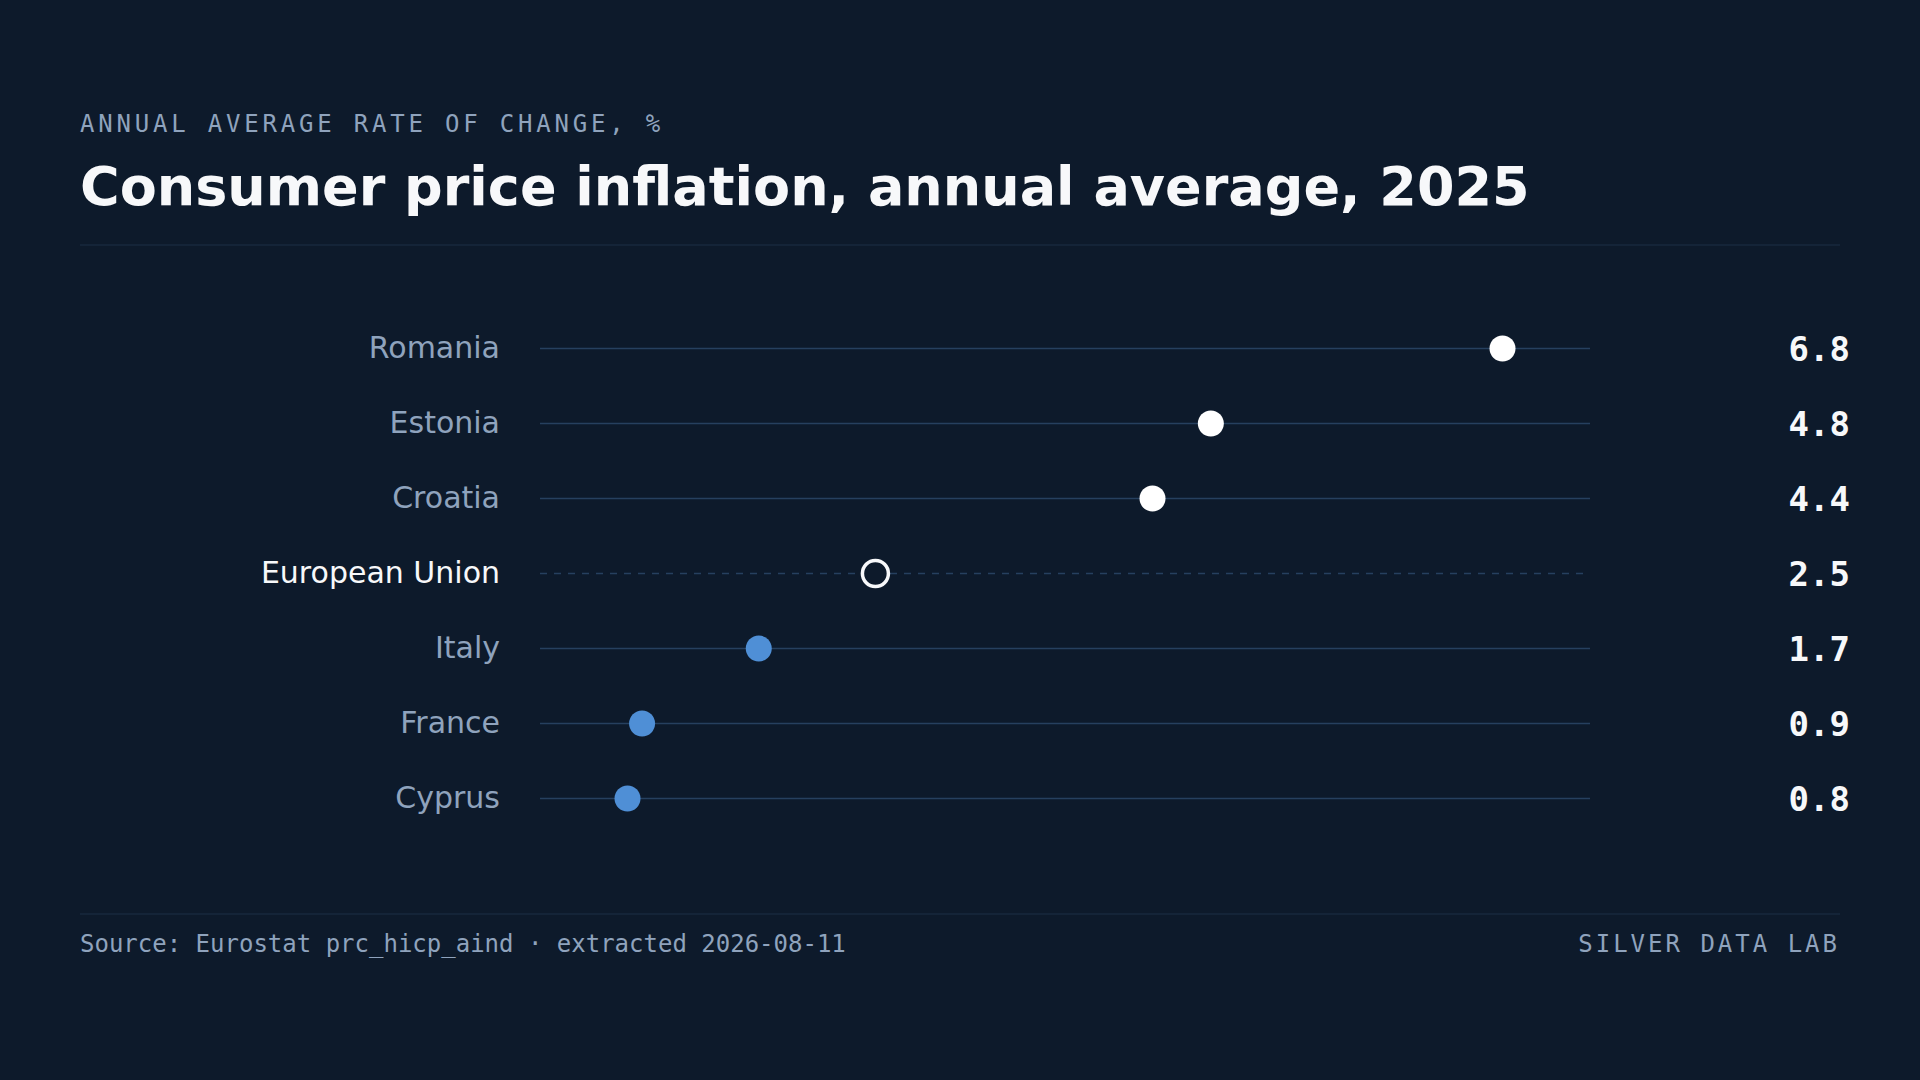
Prices Rose Eight Times Faster in Romania Than in Cyprus
Consumer prices across the EU rose 2.5% on annual average in 2025, and 2.1% in the euro area.
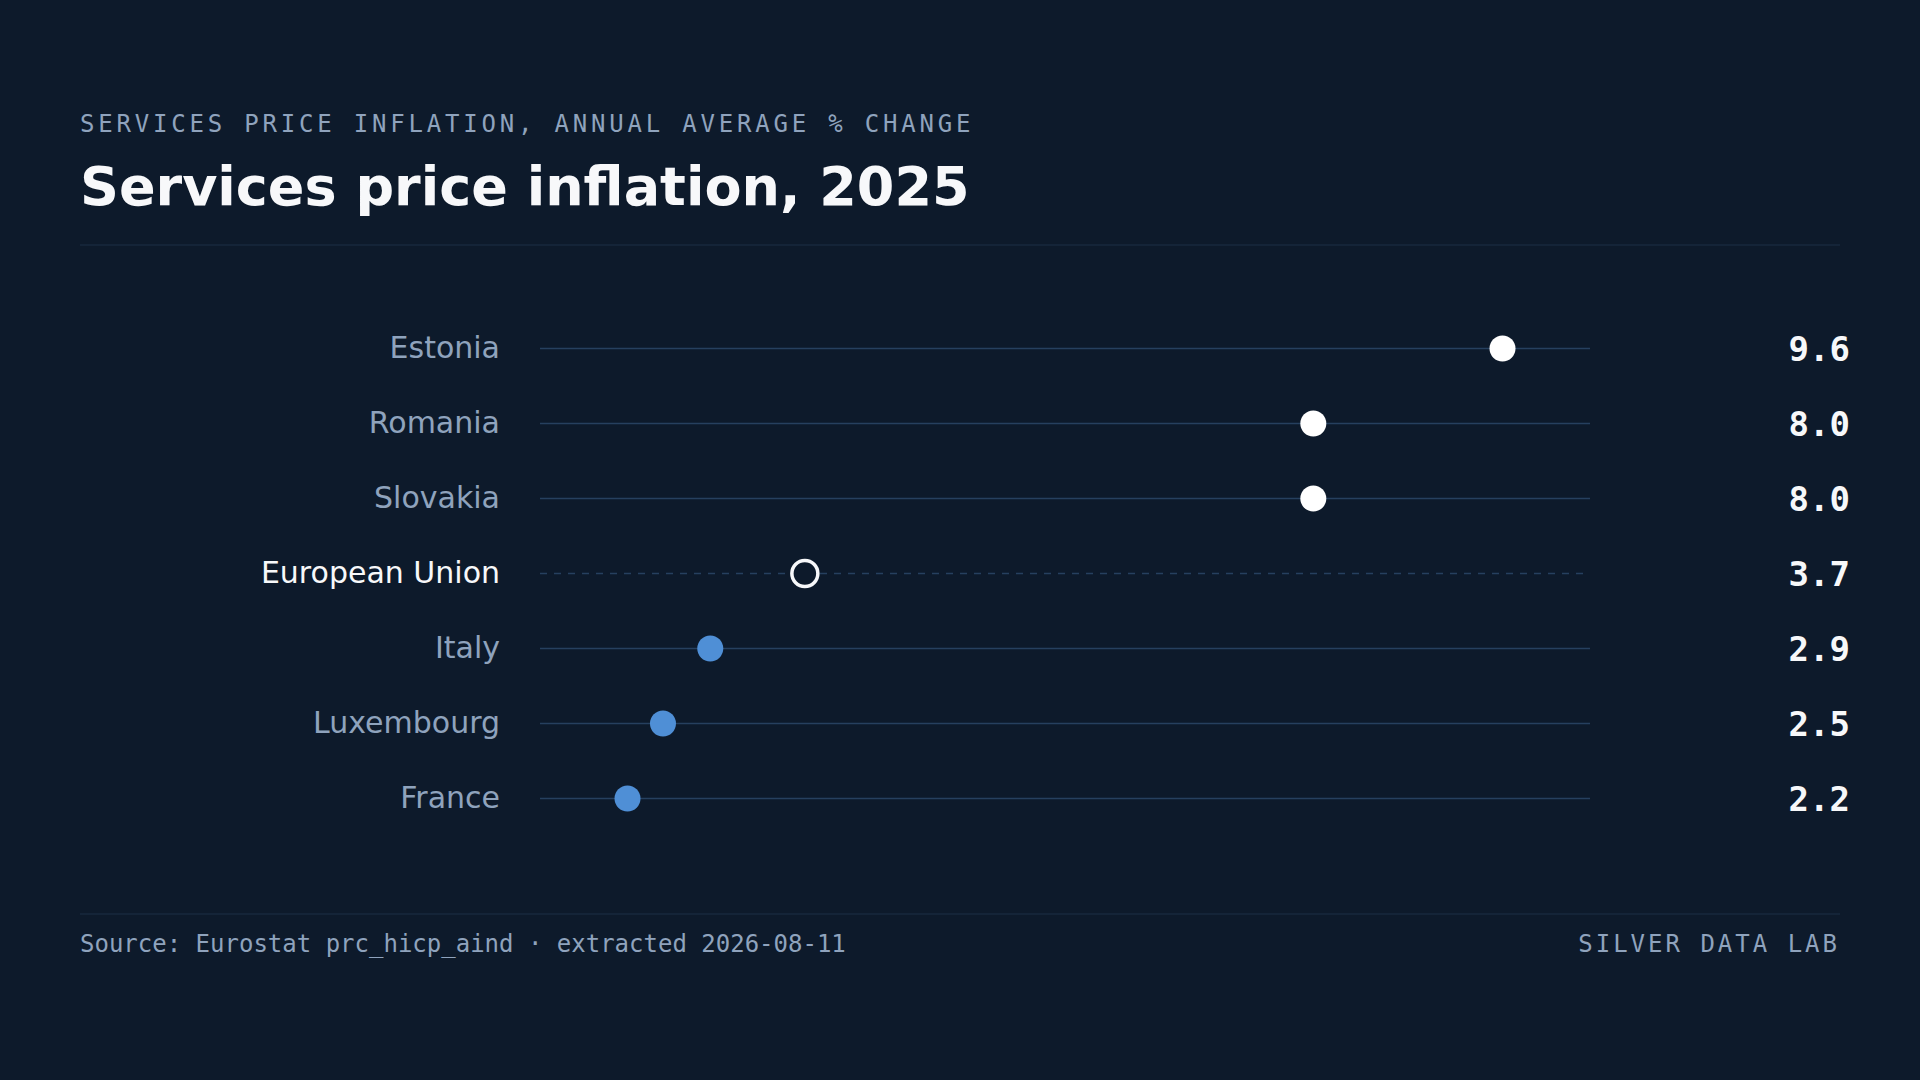
In One Year, EU Services Prices Rose While Energy Prices Fell
Services prices in the EU rose 3.7% in 2025, against 2.8% for food and -0.6% for energy.
Studies where the same country leads or trails
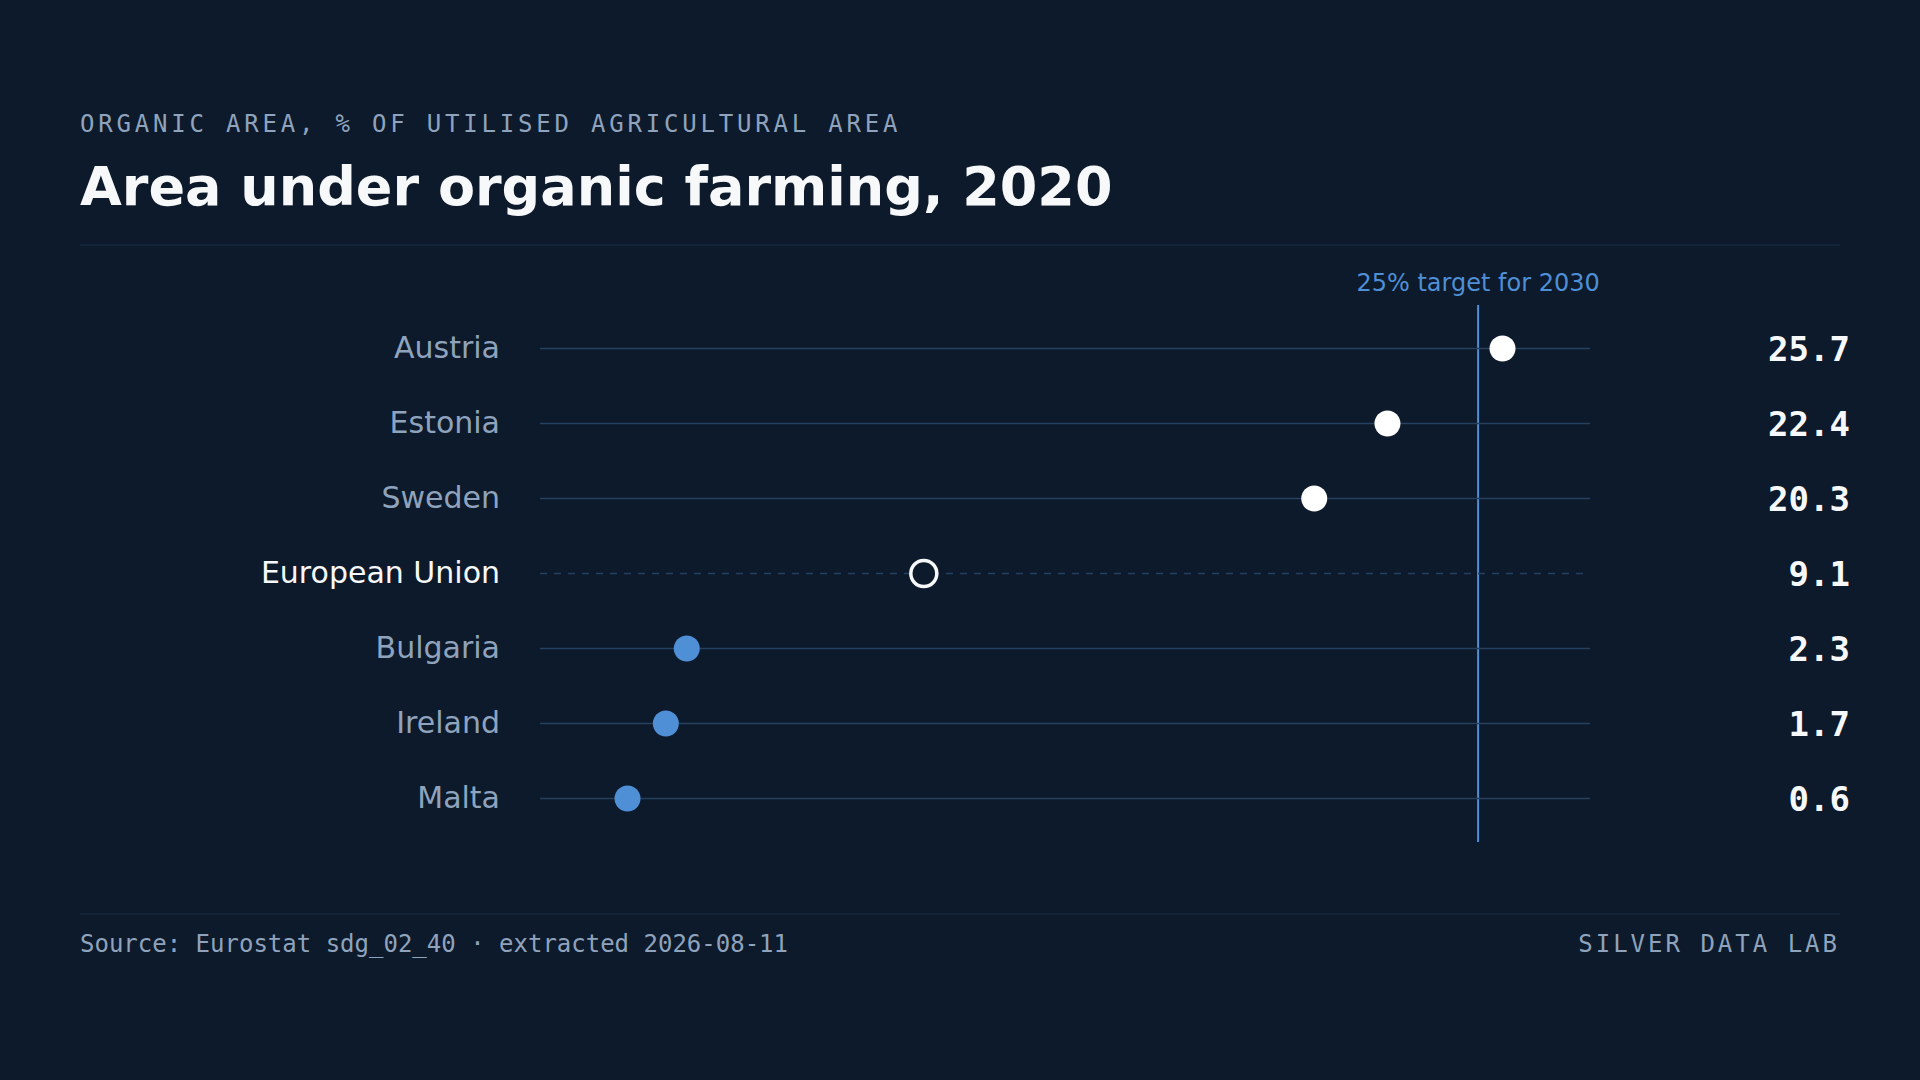
Austria Already Farms a Quarter of Its Farmland Organically
9.1% of the EU's utilised agricultural area was under organic management in 2020, against a target of 25% by 2030.
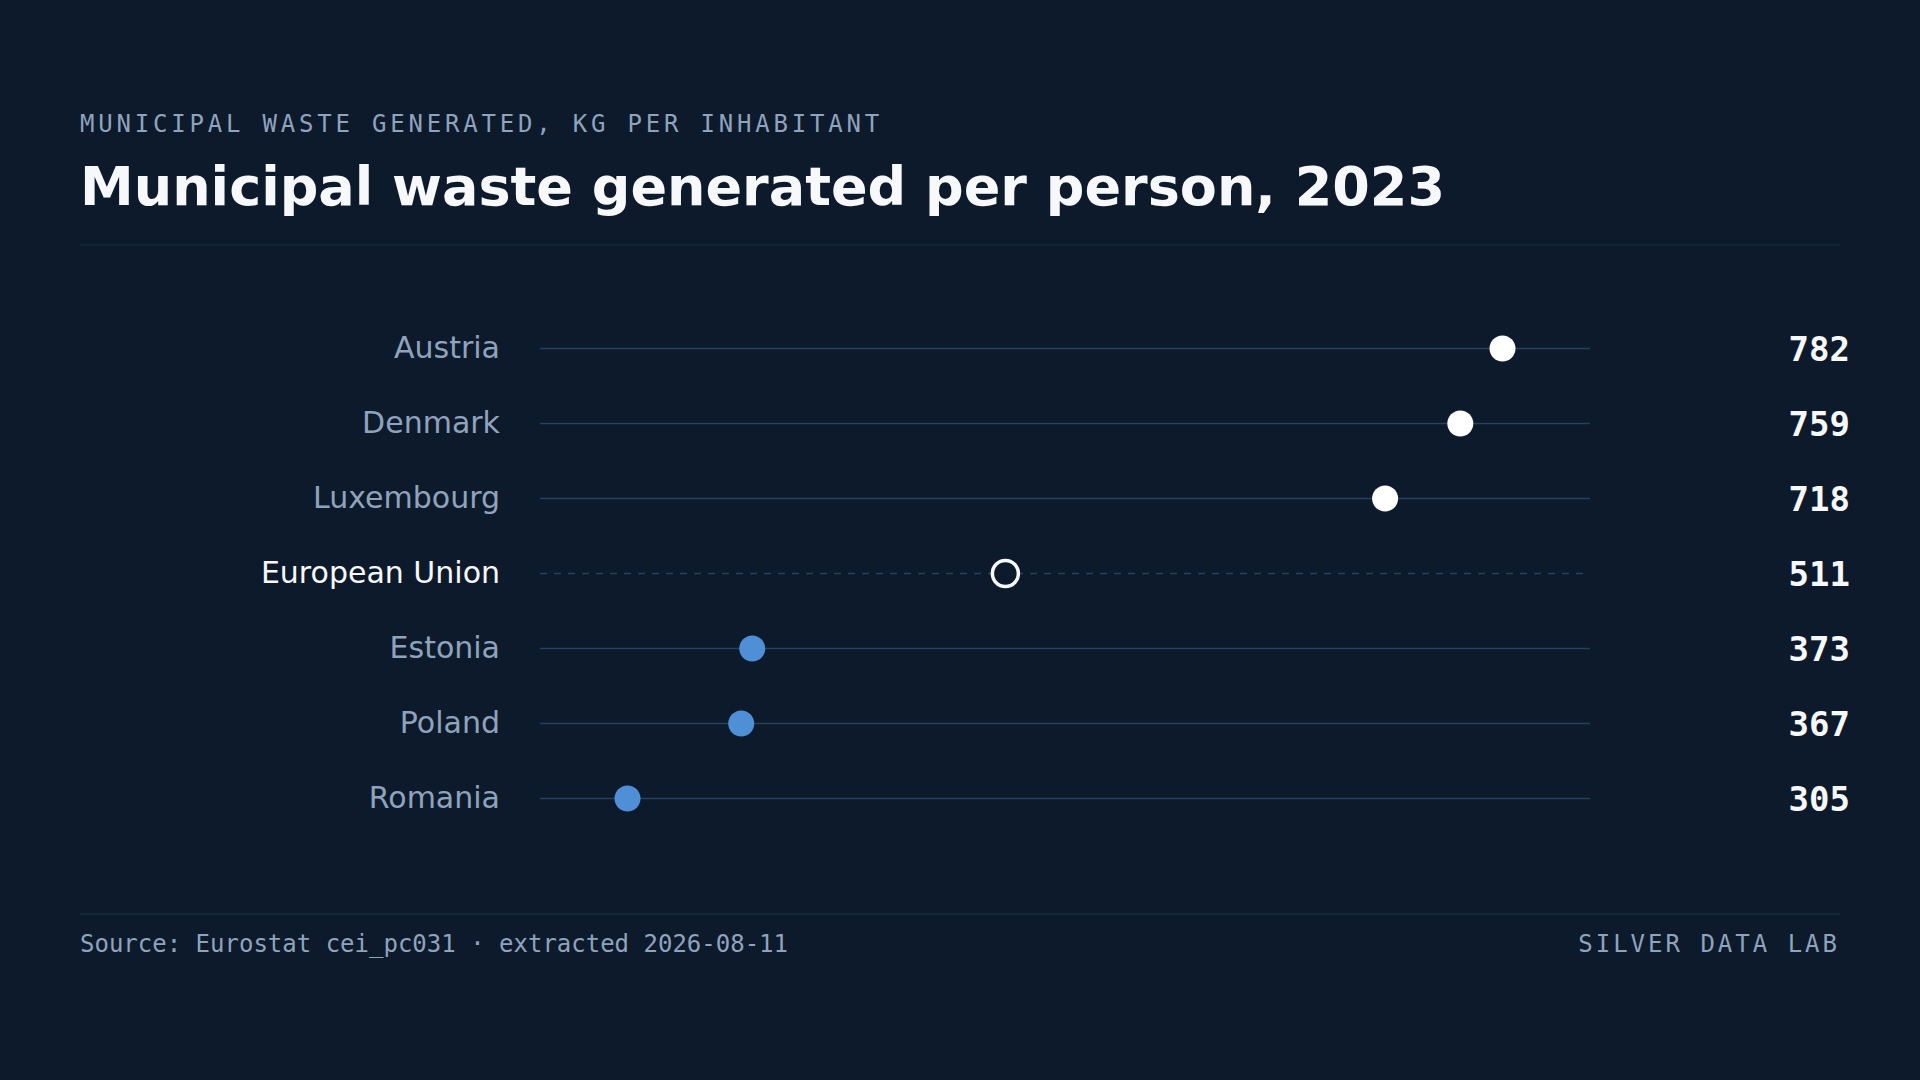
Austria Produces More Rubbish per Person Than Any Other EU Country
The EU generated 510 kg of municipal waste per inhabitant in 2023 — about 1.4 kg per person per day.