EU Industrial Output Is Where It Was Four Years Ago
Silver Data Lab Research Desk · Statistical analysis · Published on 11 August 2026
- Data source
- Eurostat
- Reference period
- 2025
- Last updated
- 16 October 2026
Re-checked against the source on 16 October 2026. 15 values in its datasets moved between snapshots, 6 of them figures stated on this page. Every revision we have observed →
Key estimates
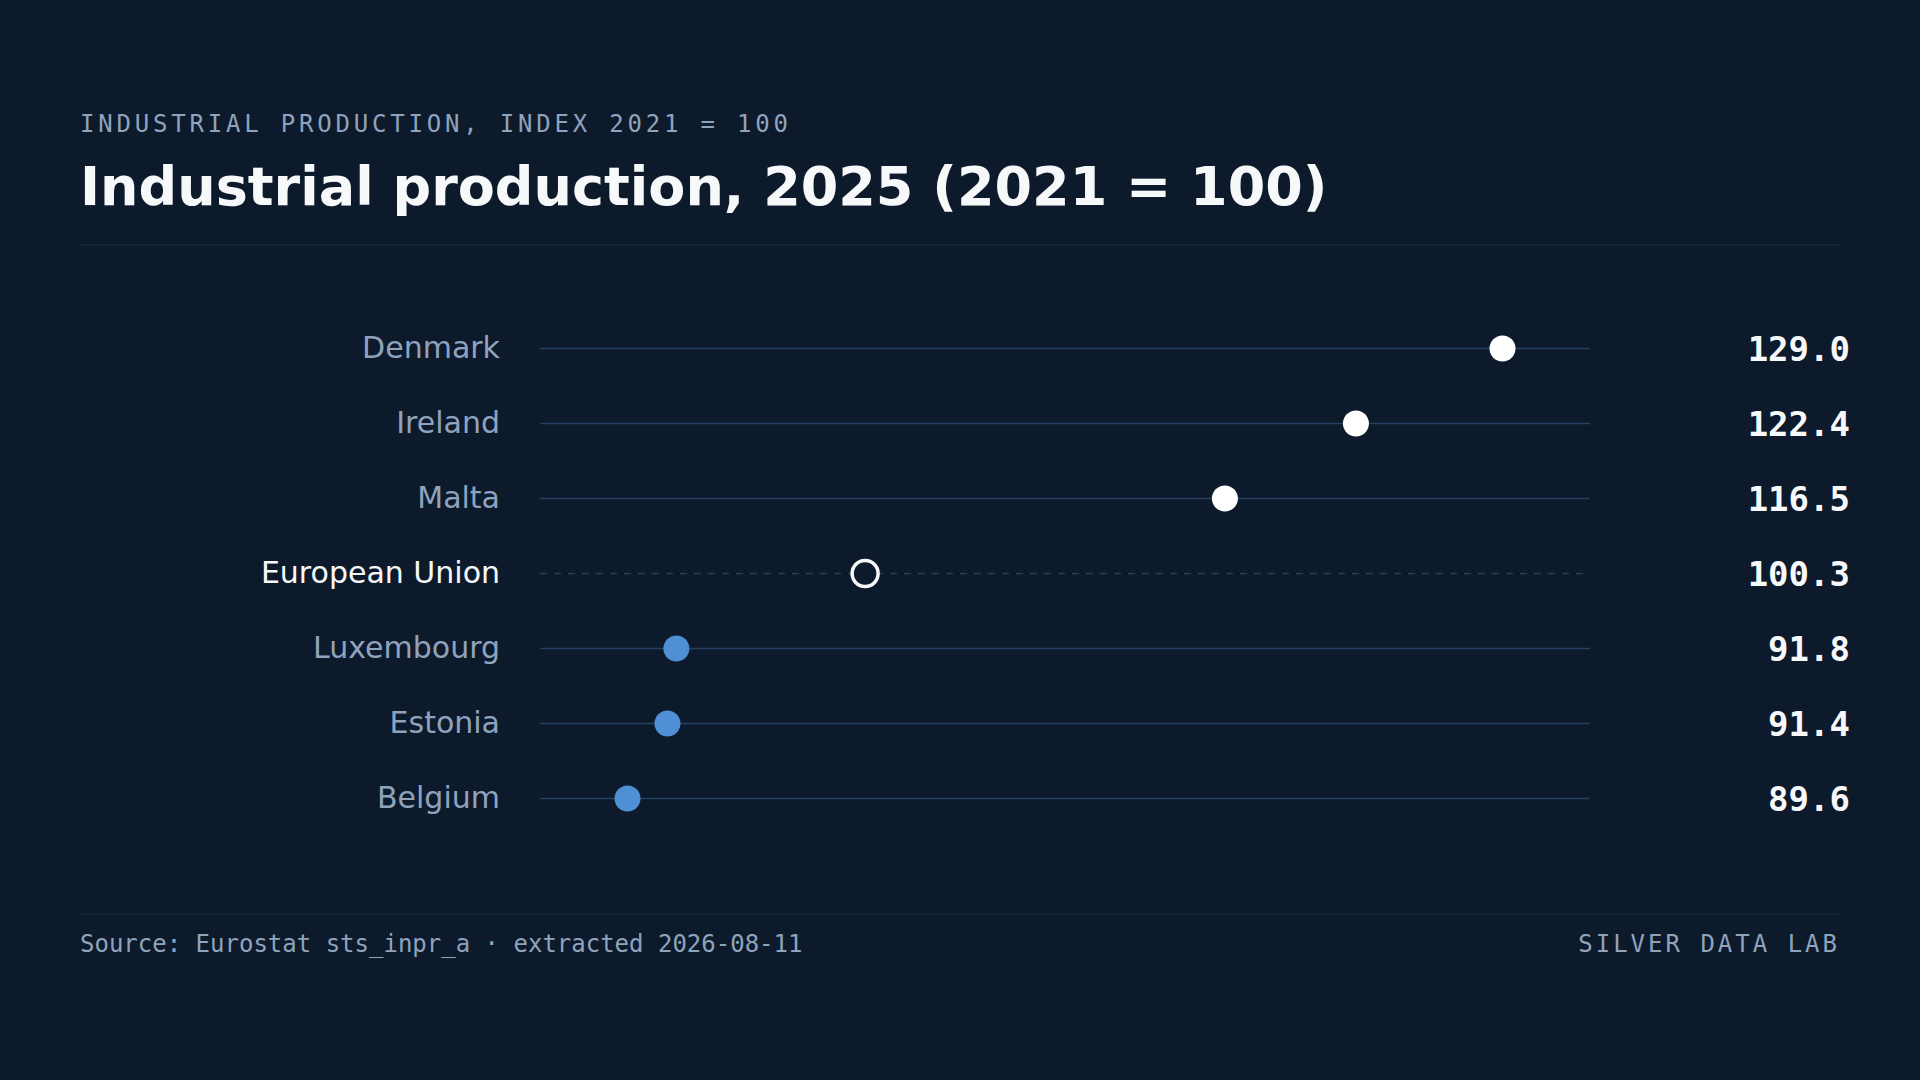
- EU industrial production in 2025 stood at 100.4 against a 2021 base of 100 — output is essentially unchanged after four years.
- Denmark records 128.9, Ireland 122.4 and Malta 116.4.
- Belgium records 90.4, Luxembourg 91.3 and Estonia 91.4.
- Germany, the Union's largest industrial economy, records 92.3.
- Fifteen Member States are above their 2021 level and twelve below it.
Four years, no growth
Industrial production covers mining, manufacturing, and electricity and gas supply. Measured against a 2021 base of 100, EU output in 2025 stood at 100.4.
Four years in which European industry produced, in aggregate, the same quantity it produced at the start.
Germany
Germany records 92.3. The Union's largest industrial economy is producing roughly 8% less than it did in 2021.
That single figure carries most of the EU aggregate. Germany's industrial sector is large enough that its contraction offsets growth across much of the rest of the Union, which is why the EU figure has barely moved while fifteen Member States are above their 2021 level.
German industry entered this period with an energy-intensive manufacturing base and a gas supply reorganised abruptly after 2022. It also sits at 19.4% of gross value added in manufacturing — high, but no longer the highest in the Union, as the manufacturing study on this site records.
The growth at the top
Denmark records 128.9, the highest in the Union, and Ireland 122.4.
Both figures should be read with the composition in mind. Danish industrial growth is concentrated in pharmaceuticals, and Irish output is dominated by pharmaceutical and medical manufacturing operated by foreign-owned firms — the same activity that distorts Irish GDP and Irish manufacturing share elsewhere on this site.
Neither index describes a broad industrial expansion. Both describe one sector growing very fast inside a small economy.
Poland at 112.8 is the case with the more ordinary explanation, a large industrial economy growing from an established base. Malta at 116.4 is a micro-economy where, as in Ireland and Denmark, a handful of plants can move the national index — which is what the limitation on small economies below sets out.
The contraction at the bottom
Belgium records 90.4, Luxembourg 91.3, Estonia 91.4 and Germany 92.3.
Belgium and Luxembourg are both energy-intensive relative to their size, with chemicals and steel respectively. Estonia's contraction follows the loss of Russian-facing trade and the reorganisation of its energy system.
What the index cannot tell you
An index of production measures quantity, not value or profitability. A country can produce the same volume at much lower margins, or shift towards higher-value output while producing less of it.
Nor does it show employment. Industrial output can be maintained with fewer workers, and the manufacturing employment picture is a separate question from the one this index answers.
What it does establish is that the aggregate figure of 100.4 is not a story of stability. It is fifteen Member States above their 2021 level and twelve below it, with Germany the fourth deepest of the twelve, averaging out through the aggregate's weights to no change — and that is not the same thing as stability in any one of them, for a Union whose industrial policy is written at European level.
Industrial production, 2025 (2021 = 100)
| Country | index, 2021 = 100 | Gap to EU averagederived |
|---|---|---|
| Denmark | 128.9 | +28.5 |
| Ireland | 122.4 | +22.0 |
| Malta | 116.4p | +16.0 |
| European Unionaggregate | 100.4 | — |
| Estonia | 91.4 | −9.0 |
| Luxembourg | 91.3 | −9.1 |
| Belgium | 90.4 | −10.0 |
Flags carried by the source on these values: p provisional
This table as data: CSV · JSON
Every Member State for this indicator+
Members see every Member State for this indicator here, not only the rows the ranking prints. Become a Member
Embed this chart
Paste this code into a page. The frame carries the source and the extraction date, and links back to the study.
What these figures cannot tell you
- The 2021 base is not neutral
- 2021 was a recovery year following the pandemic contraction, with output rebounding at different speeds across Member States. An index on that base measures change from an uneven starting point.
- Volume, not value
- The index measures quantity produced, adjusted for price. It says nothing about margins, profitability or whether output has shifted towards higher-value products.
- Small economies move on few firms
- In Ireland, Denmark, Malta and Luxembourg a small number of large plants can move the national index substantially. Irish and Danish growth is concentrated in pharmaceutical manufacturing rather than spread across industry.
- Industry excludes construction
- NACE sections B to D cover mining, manufacturing, and electricity and gas. Construction is measured separately and is not included here.
- Five of the 2025 values are not final
- Eurostat publishes the 2025 index as provisional for Greece, Spain, Malta, the Netherlands and Romania. Four of the five sit above the 2021 base and one below it, and the Netherlands at 101.1 is close enough to the base that a revision could change the count of Member States above and below their 2021 level. Malta's 116.4, third in the ranking, is one of them.
Frequently asked questions
- Is EU industry growing?
- Barely. Industrial production in 2025 stood at 100.4 against a 2021 base of 100 — output is essentially unchanged after four years. Fifteen Member States are above their 2021 level and twelve below it.
- How is German industry performing?
- German industrial production in 2025 was at 92.3 against a 2021 base of 100, roughly 8% below its 2021 level. Because German industry is the Union's largest, that contraction offsets growth across much of the rest of the EU and holds the aggregate at no change.
- Which EU country has grown most?
- Denmark, at 128.9 on the 2021 base, followed by Ireland at 122.4. Both figures are concentrated in pharmaceutical manufacturing rather than spread across industry, and the Irish index reflects output by foreign-owned firms.
- Does this include construction?
- No. The index covers mining, manufacturing, and electricity and gas supply. Construction is a separate statistical series.
Methodological note
Eurostat publishes production in industry as a calendar-adjusted volume index. This study uses NACE sections B to D on the 2021 = 100 base as published.
Values are for 2025 and cover all 27 Member States.
The counts of Member States above and below their 2021 level, and the identification of the deepest contractions among them, are derived by Silver Data Lab from the published index values. The dataset carries indices and no country weights, so how much of the aggregate any one Member State accounts for is not derived here. The comparisons with manufacturing share of value added draw on the companion study in the industry category.
Source data
The underlying series can be inspected and re-downloaded from the Eurostat data browser. The filters below are the ones applied.
Production in industry - annual data
sts_inpr_a
- Filters applied:
- freq=A · indic_bt=PRD · nace_r2=B-D · s_adj=CA · unit=I21 · time=2025
- Extracted:
- 2026-10-16
- Source last updated:
- 2026-10-15
Download the data
The data the study you have just read is built on, exactly as it was downloaded and archived.
Yours as a Member.
Data downloadable by Members
How to cite
Record the vintage as well as the study: the figures on this page are the ones extracted on the dates below.
Silver Data Lab Research Desk (2026). EU Industrial Output Is Where It Was Four Years Ago. Silver Data Lab, published 11 August 2026, last updated 16 October 2026. https://www.silverdatalab.com/studies/industrial-production-in-the-eu
- Data: Eurostat, Production in industry - annual data (sts_inpr_a), filters freq=A, indic_bt=PRD, nace_r2=B-D, s_adj=CA, unit=I21, time=2025; extracted 2026-10-16; source last updated 2026-10-15. https://doi.org/10.2908/sts_inpr_a
Silver Data Lab's analysis is licensed CC BY 4.0. The statistics remain their publisher's and keep its terms of reuse.
Ask the research desk
A question about this study — a definition, a filter, a break in the series, what the figures can and cannot support — answered by the desk that made the extraction.
Members can write to the research desk
Studies where the same country leads or trails
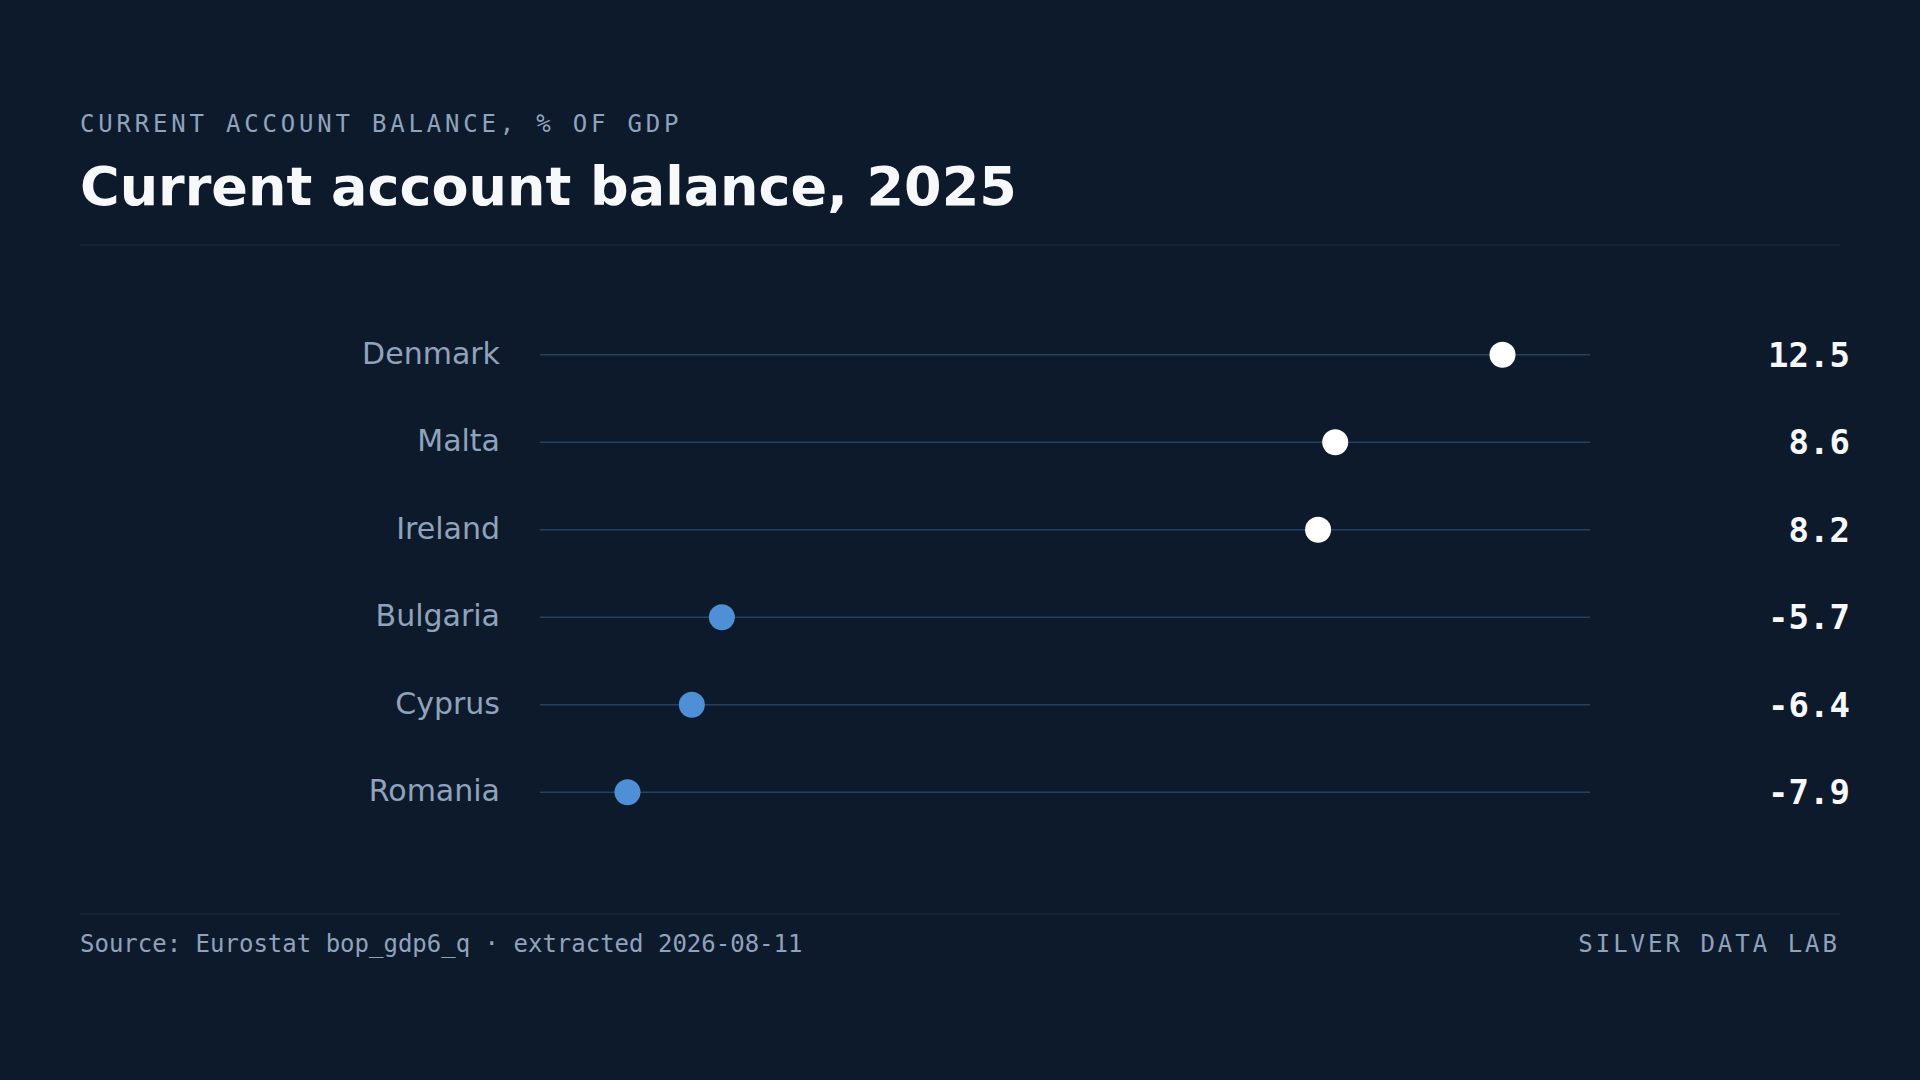
Denmark Has the EU's Biggest Surplus With the World, at 12.3% of GDP
Denmark ran a current account surplus worth 12.3% of GDP in 2025, the largest in the Union.
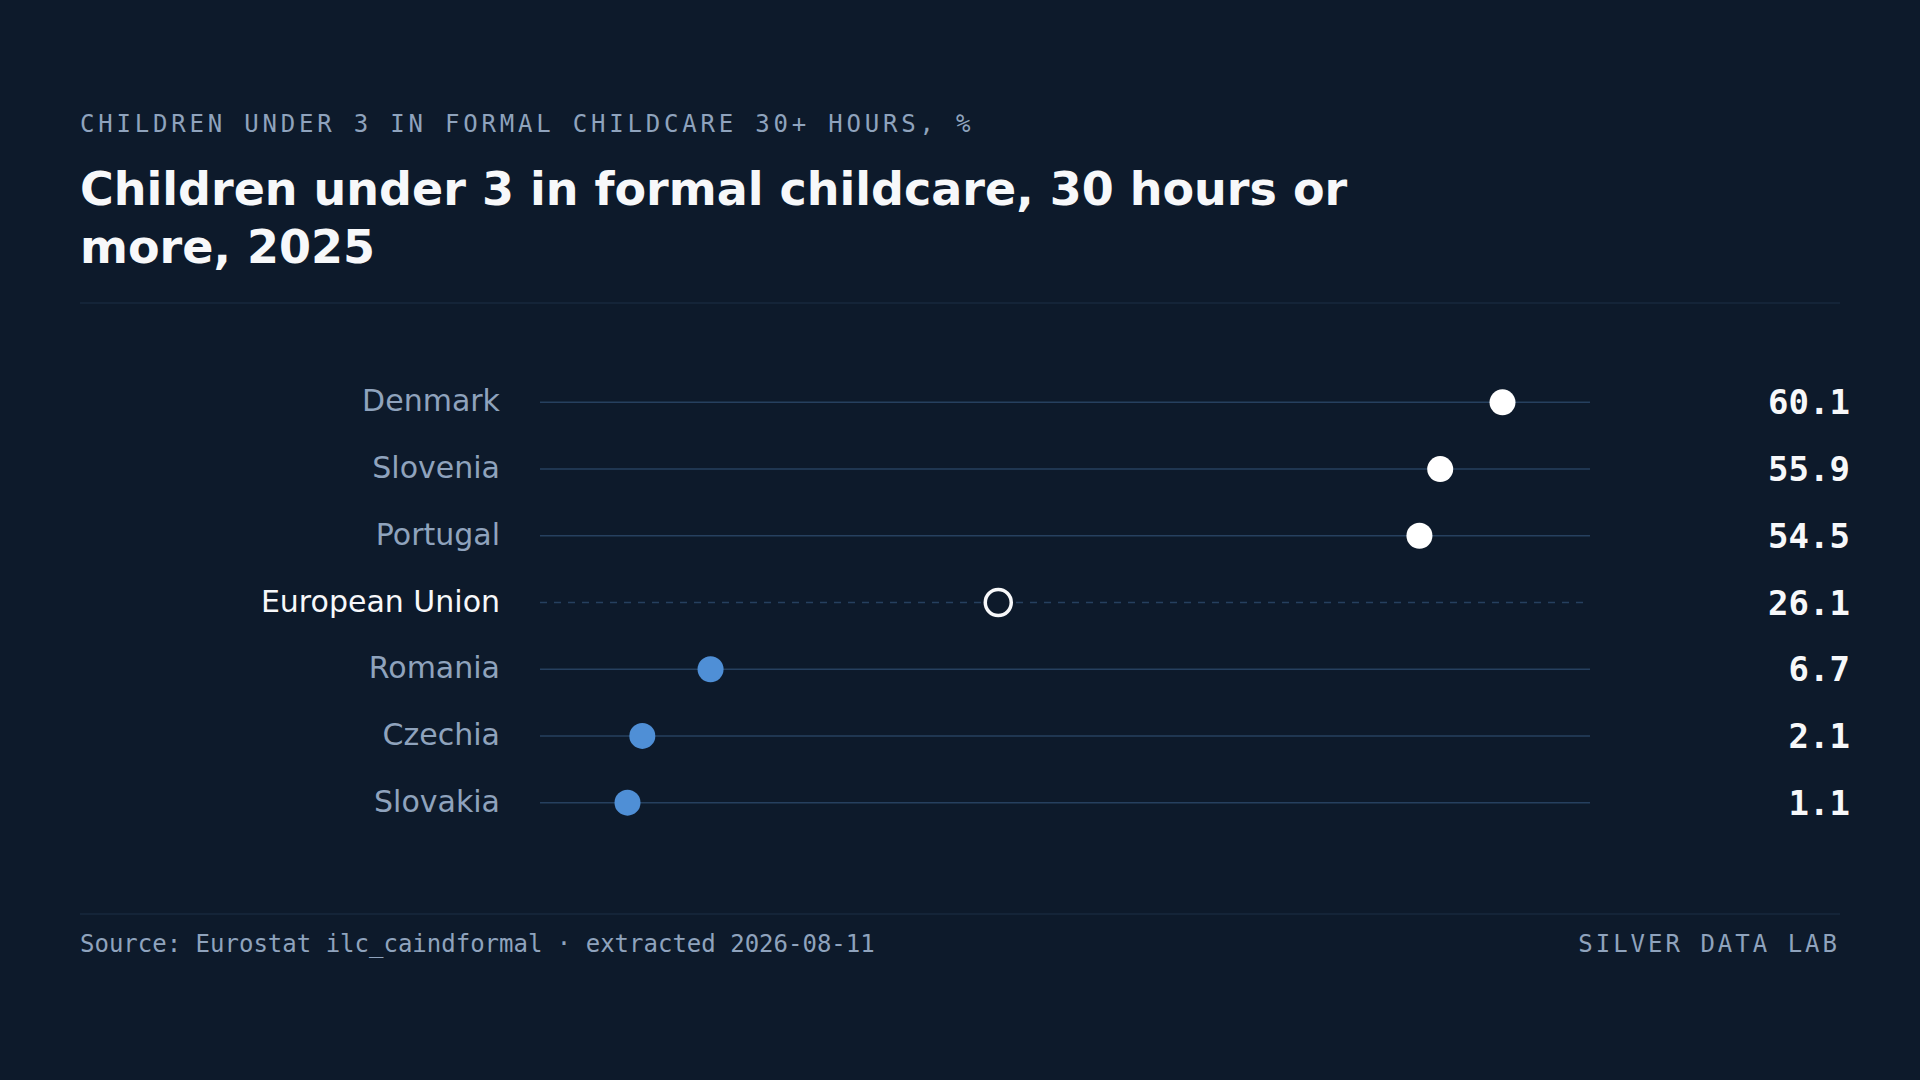
Most Danish Children Under Three Are in Full-Time Childcare
26.1% of EU children under three attended formal childcare for 30 hours a week or more in 2025.
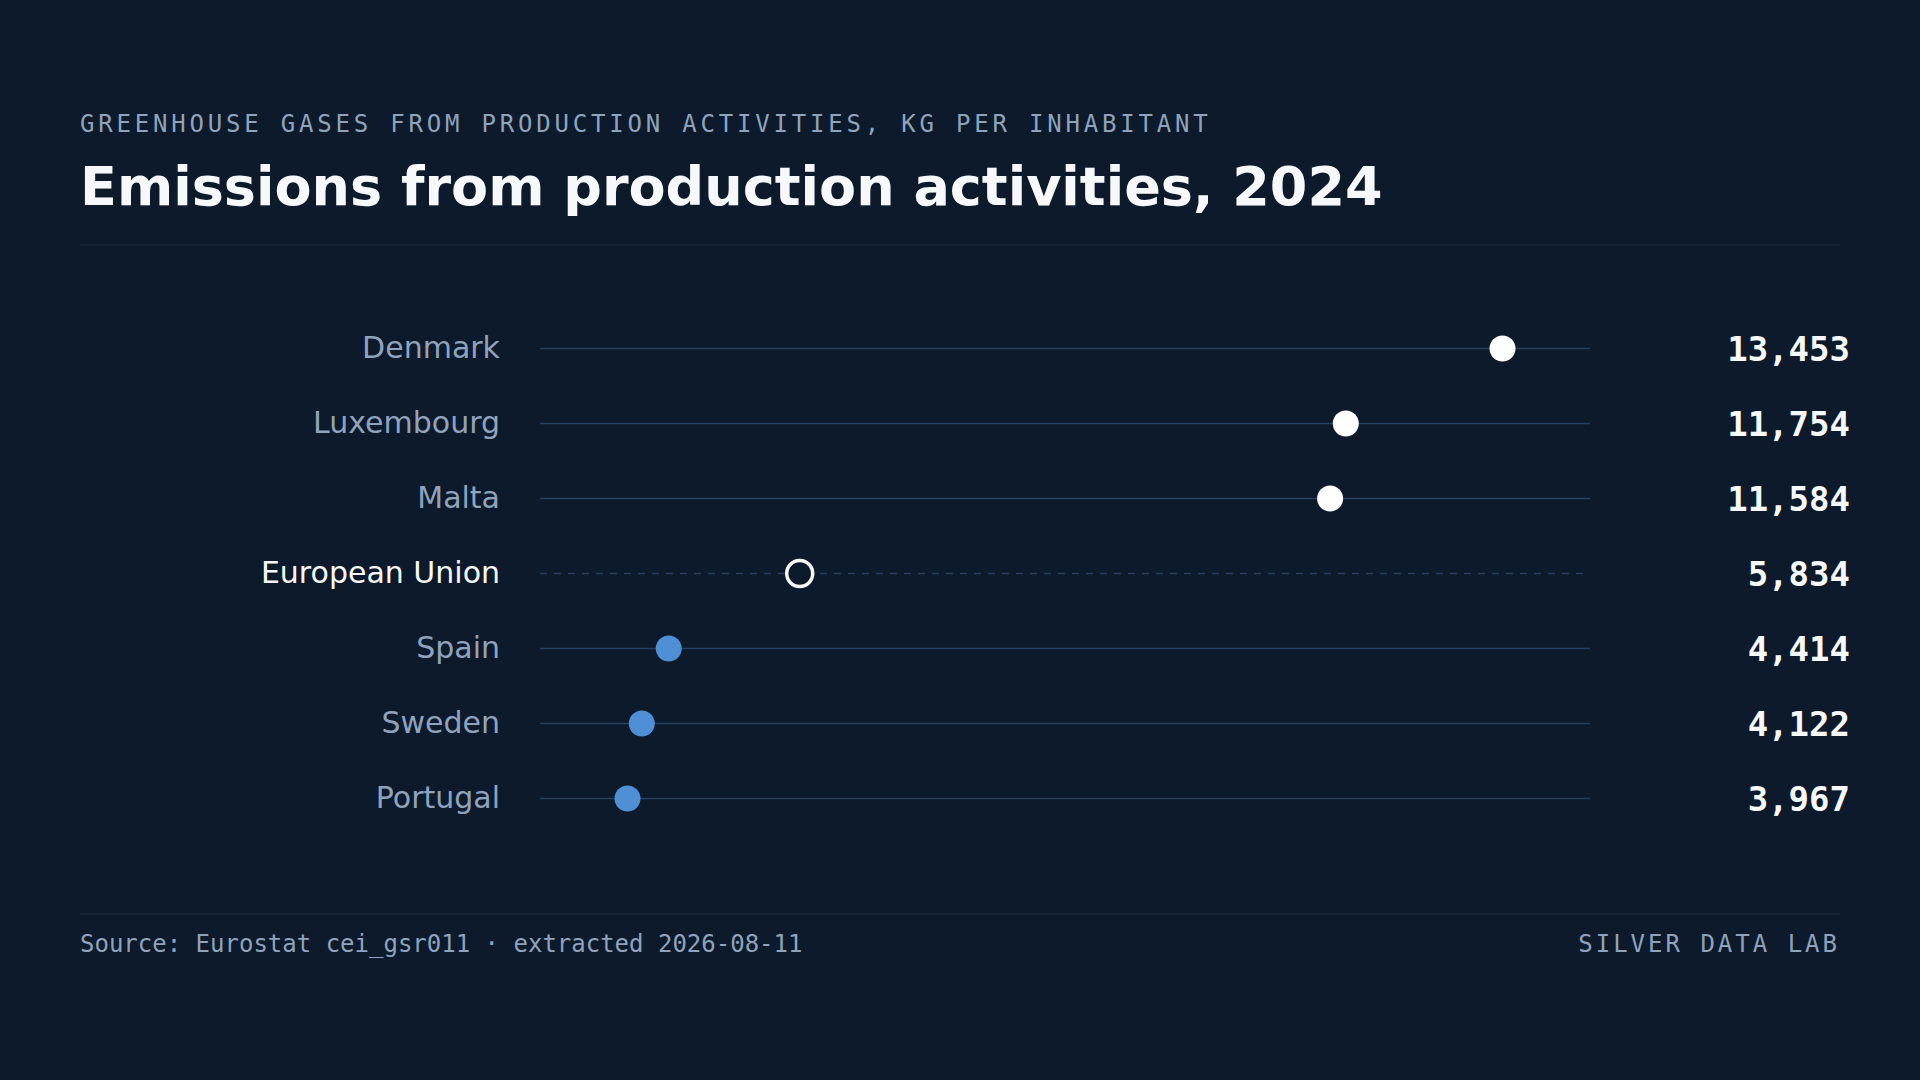
One EU Method Counts More Than Twice the Danish Emissions Another Does
On the air emissions accounts basis the EU emitted 5,834 kg of CO2 equivalent per inhabitant from production activities in 2024.