People in Madrid Live Nearly Twelve Years Longer Than in Northwest Bulgaria
Silver Data Lab Research Desk · Statistical analysis · Published on 04 June 2026
- Data source
- Eurostat
- Reference period
- 2024
- Last updated
- 14 October 2026
Re-checked against the source on 11 August 2026. No value in its datasets has moved between the snapshots we hold. Every revision we have observed →
Key estimates
- Life expectancy at birth across 244 EU regions runs from 85.7 years to 73.9 years.
- Comunidad de Madrid records 85.7 years, the highest in the Union.
- Severozapaden in Bulgaria records 73.9 years, the lowest.
- The gap of 11.8 years is wider than the gap between any two EU Member States.
- France contains a 10.1-year internal gap, between Île de France at 84.6 and Mayotte at 74.5.
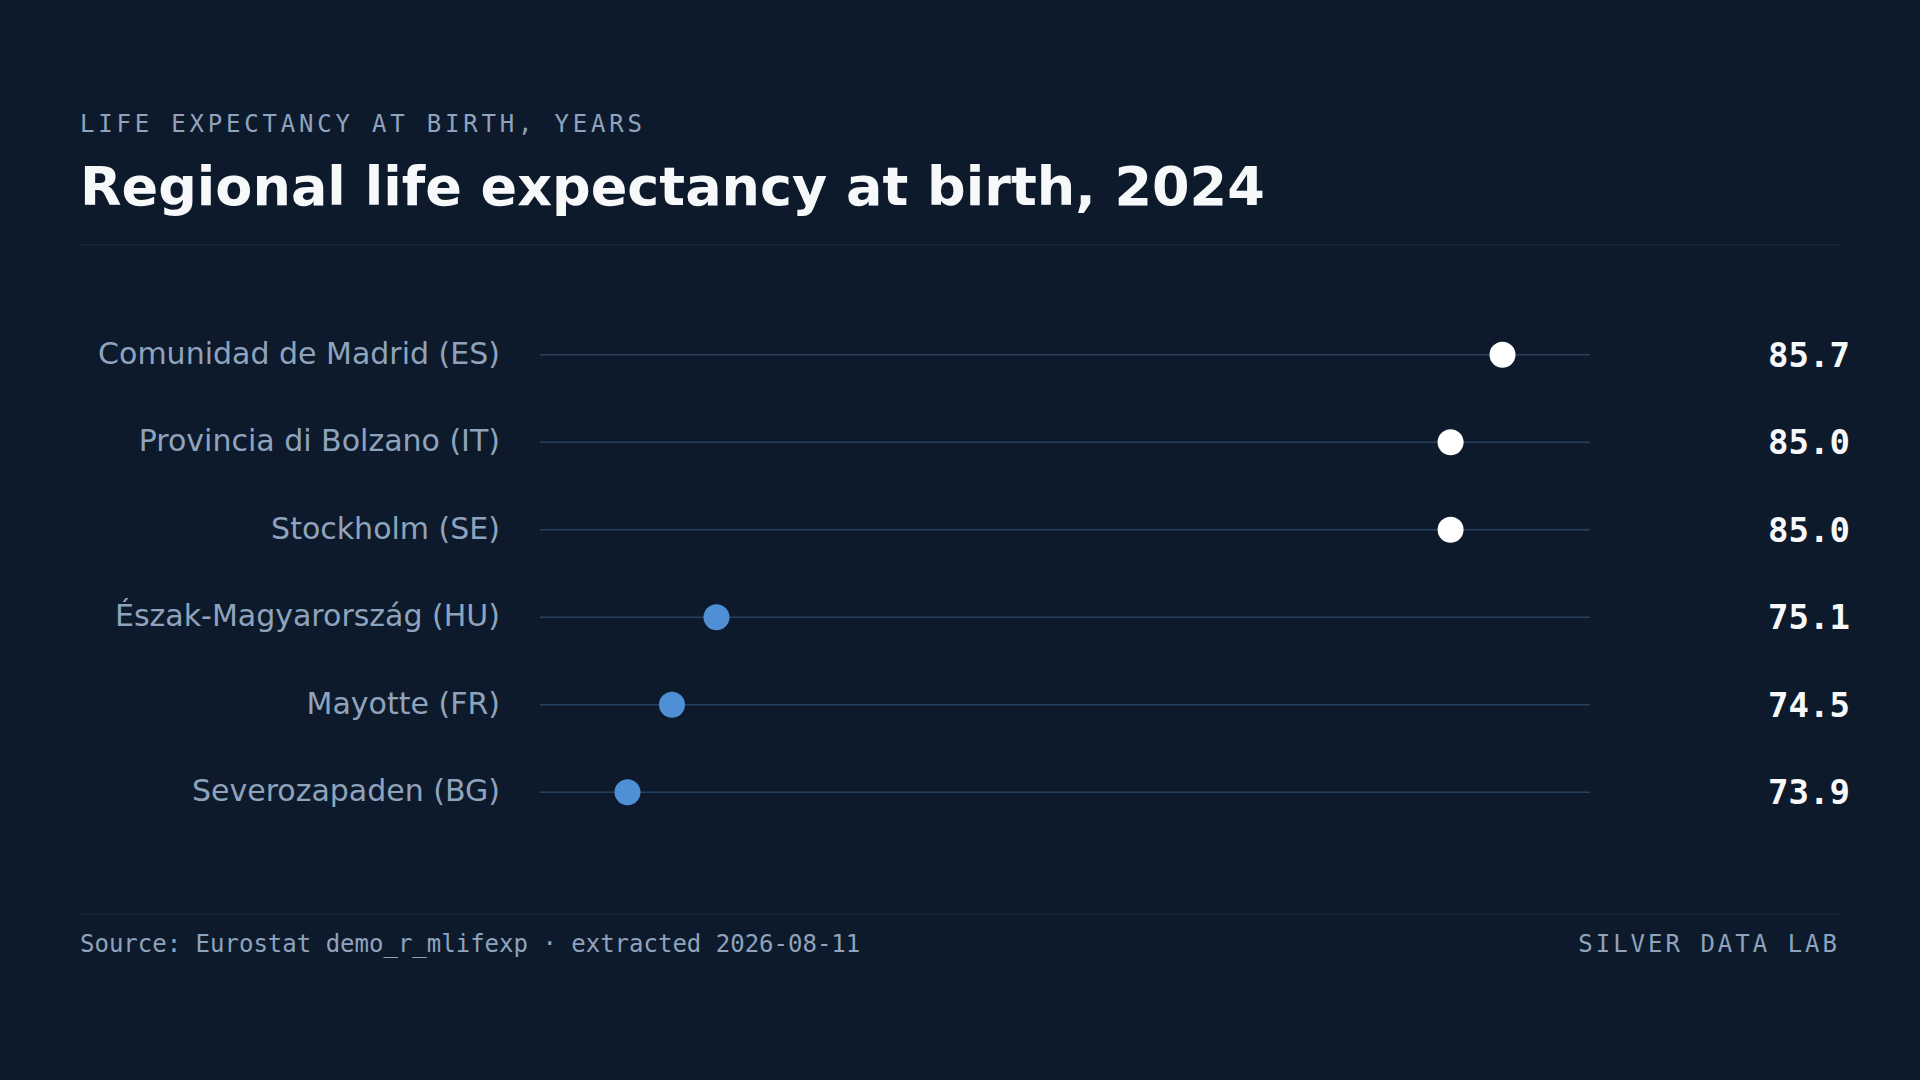
Eleven years and ten months
A child born in the Comunidad de Madrid in 2024 could expect to live 85.7 years. A child born in Severozapaden, in north-western Bulgaria, could expect 73.9.
The difference is 11.8 years, and both children are born citizens of the European Union.
That gap is wider than the one between any two Member States measured nationally, because national figures average high and low regions together and regional figures do not.
The top
Madrid at 85.7 leads, followed by the two autonomous provinces of northern Italy — Bolzano and Trento, both at 85.0 — and Stockholm at 85.0.
Spanish and Italian regions dominate the upper part of the ranking. Both countries record high national life expectancy, and both have several regions above 84 years.
Madrid leads its own country, as Stockholm leads Sweden and Île de France leads France, but a capital region is not generally the longest-lived one: of the twenty Member States with at least three NUTS 2 regions the capital leads in eleven and is behind in eight, and in Ireland it is level with another of the three, and Wien is the last of Austria's nine at 81.2 years against Tirol's 83.3. Unlike regional GDP, however, life expectancy is not distorted by commuting — it is measured on the resident population and the people who live in a region are the people counted.
That makes this ranking a more direct statement about a place than the GDP one.
The bottom
Severozapaden records 73.9 years, Mayotte 74.5 and Severen tsentralen, also in northern Bulgaria, 74.9. Észak-Magyarország in northern Hungary is fourth at 75.1.
The lowest positions are held by regions in Bulgaria, Hungary, Romania and Latvia, together with the French overseas department of Mayotte.
These are regions with low incomes, older populations remaining after outward migration, and health systems under strain. Northwest Bulgaria has been losing population for three decades, and what remains is disproportionately elderly.
The French gap
France contains the widest internal spread in the Union, on figures Eurostat publishes as provisional: Île de France at 84.6 years and Mayotte at 74.5, a difference of 10.1 years computed here.
Portugal is second at 4.0 years, between Norte and the Azores, and Belgium third at 3.9, between Vlaams-Brabant and Hainaut.
The French figure is a special case driven by an overseas department, and stating it without that context would misrepresent it. Belgium's 3.9 years is in some ways the more striking number: two adjacent provinces of a small, wealthy country, four years apart in life expectancy.
Why no EU average appears here
Eurostat publishes no EU aggregate in this regional dataset. Averaging 244 regions would give each the same weight regardless of population, producing a figure calculated here rather than taken from the source.
This study therefore quotes no EU figure and shows no reference row. The national life expectancy study on this site uses a series that does publish one.
Regional life expectancy at birth, 2024
| Country | years |
|---|---|
| Comunidad de Madrid (ES) | 85.7 |
| Provincia di Bolzano (IT) | 85.0 |
| Stockholm (SE) | 85.0 |
| Severen tsentralen (BG) | 74.9 |
| Mayotte (FR) | 74.5p |
| Severozapaden (BG) | 73.9 |
Flags carried by the source on these values: p provisional
This table as data: CSV · JSON
Every Member State for this indicator+
Members see every Member State for this indicator here, not only the rows the ranking prints. Become a Member
Embed this chart
Paste this code into a page. The frame carries the source and the extraction date, and links back to the study.
What these figures cannot tell you
- No EU aggregate is published
- Eurostat provides no EU value in this regional dataset. Averaging the regions would weight a region of 50,000 people equally with one of 6 million and would be our figure, not the source's, so none is shown.
- A synthetic measure of current conditions
- Life expectancy at birth is computed from current age-specific mortality rates. It describes conditions in 2024 rather than predicting how long anyone born that year will actually live.
- Small regions are volatile
- In regions with small populations, a single year's mortality can move the figure noticeably. The extremes of this ranking are more stable than the middle, but small-region estimates carry real year-to-year variation.
- Mayotte is a distinct case
- Mayotte's demographic statistics differ in coverage and method from the rest of France and the rest of the Union. It appears in the ranking as published and drives the French internal gap reported here. Eurostat publishes every French value for 2024 as provisional, Île de France and Mayotte included, so the gap between them rests on two figures it may yet revise.
Frequently asked questions
- Which EU region has the highest life expectancy?
- Comunidad de Madrid, at 85.7 years at birth in 2024. The autonomous provinces of Bolzano and Trento in northern Italy and Stockholm in Sweden follow at 85.0.
- Which EU region has the lowest?
- Severozapaden in north-western Bulgaria, at 73.9 years, followed by Mayotte at 74.5 and Severen tsentralen, also in northern Bulgaria, at 74.9. Észak-Magyarország in northern Hungary is fourth at 75.1.
- How large is the regional life expectancy gap in the EU?
- 11.8 years between the highest and lowest region — wider than the gap between any two Member States measured nationally, because national figures average high and low regions together.
- Why is there no EU average on this chart?
- Because Eurostat publishes none for this regional dataset. Averaging 244 regions would give a small region the same weight as a large one and would produce a figure calculated here rather than taken from the source.
Methodological note
Eurostat publishes life expectancy at birth by NUTS 2 region, computed from regional life tables. This study uses the figure for both sexes combined.
Values are for 2024, covering 244 EU NUTS 2 regions. Regions of candidate and EFTA countries present in the dataset are excluded.
Eurostat publishes no EU aggregate for this regional series, so no reference row is shown and no EU figure is quoted anywhere in this study.
The gap between the highest and lowest region, and the within-country gaps, are computed by Silver Data Lab and labelled as derived. Within-country gaps are calculated only for Member States with at least three NUTS 2 regions.
Source data
The underlying series can be inspected and re-downloaded from the Eurostat data browser. The filters below are the ones applied.
Life expectancy at birth by NUTS 2 region
demo_r_mlifexp
- Filters applied:
- freq=A · sex=T · age=Y_LT1 · unit=YR · time=2024
- Extracted:
- 2026-08-11
- Source last updated:
- 2026-06-01
Download the data
The data the study you have just read is built on, exactly as it was downloaded and archived.
Yours as a Member.
Data downloadable by Members
How to cite
Record the vintage as well as the study: the figures on this page are the ones extracted on the dates below.
Silver Data Lab Research Desk (2026). People in Madrid Live Nearly Twelve Years Longer Than in Northwest Bulgaria. Silver Data Lab, published 04 June 2026, last updated 14 October 2026. https://www.silverdatalab.com/studies/regional-life-expectancy-in-the-eu
- Data: Eurostat, Life expectancy at birth by NUTS 2 region (demo_r_mlifexp), filters freq=A, sex=T, age=Y_LT1, unit=YR, time=2024; extracted 2026-08-11; source last updated 2026-06-01. https://doi.org/10.2908/demo_r_mlifexp
Silver Data Lab's analysis is licensed CC BY 4.0. The statistics remain their publisher's and keep its terms of reuse.
Ask the research desk
A question about this study — a definition, a filter, a break in the series, what the figures can and cannot support — answered by the desk that made the extraction.
Members can write to the research desk