Malta Imports 98% of Its Energy, the Most in the EU
Silver Data Lab Research Desk · Statistical analysis · Published on 19 July 2026
This study is open to members only
Its sources, filters and extraction date are declared above, as they are for every study. Sign in to read the analysis in full.
- Data source
- Eurostat
- Reference period
- 2024
- Last updated
- 11 October 2026
Re-checked against the source on 11 August 2026. No value in its datasets has moved between the snapshots we hold. Every revision we have observed →
Key estimates
- The EU imported 57.3% of the energy it consumed in 2024 — more than half.
- Malta imports 98.4%, effectively everything it uses, ahead of Luxembourg at 91.0% and Cyprus at 87.7%.
- Estonia imports 4.6%, the lowest in the Union by a wide margin: the next lowest, Sweden, is at 26.5%.
- Thirteen Member States import more than the EU average, and all three of the Union's island states are among the five most dependent.
- The 93.8 point range between Malta and Estonia covers almost the whole distance between total import and self-sufficiency.
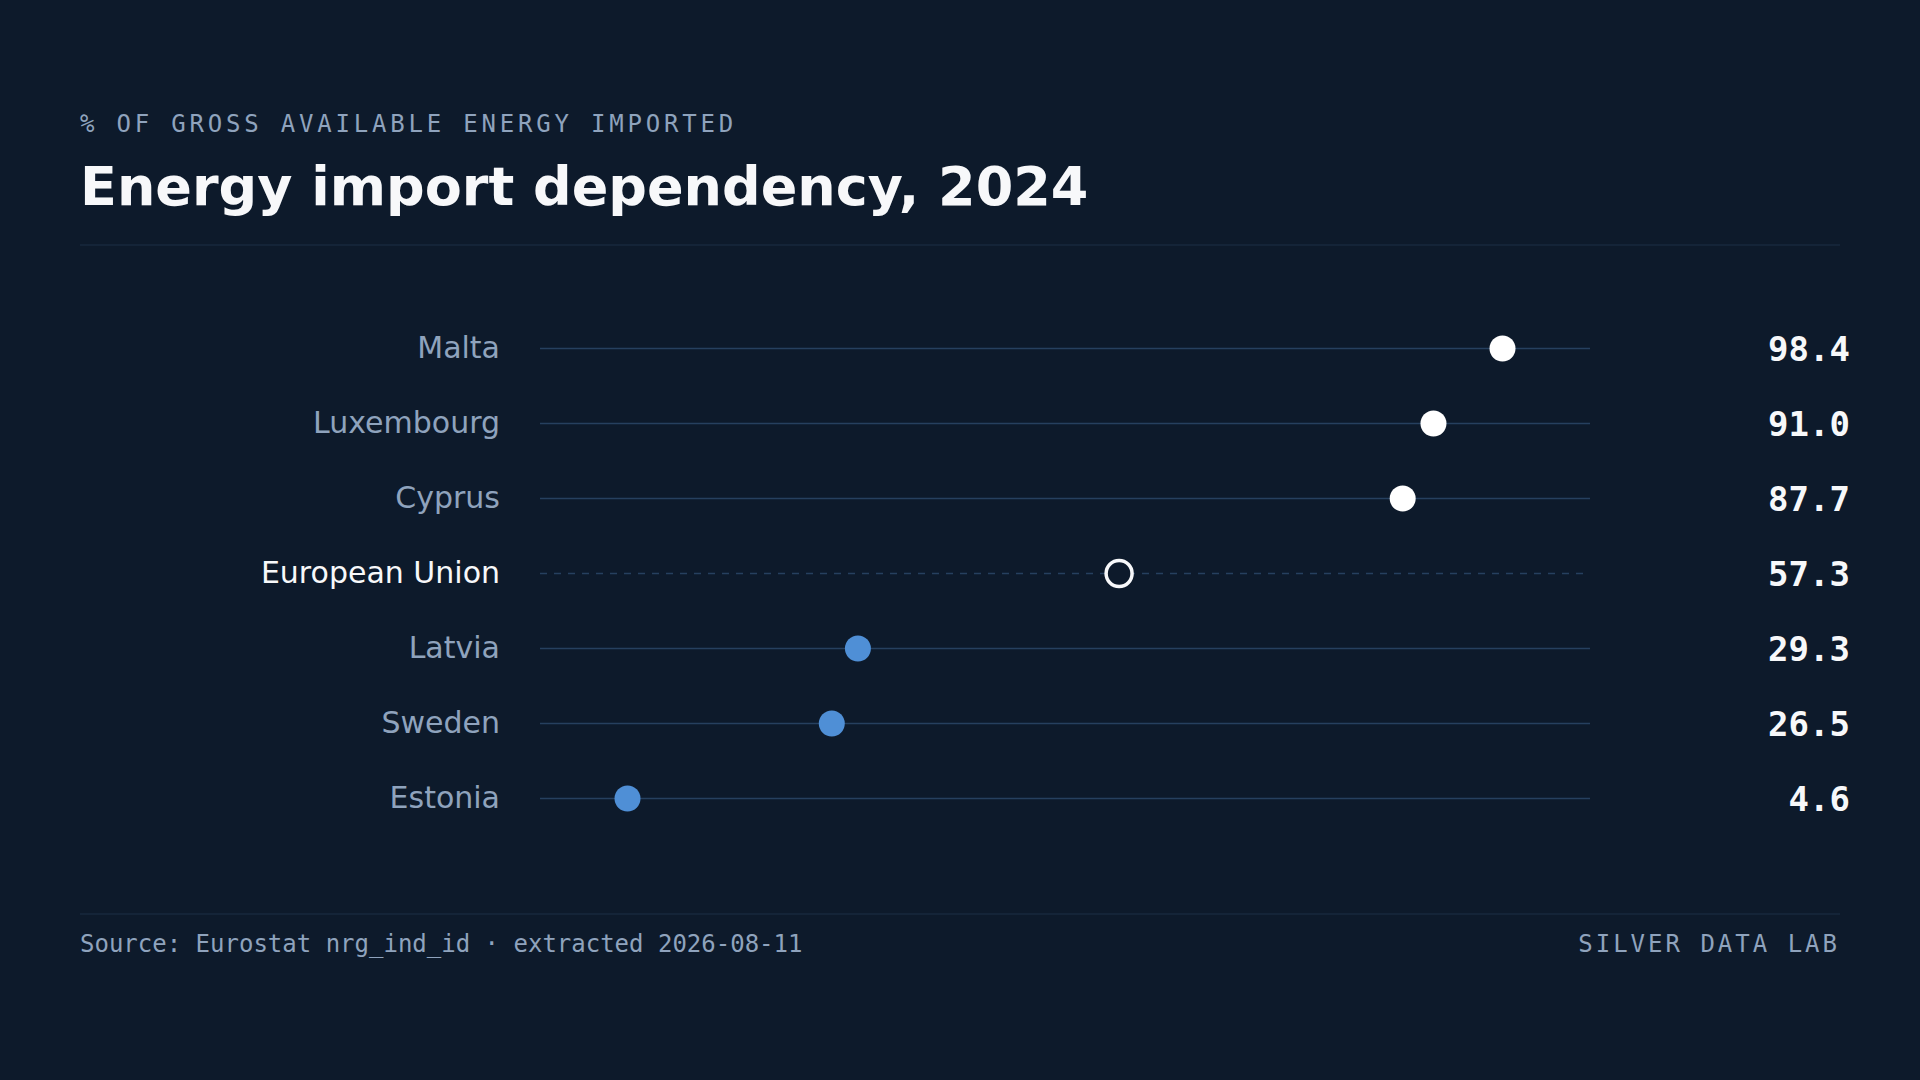
An indicator that runs almost from end to end
Energy import dependency measures how much of the energy a country uses has to be bought from outside it. Zero marks a country that produces everything it consumes and a hundred a country that produces nothing, but neither is a floor or a ceiling: a country adding to its stocks can record less than zero, and one drawing them down can record more than a hundred. Both have happened in this series.
The European Union sits at 57.3% for 2024. What makes this indicator unusual is that in that year its Member States spread across almost the whole distance between those two marks: from 98.4% down to 4.6%.
The near-total importers
Malta records 98.4%. It has no fossil fuel resources, very little land, and an electricity system connected to the continent by a single interconnector. For practical purposes it imports its energy.
Luxembourg follows at 91.0% and Cyprus at 87.7%. Ireland records 79.5%, Greece 77.7% and Belgium 75.4%.
The pattern at this end is smallness and islandness. Malta and Cyprus are islands, Ireland is an island, and Luxembourg is a landlocked economy with no significant domestic production and very high energy use per head.
Estonia, and why it is an outlier
Estonia records 4.6%, meaning it produces the overwhelming majority of the energy it consumes.
The gap between Estonia and the next least dependent Member State is 21.9 percentage points — Sweden records 26.5%, Latvia 29.3% and Romania 30.4%. No other position in this ranking has anything like that distance around it.
Estonia's position rests on domestic oil shale, a fuel almost unique to it within the Union. That is worth stating plainly alongside the number, because energy independence achieved through a carbon-intensive domestic fuel is a different achievement from energy independence achieved through renewables, and this indicator does not distinguish them. A country can score well here and badly on emissions, and Estonia does: on greenhouse gas emissions per head it is level with Cyprus, behind Ireland and Luxembourg and ahead of every other Member State.
Where the large consumers sit
Germany records 66.8%, Italy 73.9%, Spain 68.9% and the Netherlands 70.6% — all above the EU average. France records 41.7%, well below it, and Poland 45.7%.
Since these are among the Union's largest energy consumers, the aggregate figure of 57.3% understates rather than overstates the exposure of the economies that use the most energy. The Union's average is pulled down by smaller Member States with domestic production, not up by them.
Energy import dependency, 2024
| Country | % of gross available energy | Gap to EU averagepercentage points, derived |
|---|---|---|
| Malta | 98.4 | +41.1 |
| Luxembourg | 91.0 | +33.7 |
| Cyprus | 87.7 | +30.4 |
| European Unionaggregate | 57.3 | — |
| Latvia | 29.3 | −28.0 |
| Sweden | 26.5 | −30.8 |
| Estonia | 4.6 | −52.7 |
This table as data: CSV · JSON
Every Member State for this indicator+
Members see every Member State for this indicator here, not only the rows the ranking prints. Become a Member
What these figures cannot tell you
- Independence is not the same as sustainability
- The indicator measures where energy comes from, not what it is. A country producing its own coal, oil shale or gas scores as independent, and a country importing renewable electricity scores as dependent. Estonia is the clearest case: the lowest dependency in the Union alongside one of its highest emission rates per head.
- Imports from other Member States count as imports
- The measure is national, so energy bought from a neighbouring EU country counts the same as energy bought from outside the Union. For questions about the Union's external exposure rather than a country's own, the EU aggregate is the relevant figure and the national ones are not additive.
- A single year, and an unusual period
- European energy trade has been reorganised substantially since 2022, and volumes and routes have shifted between years. A 2024 reading describes that year and should not be read as a structural constant.
- Negative and near-zero values depend on stock changes
- The measure accounts for changes in stocks as well as production and trade, so countries close to self-sufficiency can show values that move noticeably between years without a change in their underlying energy system.
Frequently asked questions
- How much energy does the EU import?
- 57.3% of the energy it used in 2024, measured as net imports over gross available energy. National rates ranged from 98.4% in Malta to 4.6% in Estonia.
- Which EU country is most dependent on energy imports?
- Malta, at 98.4% in 2024, followed by Luxembourg at 91.0% and Cyprus at 87.7%. All three lack domestic energy resources, and two of them are islands.
- Which EU country is most energy independent?
- Estonia, at 4.6% import dependency in 2024, an outlier by a wide margin: the next lowest, Sweden, records 26.5%. Estonia's position rests on domestic oil shale, which is why it also has one of the Union's highest emission rates per head.
- Does low import dependency mean a country is greener?
- No. The indicator measures where energy comes from, not what it is made of. Domestic coal or oil shale counts as independence, and imported renewable electricity counts as dependence, so the ranking should be read alongside emissions rather than instead of them.
Methodological note
Energy import dependency is published by Eurostat as net imports as a share of gross available energy, for all energy products combined. A value of 100% would mean a country imports all the energy it uses; a value of 0% would mean it produces all of it.
Values are for 2024, the most recent year with complete coverage of the 27 Member States at the extraction date.
The 93.8 point range between the highest and lowest Member State, the 21.9 point distance between Estonia and the next lowest, and the count of Member States above the EU figure are derived by Silver Data Lab from the published values. The comparison with Estonia's emissions per capita comes from the greenhouse gas study published alongside this one. The archived extraction carries the whole series from 1990, which is where the values below zero and above a hundred described above can be checked.
Source data
The underlying series can be inspected and re-downloaded from the Eurostat data browser. The filters below are the ones applied.
Energy imports dependency
nrg_ind_id
- Filters applied:
- freq=A · siec=TOTAL · unit=PC · time=2024
- Extracted:
- 2026-08-11
- Source last updated:
- 2026-07-16
Download the data
The data the study you have just read is built on, exactly as it was downloaded and archived.
Yours as a Member.
Data downloadable by Members
How to cite
Record the vintage as well as the study: the figures on this page are the ones extracted on the dates below.
Silver Data Lab Research Desk (2026). Malta Imports 98% of Its Energy, the Most in the EU. Silver Data Lab, published 19 July 2026, last updated 11 October 2026. https://www.silverdatalab.com/studies/energy-import-dependency-in-the-eu
- Data: Eurostat, Energy imports dependency (nrg_ind_id), filters freq=A, siec=TOTAL, unit=PC, time=2024; extracted 2026-08-11; source last updated 2026-07-16. https://doi.org/10.2908/nrg_ind_id
Silver Data Lab's analysis is licensed CC BY 4.0. The statistics remain their publisher's and keep its terms of reuse.
Ask the research desk
A question about this study — a definition, a filter, a break in the series, what the figures can and cannot support — answered by the desk that made the extraction.
Members can write to the research desk
Studies where the same country leads or trails
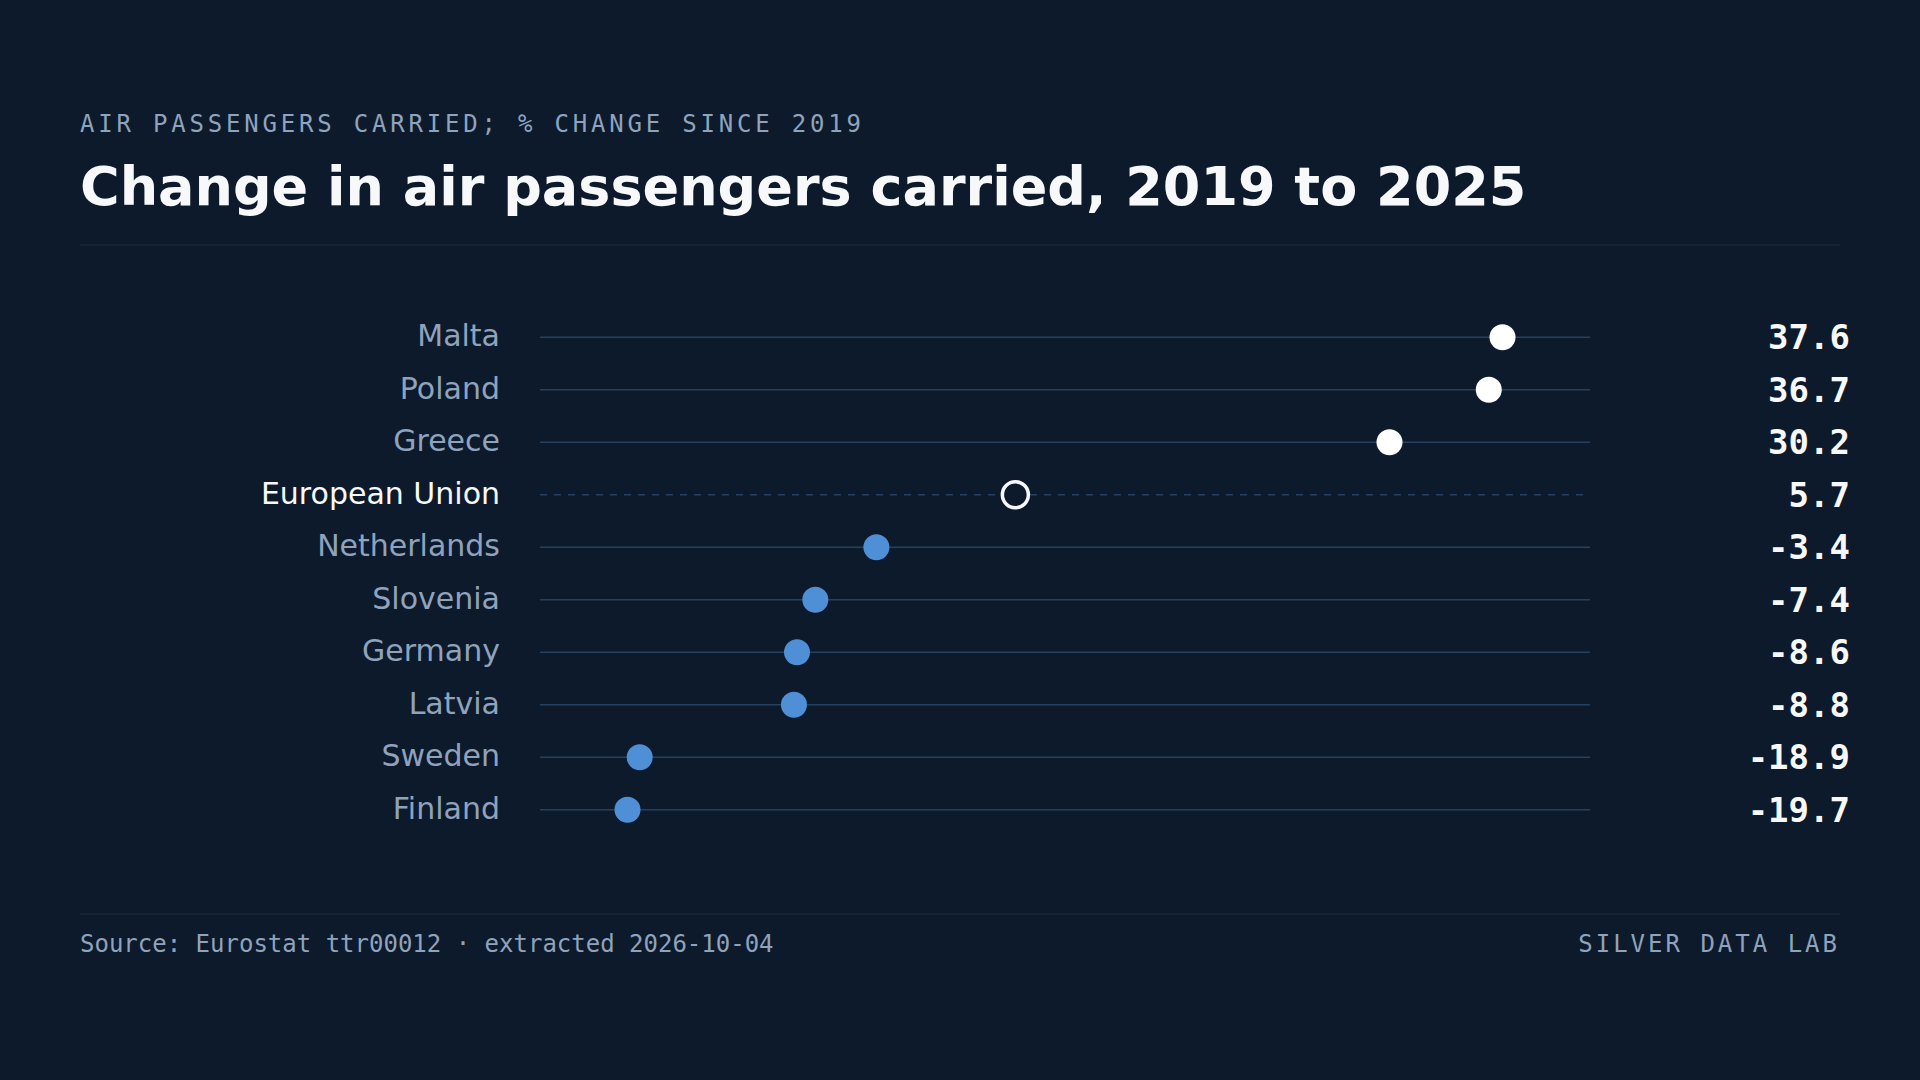
Air Travel in the EU Is Back Above Its Pre-Pandemic Level
Air passengers carried in the EU reached 1,093.6 million in 2025, 5.7% more than in 2019; the total first passed its 2019 level in 2024, by 0.7%.
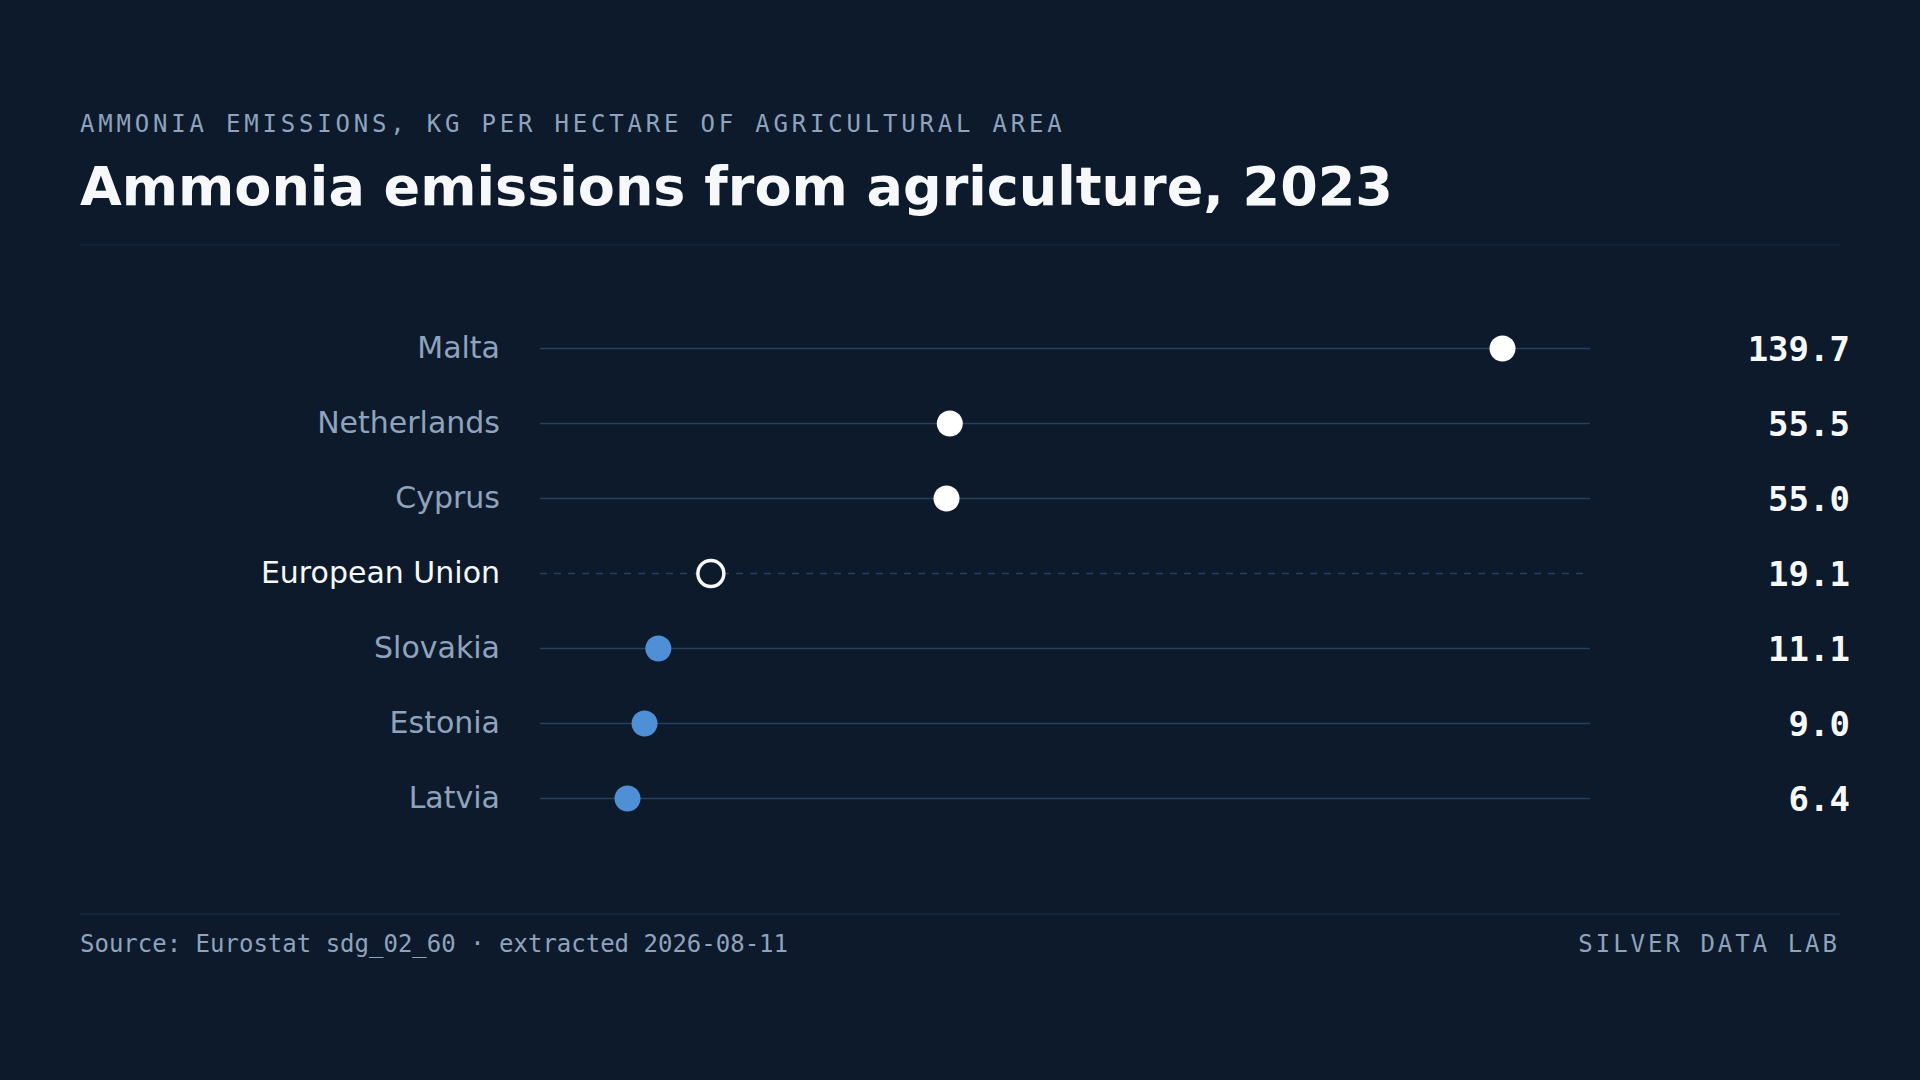
Dutch Farms Emit Nearly Three Times the EU Average of Ammonia per Hectare
EU agriculture emitted 19.2 kg of ammonia per hectare of agricultural area in 2023.
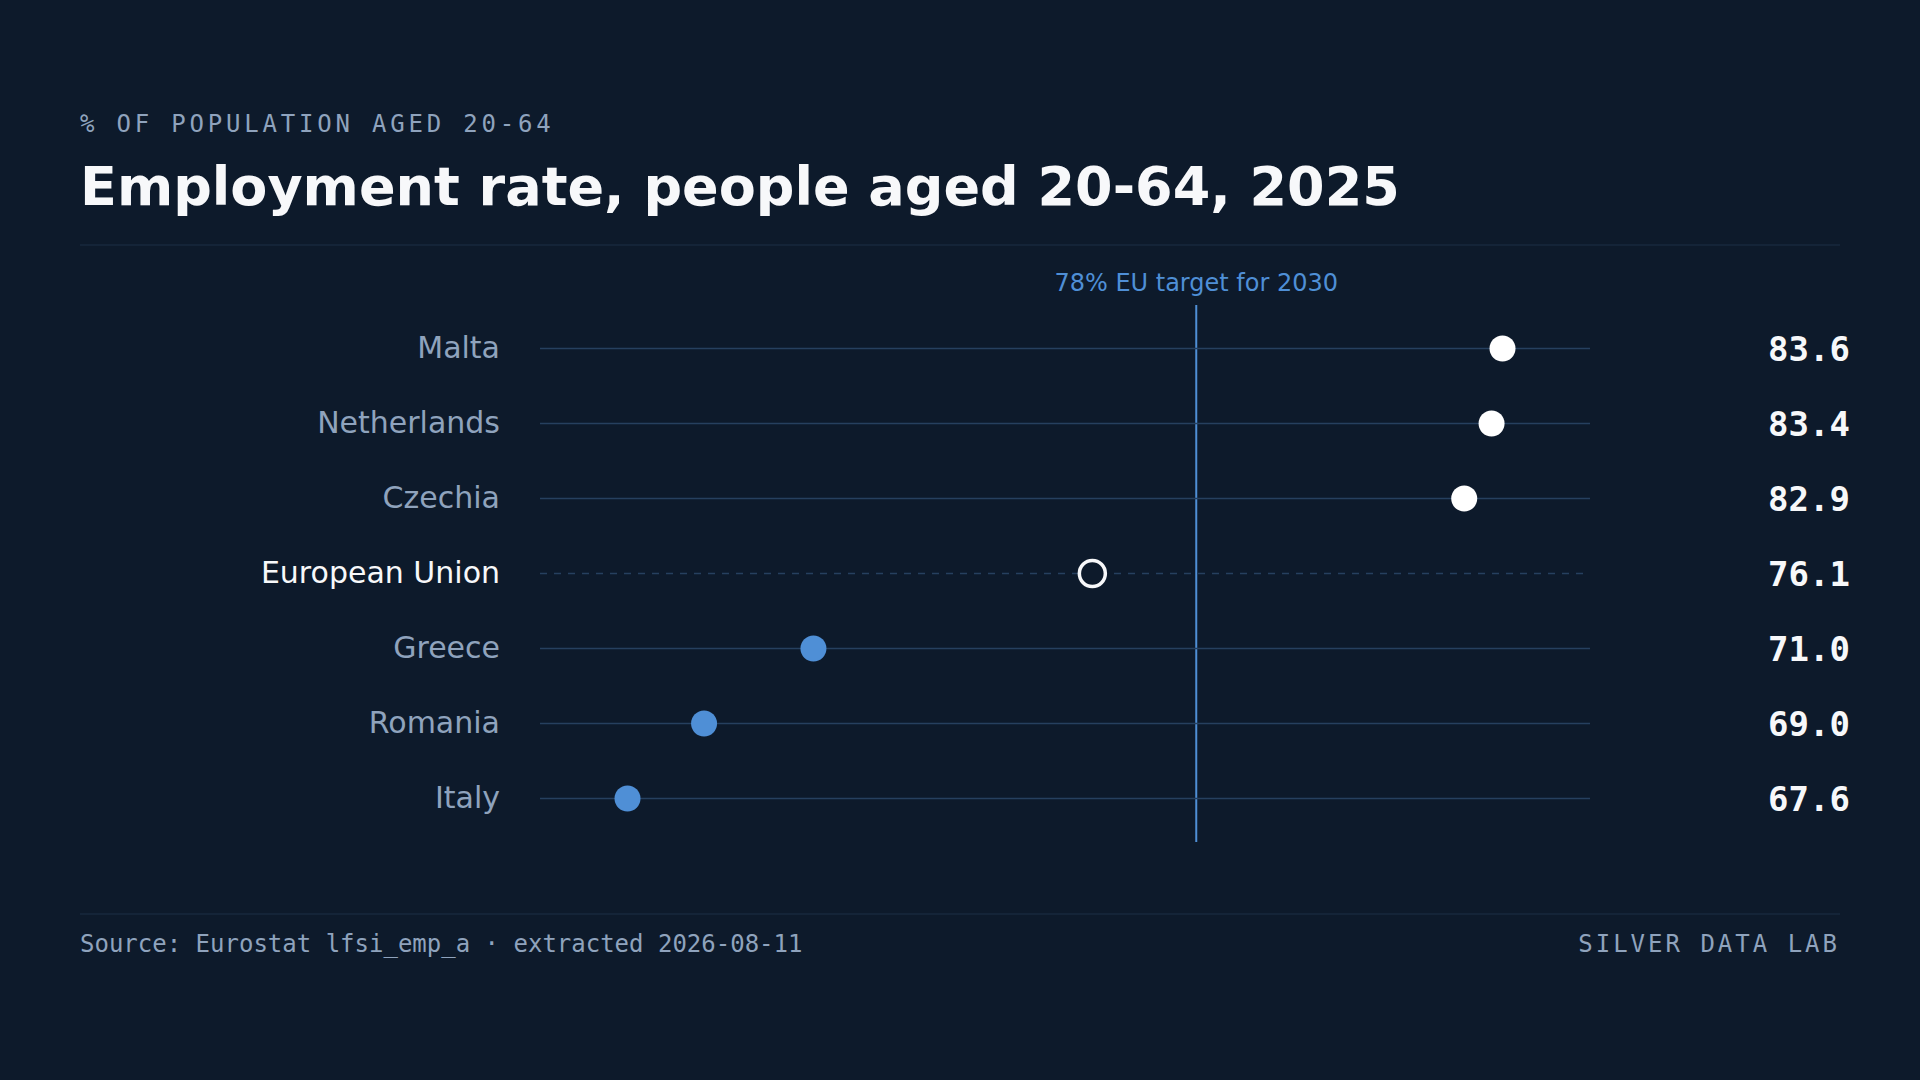
Employment Rates Vary Far More Between EU Regions Than Between Countries
76.1% of people aged 20 to 64 were in employment across the EU in 2025, or 197.8 million people — the highest reading since the series began in 2009.