The Euro Is Worth Almost the Same in Dollars as at Its Launch
Silver Data Lab Research Desk · Statistical analysis · Published on 04 August 2026
- Data source
- European Central Bank
- Reference period
- September 2026
- Last updated
- 19 October 2026
Re-checked against the source on 01 October 2026. No value in its datasets has moved between the snapshots we hold. Every revision we have observed →
Key estimates
- The euro was worth 1.1608 dollars in January 1999 and 1.1513 in September 2026 — 0.8% lower after twenty-seven years.
- Between those two points it fell to 0.8532 in June 2001 and rose to 1.5770 in July 2008.
- The strongest month was 85% above the weakest.
- The euro's monthly average was below one dollar in 35 of its 333 months, in two episodes: 33 months from February 2000, and two months in autumn 2022.
- The average across the whole series is 1.1817 dollars, close to both the launch rate and the current one.
A round trip
The euro came into existence as a unit of account in January 1999 at 1.1608 dollars. In September 2026 it stood at 1.1513.
The difference between those two figures is 0.8% — under a cent, on a currency whose monthly average has been as low as 0.8532 dollars and as high as 1.5770. A euro buys very nearly the same number of dollars as it did at launch.
What happened in between was not small.
Down 27%, then up 85%
The euro lost value almost immediately. By June 2001 it had fallen to 0.8532 dollars, 27% below its launch rate, and it spent 33 consecutive months below parity between February 2000 and October 2002 — a currency worth less than the dollar it had been created to rival.
Then it rose. The peak came in July 2008 at 1.5770, 85% above the 2001 trough, in the months before the financial crisis.
From the 2008 peak it has drifted down over eighteen years, dropping under parity again in September and October 2022 — two months, the only time its monthly average has been below one dollar since that first episode ended in October 2002.
The long-run average
Across all 333 months the average is 1.1817 dollars.
Both the launch rate and the latest rate sit within a few cents of that average. Across the whole series the euro has oscillated widely around a level it keeps returning to, rather than trending in either direction.
What an exchange rate is not
A bilateral rate is a price between two currencies, and it moves when either one moves. A fall in the euro against the dollar can reflect conditions in the euro area, conditions in the United States, or both, and this series cannot separate them.
Nor is a stronger currency straightforwardly better. A high euro makes imports cheaper for European buyers and European exports more expensive abroad; a low one does the reverse. The figures below describe the price, not its consequences.
The rate against the dollar also says nothing about the euro's value against the currencies of the euro area's other trading partners, or about what a euro buys inside the euro area, which is a question about prices rather than exchange rates.
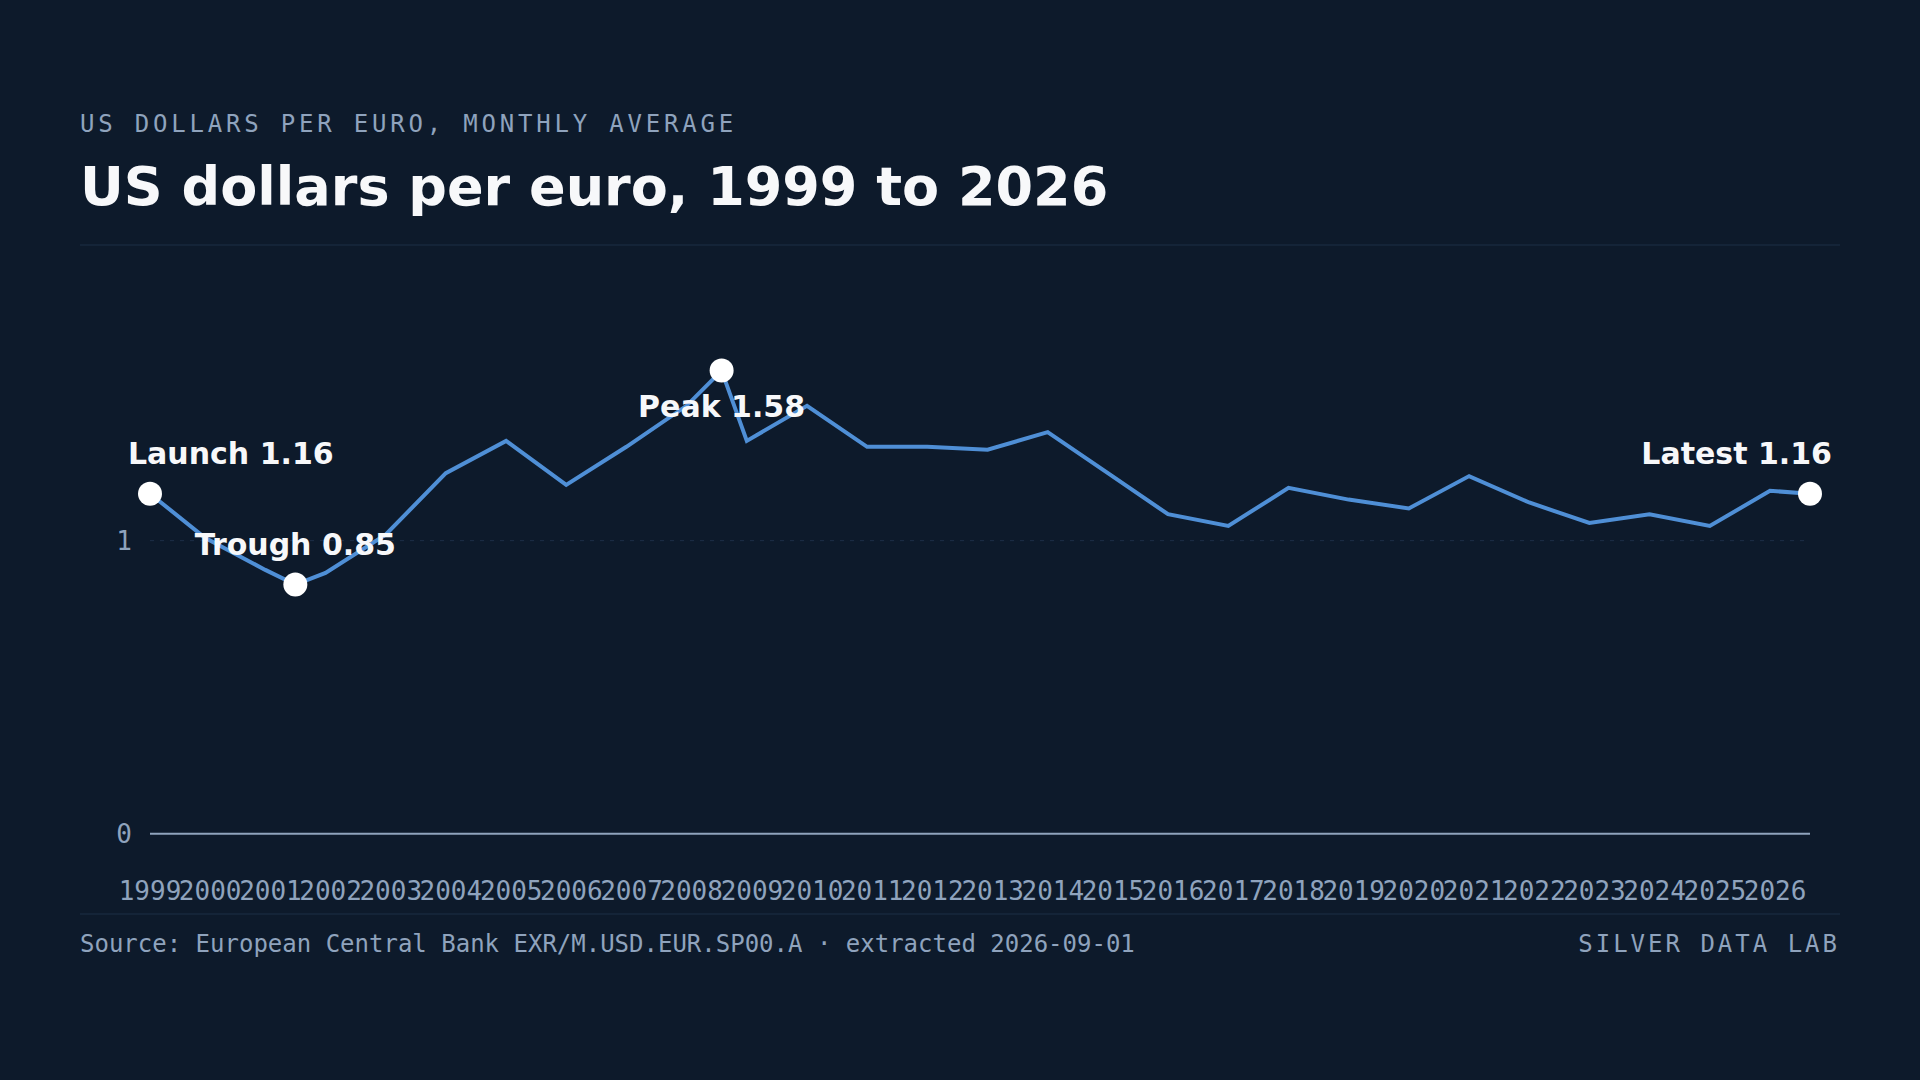
US dollars per euro, 1999 to 2026
December of each year, with the January 1999 launch, the June 2001 trough, the July 2008 peak and the latest month.
- Launch 1.16 · 1999-01-01
- Trough 0.85 · 2001-06-01
- Peak 1.58 · 2008-07-01
- Latest 1.15 · 2026-09-01
What these figures cannot tell you
- Monthly averages, not daily rates
- Each value is the average of the daily reference rates published in that month. Intra-month highs and lows are not shown, and the averaging settles more than magnitudes: it decides which month holds an extreme and which months count as below one dollar. The two lowest months are a fifth of a cent apart, June 2001 at 0.8532 and October 2000 at 0.8552, and the two highest are closer still, July 2008 at 1.5770 and April 2008 at 1.5751 — so neither turning point is sharply dated on this basis. A month whose average stayed above one dollar can contain days on which the euro traded below it.
- One bilateral pair
- This is the euro against the US dollar only. It is not a measure of the euro's overall external value, for which an effective exchange rate weighted across trading partners would be needed.
- Pre-1999 values do not exist
- The series begins in January 1999, when the euro came into existence as a unit of account. There is no earlier history to compare against.
- Chart points are year-end plus turning points
- The figure plots the December value of each year together with the launch month, the June 2001 trough, the July 2008 peak and the latest month. Intermediate months are not drawn.
- A price, not an explanation
- The series records the rate. It does not attribute movements to monetary policy, growth differentials, trade balances or capital flows, and no such attribution is made here.
- A reference rate, not a dealing rate
- The ECB publishes these rates for information, as a daily fixing averaged over the month. They are not prices at which currency can be bought or sold: a real conversion carries a spread and any fees, so what a traveller or a business receives differs from the figures here.
Frequently asked questions
- How much is the euro worth in dollars?
- 1.1513 dollars in September 2026, the monthly average of the ECB's daily reference rates. That is 0.8% below the 1.1608 at which the euro launched in January 1999.
- Has the euro ever been worth less than a dollar?
- On monthly averages, yes — in 35 of its 333 months. The average was below parity for 33 consecutive months from February 2000 to October 2002, reaching 0.8532 in June 2001, and again for two months in September and October 2022.
- When was the euro strongest against the dollar?
- July 2008, at 1.5770 dollars, 85% above its June 2001 low and in the months before the financial crisis.
- Is the euro getting weaker over time?
- Not on this measure. The average across the whole series is 1.1817 dollars, and both the launch rate and the current rate sit within a few cents of it. The currency has oscillated widely around that level rather than trending in either direction.
Methodological note
The ECB publishes euro foreign exchange reference rates through the ECB Data Portal. This study uses the monthly average US dollar rate per euro, as published, from January 1999 to September 2026.
The launch, trough, peak and latest rates are published figures. Their identification as the launch, the low, the high and the latest month is Silver Data Lab's, and so are the 0.8% change between the first and last months, the 27% fall to the 2001 low, the 85% by which the high exceeds the low, the count of months whose average was below one dollar and the two episodes they fall into, the runner-up months to the low and the high, and the series average — all derived by inspecting all 333 observations.
The chart plots each December value together with January 1999, June 2001, July 2008 and September 2026, so the turning points named in the text appear in the figure.
Source data
The underlying series can be inspected and re-downloaded from the ECB Data Portal. The filters below are the ones applied.
US dollar/Euro exchange rate, monthly average
EXR/M.USD.EUR.SP00.A
- Filters applied:
- freq=M · currency=USD · currency_denom=EUR · exr_type=SP00 (spot) · exr_suffix=A (average)
- Extracted:
- 2026-10-01
- Source last updated:
- 2026-09-01
Download the data
The data the study you have just read is built on, exactly as it was downloaded and archived.
Yours as a Member.
Data downloadable by Members
How to cite
Record the vintage as well as the study: the figures on this page are the ones extracted on the dates below.
Silver Data Lab Research Desk (2026). The Euro Is Worth Almost the Same in Dollars as at Its Launch. Silver Data Lab, published 04 August 2026, last updated 19 October 2026. https://www.silverdatalab.com/studies/euro-dollar-exchange-rate
- Data: European Central Bank, US dollar/Euro exchange rate, monthly average (EXR/M.USD.EUR.SP00.A), filters freq=M, currency=USD, currency_denom=EUR, exr_type=SP00 (spot), exr_suffix=A (average); extracted 2026-10-01; source last updated 2026-09-01. https://data.ecb.europa.eu/data/datasets/EXR
Silver Data Lab's analysis is licensed CC BY 4.0. The statistics remain their publisher's and keep its terms of reuse.
Ask the research desk
A question about this study — a definition, a filter, a break in the series, what the figures can and cannot support — answered by the desk that made the extraction.
Members can write to the research desk