Bulgaria Has the EU's Widest Gap Between Rich and Poor
Silver Data Lab Research Desk · Statistical analysis · Published on 11 June 2026
This study is open to members only
Its sources, filters and extraction date are declared above, as they are for every study. Sign in to read the analysis in full.
- Data source
- Eurostat
- Reference period
- 2025
- Last updated
- 11 October 2026
Re-checked against the source on 21 October 2026. No value in its datasets has moved between the snapshots we hold. Every revision we have observed →
Key estimates
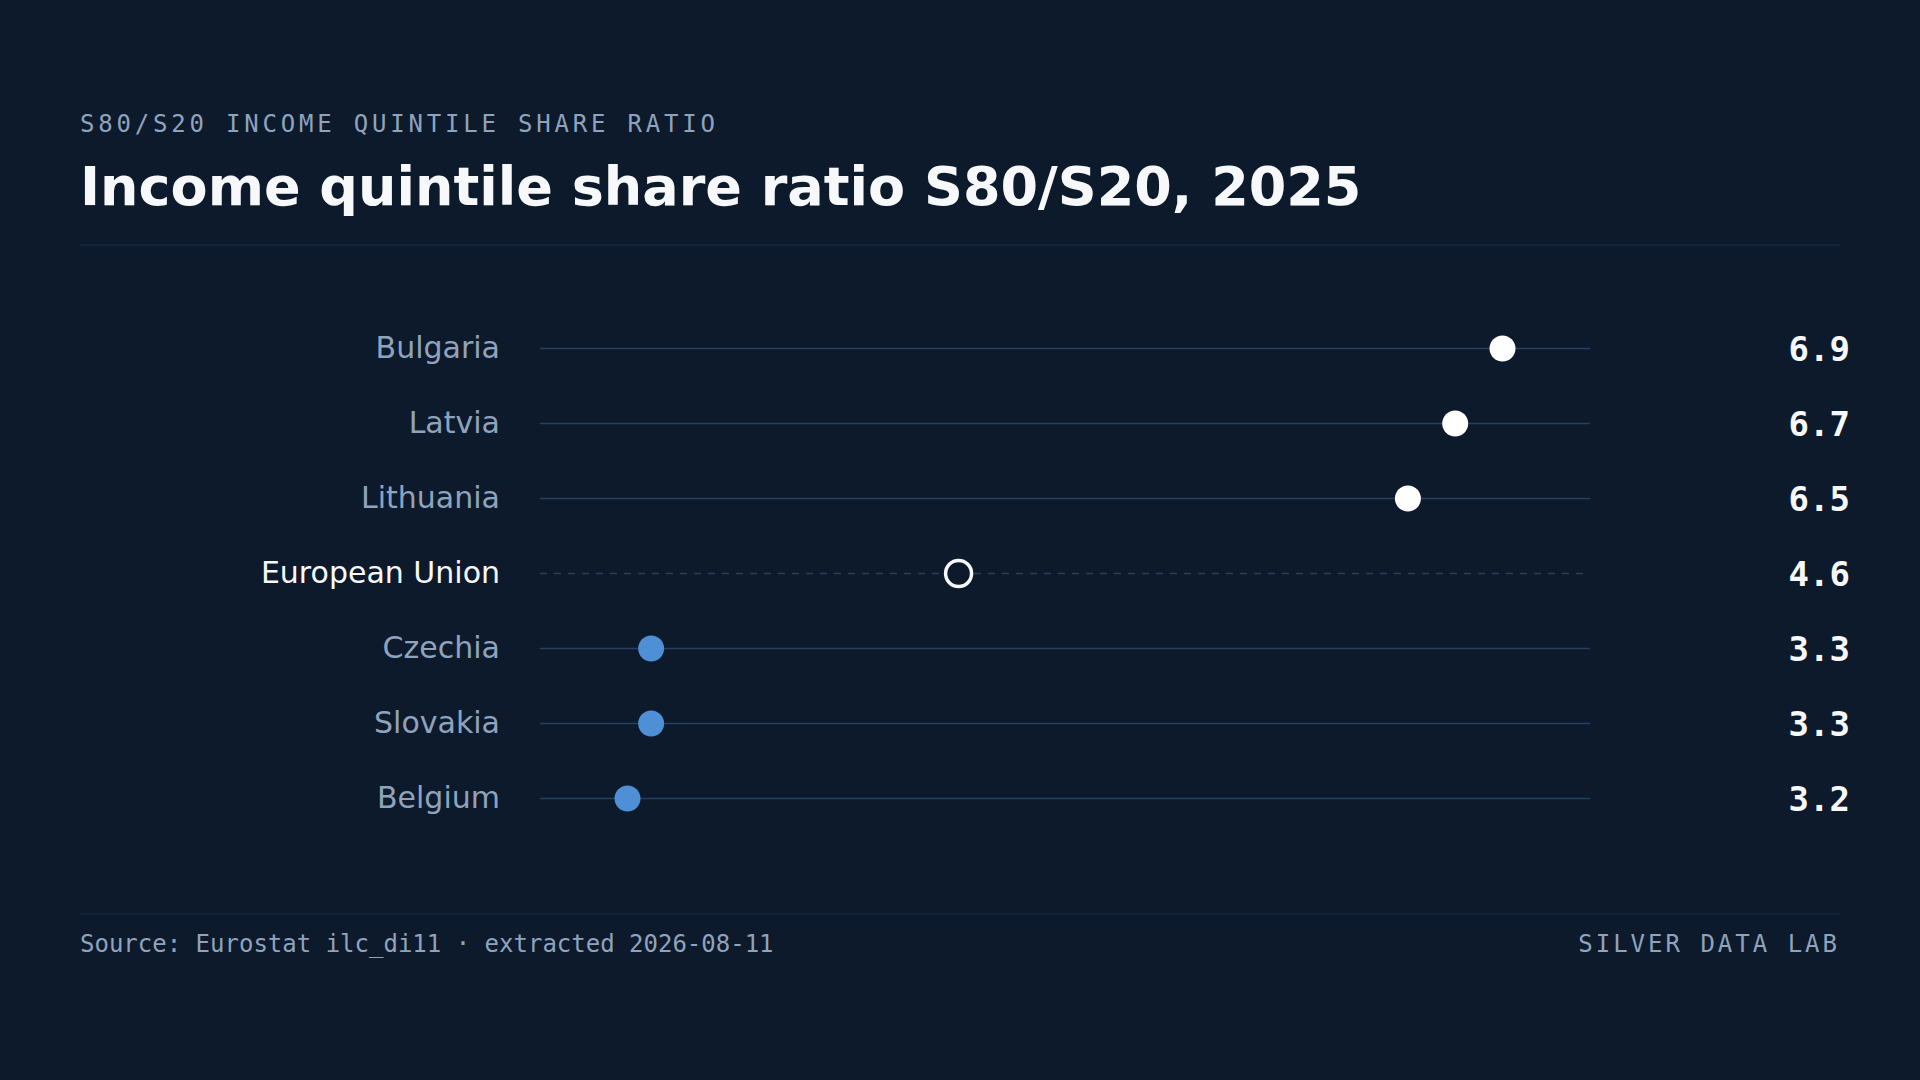
- Across the EU, the richest fifth of the population received 4.6 times the income of the poorest fifth in 2025.
- Bulgaria records 6.9, Latvia 6.7 and Lithuania 6.5 — the three widest in the Union.
- Belgium records 3.2, and Czechia and Slovakia 3.3.
- All four of the Union's largest economies sit above the EU figure: Spain at 5.2, Italy at 5.1, France and Germany both at 4.7.
- The measure compares the top and bottom fifths and ignores everything in between.
A ratio between two ends of a distribution
The S80/S20 ratio divides the total income received by the richest 20% of a population by the total received by the poorest 20%. A value of 4.6, the EU figure for 2025, means the top fifth collectively received four and a half times what the bottom fifth did.
It is a deliberately narrow measure. It says nothing about the sixty per cent in the middle, and a country can redistribute substantially within that range without moving the ratio at all.
The widest gaps
Bulgaria records 6.9, the highest in the Union. Latvia follows at 6.7 and Lithuania at 6.5.
The three Baltic and Balkan positions at the top are worth setting against the tenure and ownership data: these are also countries with very high home ownership, acquired through 1990s privatisation. High asset ownership and wide income inequality coexist there, which they do not in the Union's more equal economies.
Spain and Greece follow at 5.2, Italy and Estonia at 5.1.
The narrowest
Belgium records 3.2, the lowest ratio in the Union, with Czechia and Slovakia at 3.3, and Slovenia at 3.5.
Czechia and Slovakia in that group are the observation that separates this ranking from income. Measured in purchasing power standards against an EU average of 100, Czechia records 92 and Slovakia 75, and both distribute income more evenly than any western Member State except Belgium.
Lithuania, and why one indicator is never enough
Lithuania records the third-widest income inequality in the Union at 6.5. It also records the Union's only negative gender employment gap, with women more likely to be in work than men.
A country can be unusually equal on one dimension and unusually unequal on another. Neither figure qualifies the other, and a summary judgement about how equal Lithuania is would have to choose which of the two to ignore.
Income quintile share ratio S80/S20, 2025
| Country | Ratio | Gap to EU averagederived |
|---|---|---|
| Bulgaria | 6.9 | +2.3 |
| Latvia | 6.7 | +2.1 |
| Lithuania | 6.5p | +1.9 |
| European Unionaggregate | 4.6 | — |
| Czechia | 3.3 | −1.3 |
| Slovakia | 3.3b | −1.3 |
| Belgium | 3.2 | −1.4 |
Flags carried by the source on these values: b break in time series · p provisional
This table as data: CSV · JSON
Every Member State for this indicator+
Members see every Member State for this indicator here, not only the rows the ranking prints. Become a Member
What these figures cannot tell you
- Only the two ends are compared
- The ratio uses the top and bottom quintiles and discards the middle sixty per cent. Two countries with identical ratios can have very different distributions between those points.
- Disposable income, after transfers
- Income here is measured after taxes and social transfers, so the ratio reflects redistribution as well as market outcomes. A country with wide pre-tax inequality and strong redistribution can record a narrow ratio.
- Equivalised, not per household
- Household income is adjusted for household size and composition before ranking, using a standard equivalence scale. That scale is a convention and affects the result.
- The Lithuanian value is provisional
- Eurostat publishes Lithuania's ratio as provisional and Luxembourg's with a break-in-series flag. Lithuania is the third row of this ranking and has a section of its own below, so the flag belongs beside it. The point that section makes — that a country can be unequal on one dimension and equal on another — does not turn on the exact value, but the value may move when the year is finalised.
- Wealth is not income
- This measures annual income flows and excludes assets entirely. Countries with high home ownership and low income inequality, or the reverse, are common, and this indicator sees only one of the two.
Frequently asked questions
- What is the S80/S20 ratio?
- The total income of the richest fifth of a population divided by the total income of the poorest fifth, measured after taxes and transfers. Across the EU it was 4.6 in 2025.
- Which EU country has the widest income inequality?
- On this measure Bulgaria, at 6.9 in 2025, followed by Latvia at 6.7 and Lithuania at 6.5.
- Which EU country is the most equal?
- Belgium, at 3.2 in 2025, with Czechia and Slovakia at 3.3. Both Czechia and Slovakia have GDP per capita below the EU average, so the ranking does not follow national income.
- Does this measure wealth inequality?
- No. The ratio covers annual disposable income and excludes assets entirely. A country can have narrow income inequality and very unequal wealth, and this indicator would not show it.
Methodological note
The S80/S20 income quintile share ratio is published by Eurostat from EU-SILC as the ratio of total equivalised disposable income received by the top 20% of the population to that received by the bottom 20%.
Values are for 2025, the most recent year with complete coverage of the 27 Member States at the extraction date. Eurostat's observation flags are read from the same extraction: the Lithuanian value is provisional and the Luxembourgish one carries a break in series.
GDP per capita in purchasing power standards, quoted for Czechia and Slovakia, comes from its own extraction, declared below. It is an index on which the EU average is 100, so a value of 92 means 8% below that average and not 92% of anything else.
The comparisons with home ownership and with the gender employment gap draw on companion studies on this site, each from its own extraction.
Source data
This study draws on 2 datasets from Eurostat. Each can be inspected and re-downloaded from its catalogue, and the filters below are the ones applied.
Income quintile share ratio S80/S20 for disposable income
ilc_di11
- Filters applied:
- freq=A · age=TOTAL · sex=T · unit=RAT · time=2025
- Extracted:
- 2026-10-21
- Source last updated:
- 2026-10-20
GDP per capita in purchasing power standards
tec00114
- Filters applied:
- freq=A · indic_ppp=VI_PPS_EU27_2020_HAB · ppp_cat18=GDP · time=2025
- Extracted:
- 2026-08-11
- Source last updated:
- 2026-07-09
Download the data
The data the study you have just read is built on, exactly as it was downloaded and archived.
Yours as a Member.
Data downloadable by Members
How to cite
Record the vintage as well as the study: the figures on this page are the ones extracted on the dates below.
Silver Data Lab Research Desk (2026). Bulgaria Has the EU's Widest Gap Between Rich and Poor. Silver Data Lab, published 11 June 2026, last updated 11 October 2026. https://www.silverdatalab.com/studies/income-inequality-in-the-eu
- Data: Eurostat, Income quintile share ratio S80/S20 for disposable income (ilc_di11), filters freq=A, age=TOTAL, sex=T, unit=RAT, time=2025; extracted 2026-10-21; source last updated 2026-10-20. https://doi.org/10.2908/ilc_di11
- Data: Eurostat, GDP per capita in purchasing power standards (tec00114), filters freq=A, indic_ppp=VI_PPS_EU27_2020_HAB, ppp_cat18=GDP, time=2025; extracted 2026-08-11; source last updated 2026-07-09. https://doi.org/10.2908/tec00114
Silver Data Lab's analysis is licensed CC BY 4.0. The statistics remain their publisher's and keep its terms of reuse.
Ask the research desk
A question about this study — a definition, a filter, a break in the series, what the figures can and cannot support — answered by the desk that made the extraction.
Members can write to the research desk
Other studies on the same dataset
GDP per Head Makes Luxembourg and Ireland Look Richer Than They Are
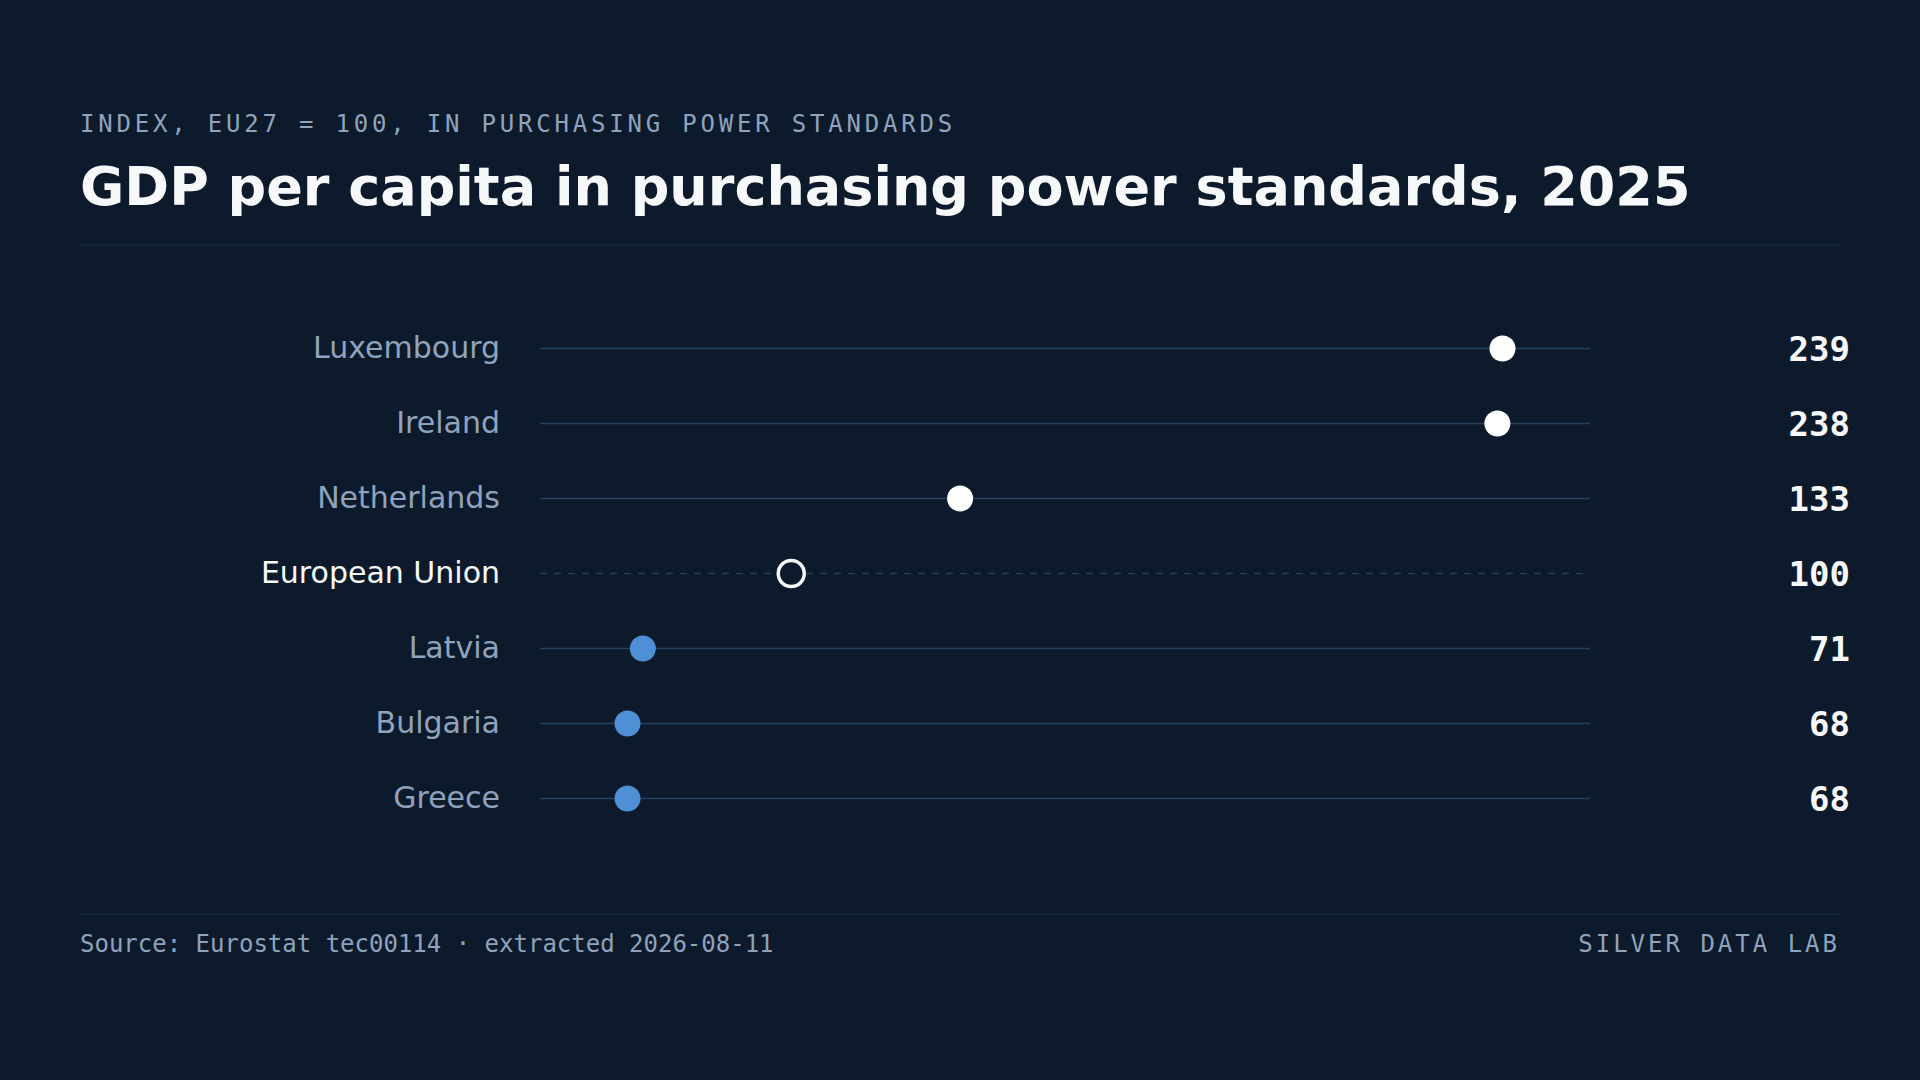
Luxembourg records 239 and Ireland 238 against an EU average of 100 — more than double the Union's output per head.
In Four EU Countries, Over 80% of People Have Basic Digital Skills
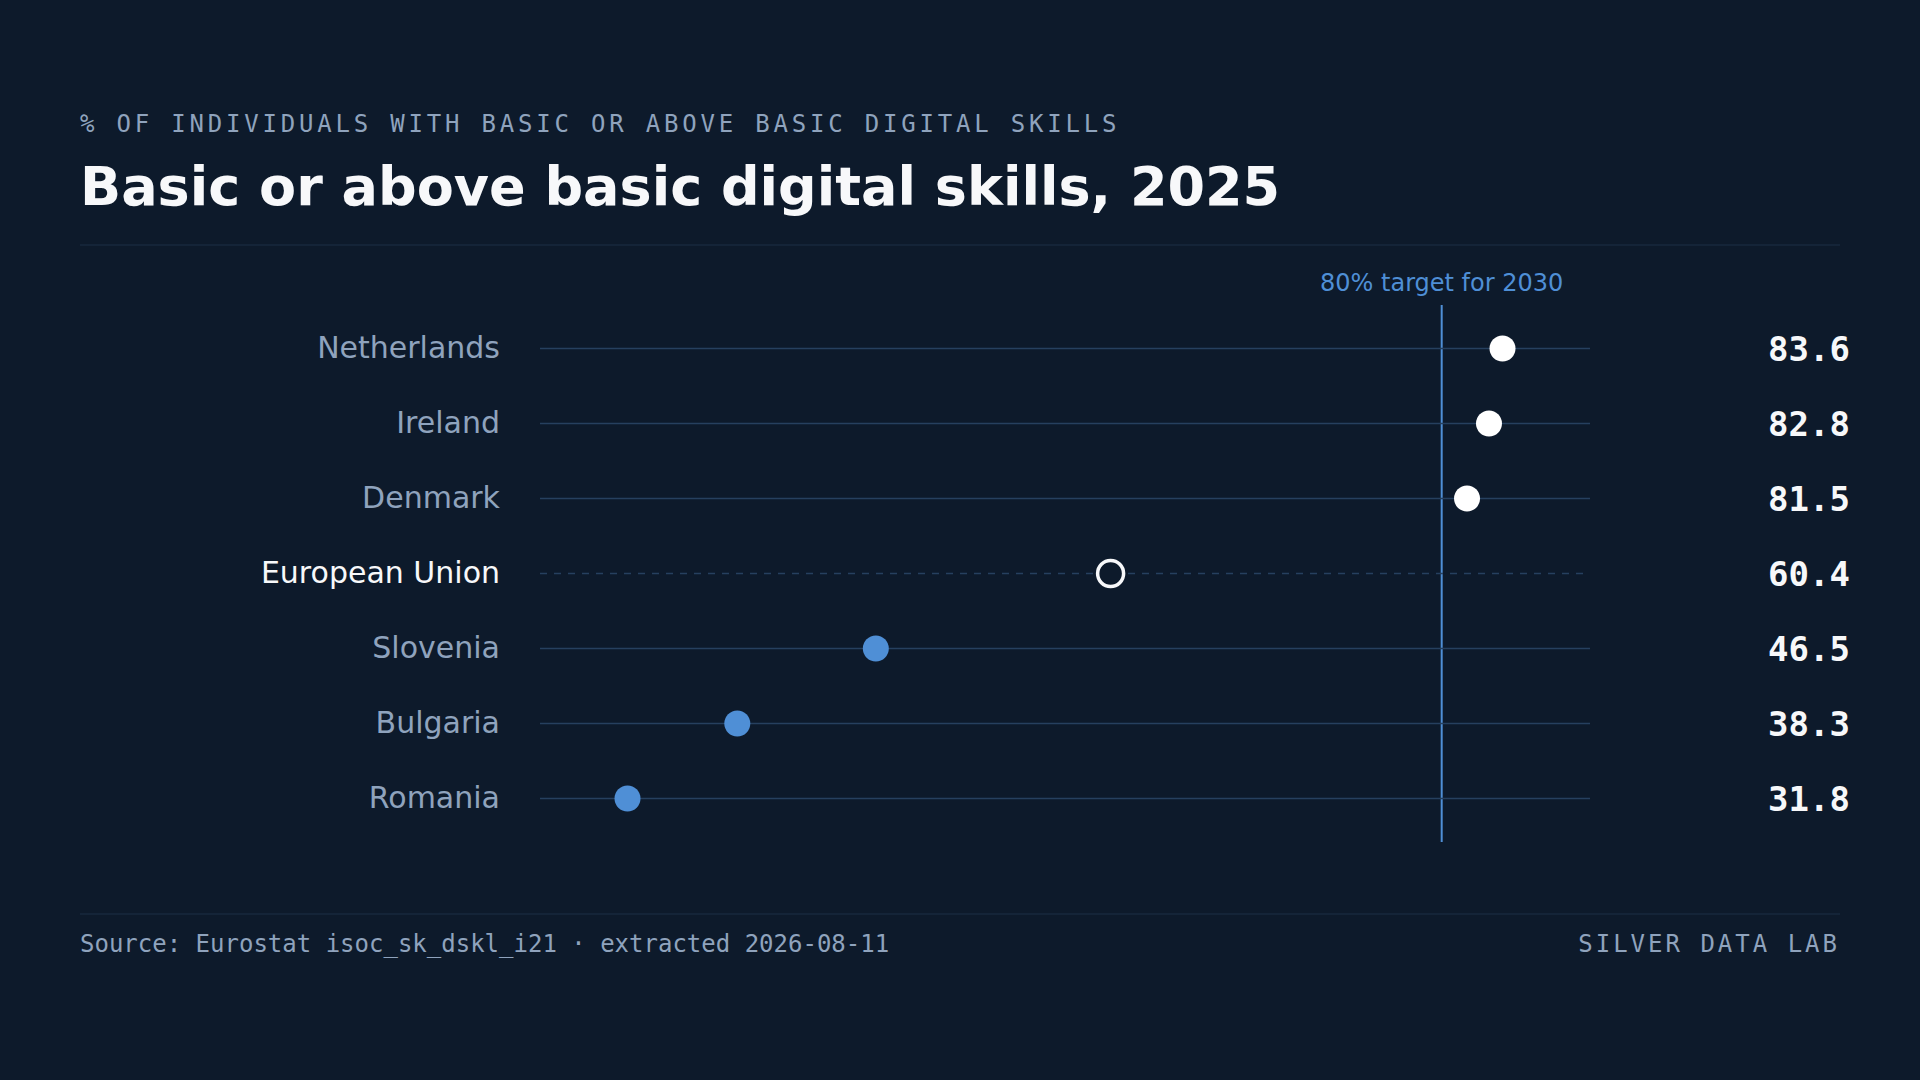
60.4% of people in the EU had at least basic overall digital skills in 2025, against the 80% the Union targets for 2030.
Three Quarters of Irish Farm Output Comes From Animals
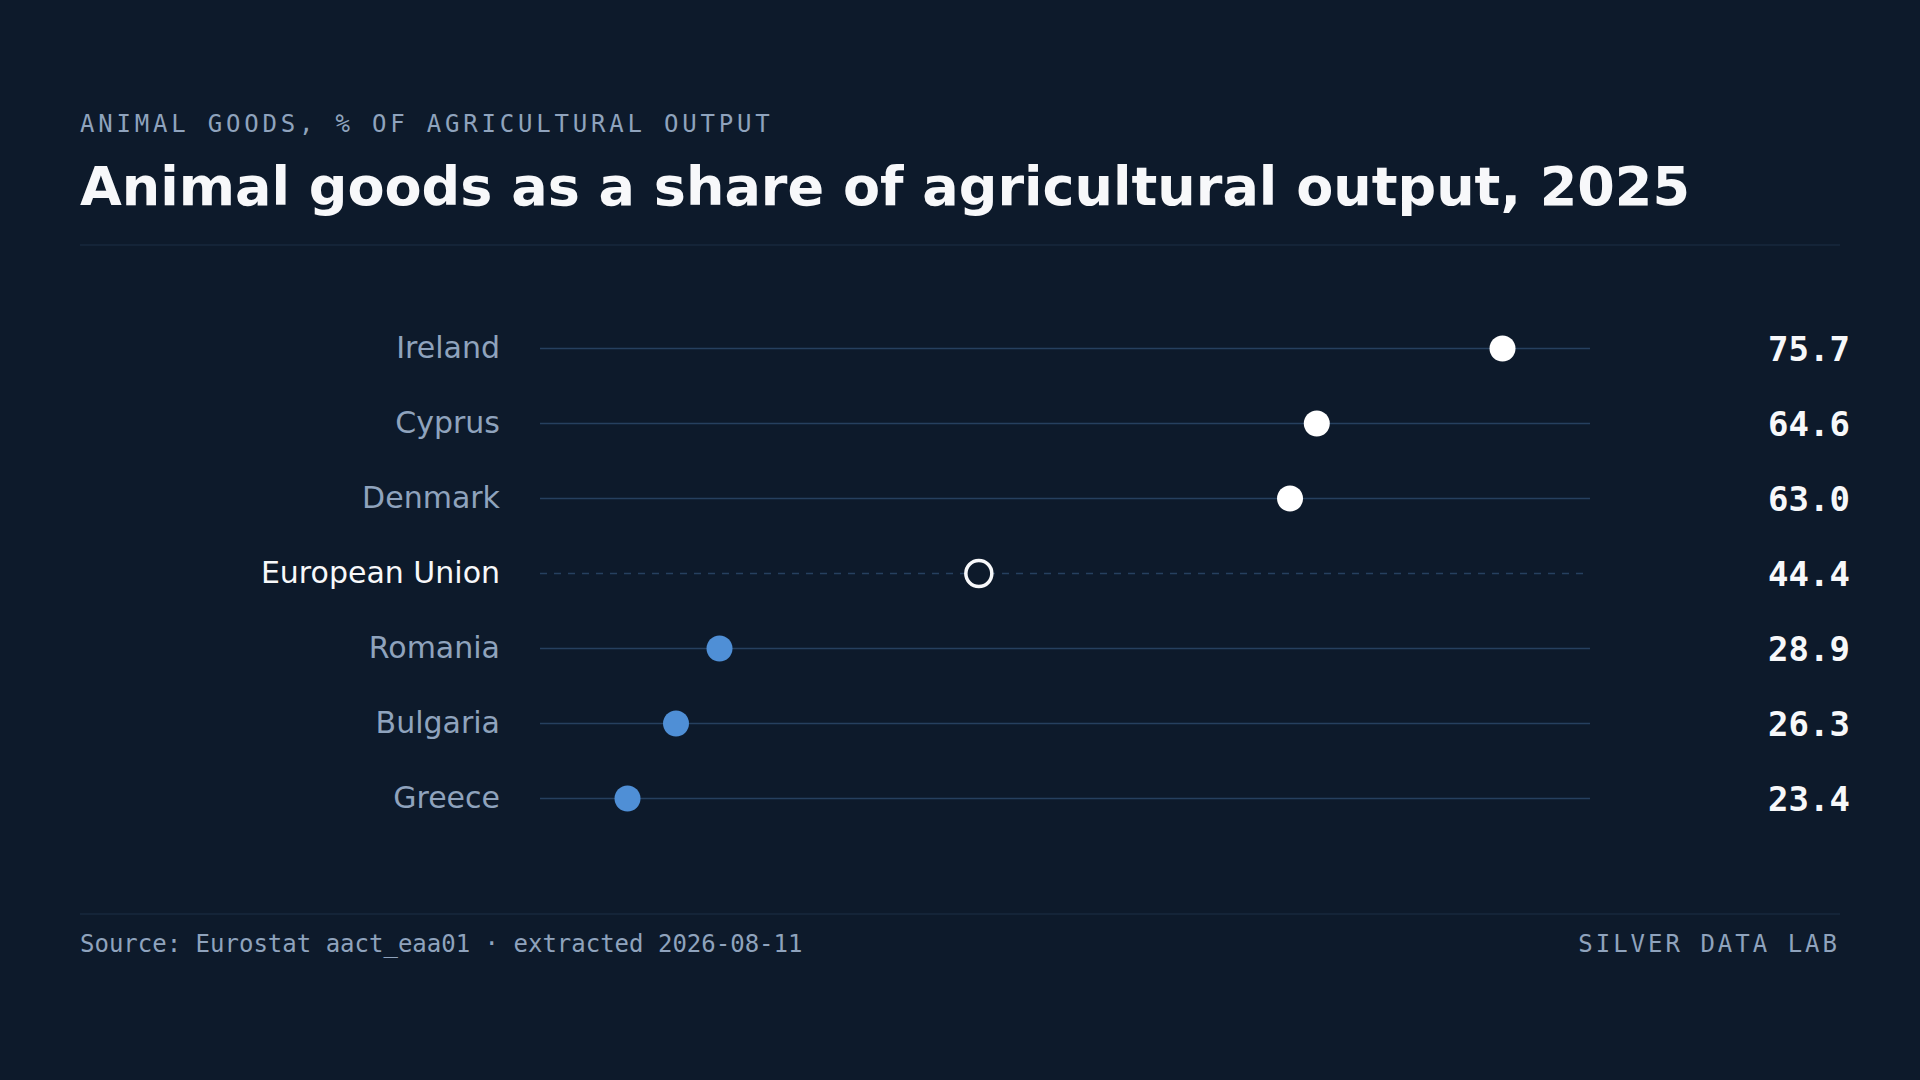
Animal goods accounted for 44.4% of EU agricultural output by value in 2025.
Studies where the same country leads or trails
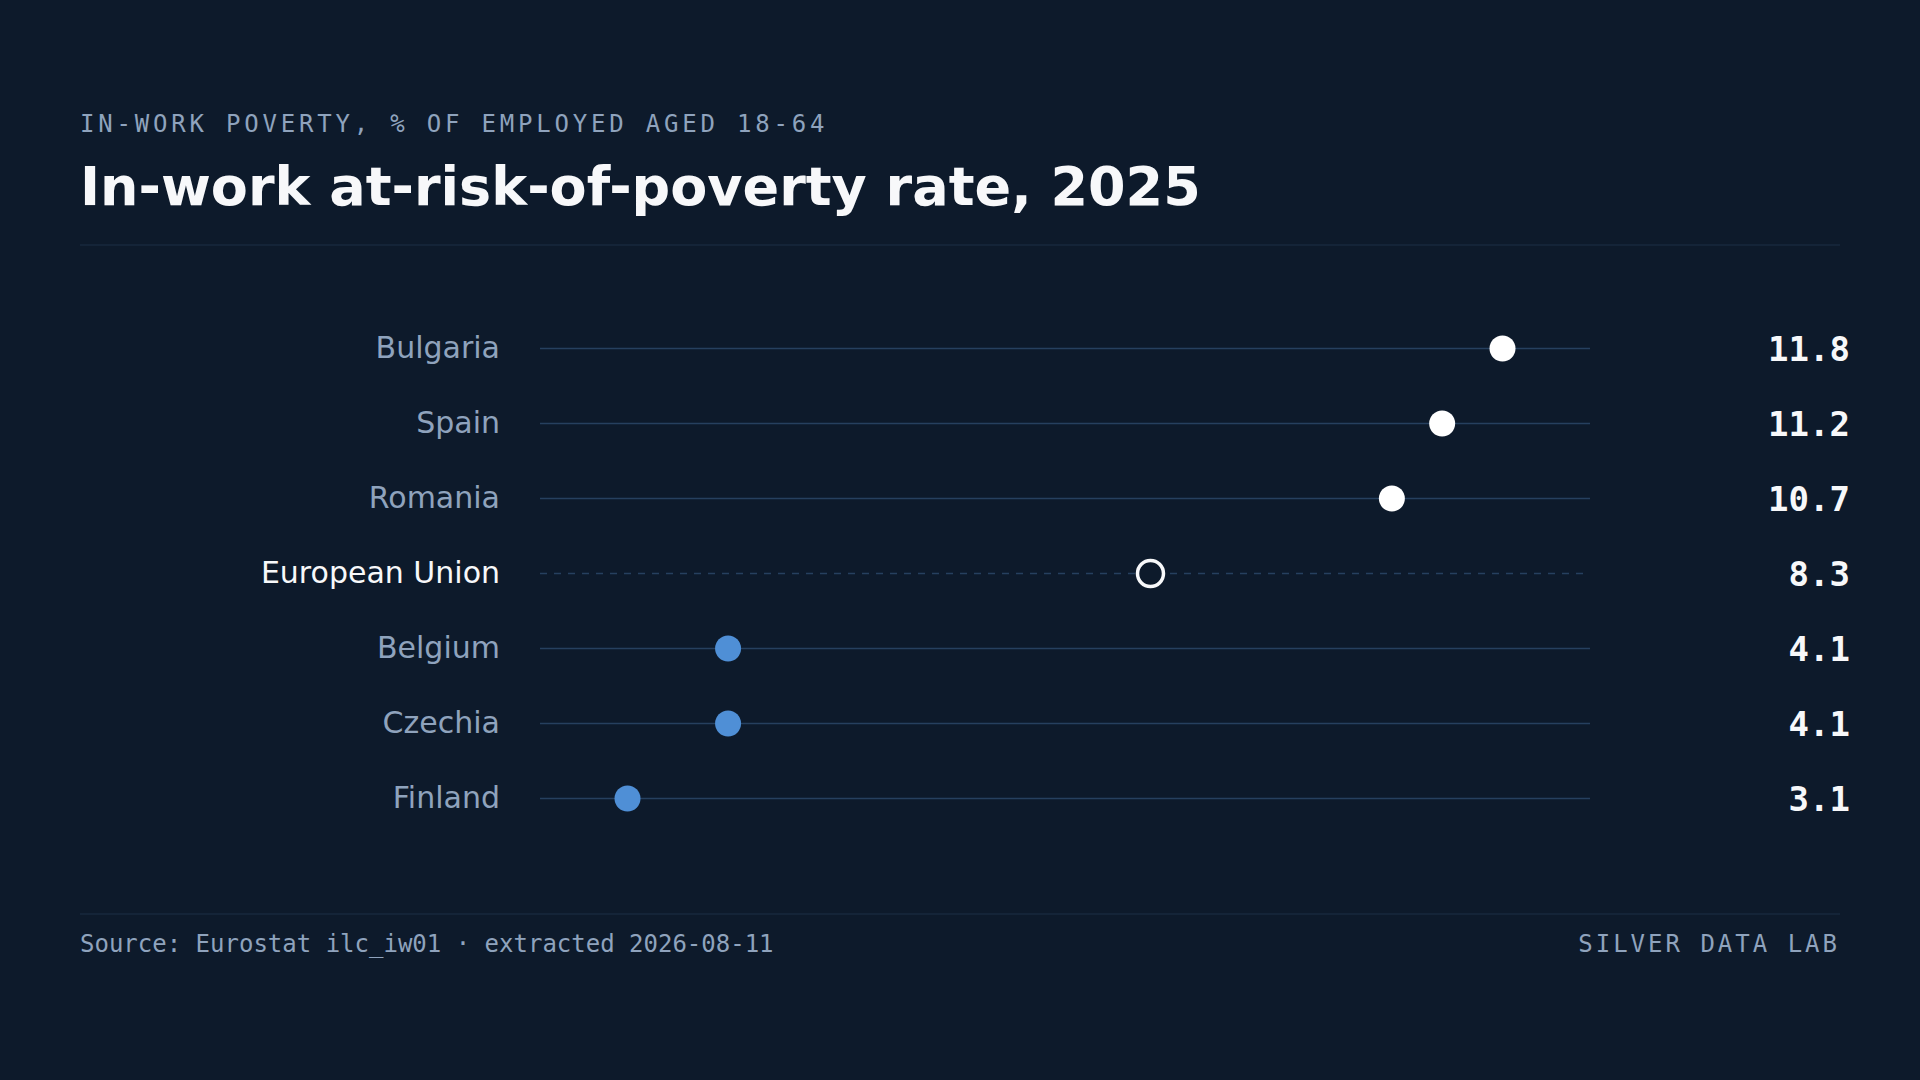
11.8% of Bulgarians With a Job Are Poor, the Highest Share in the EU
8.3% of employed people aged 18 to 64 in the EU lived below the at-risk-of-poverty line in 2025.
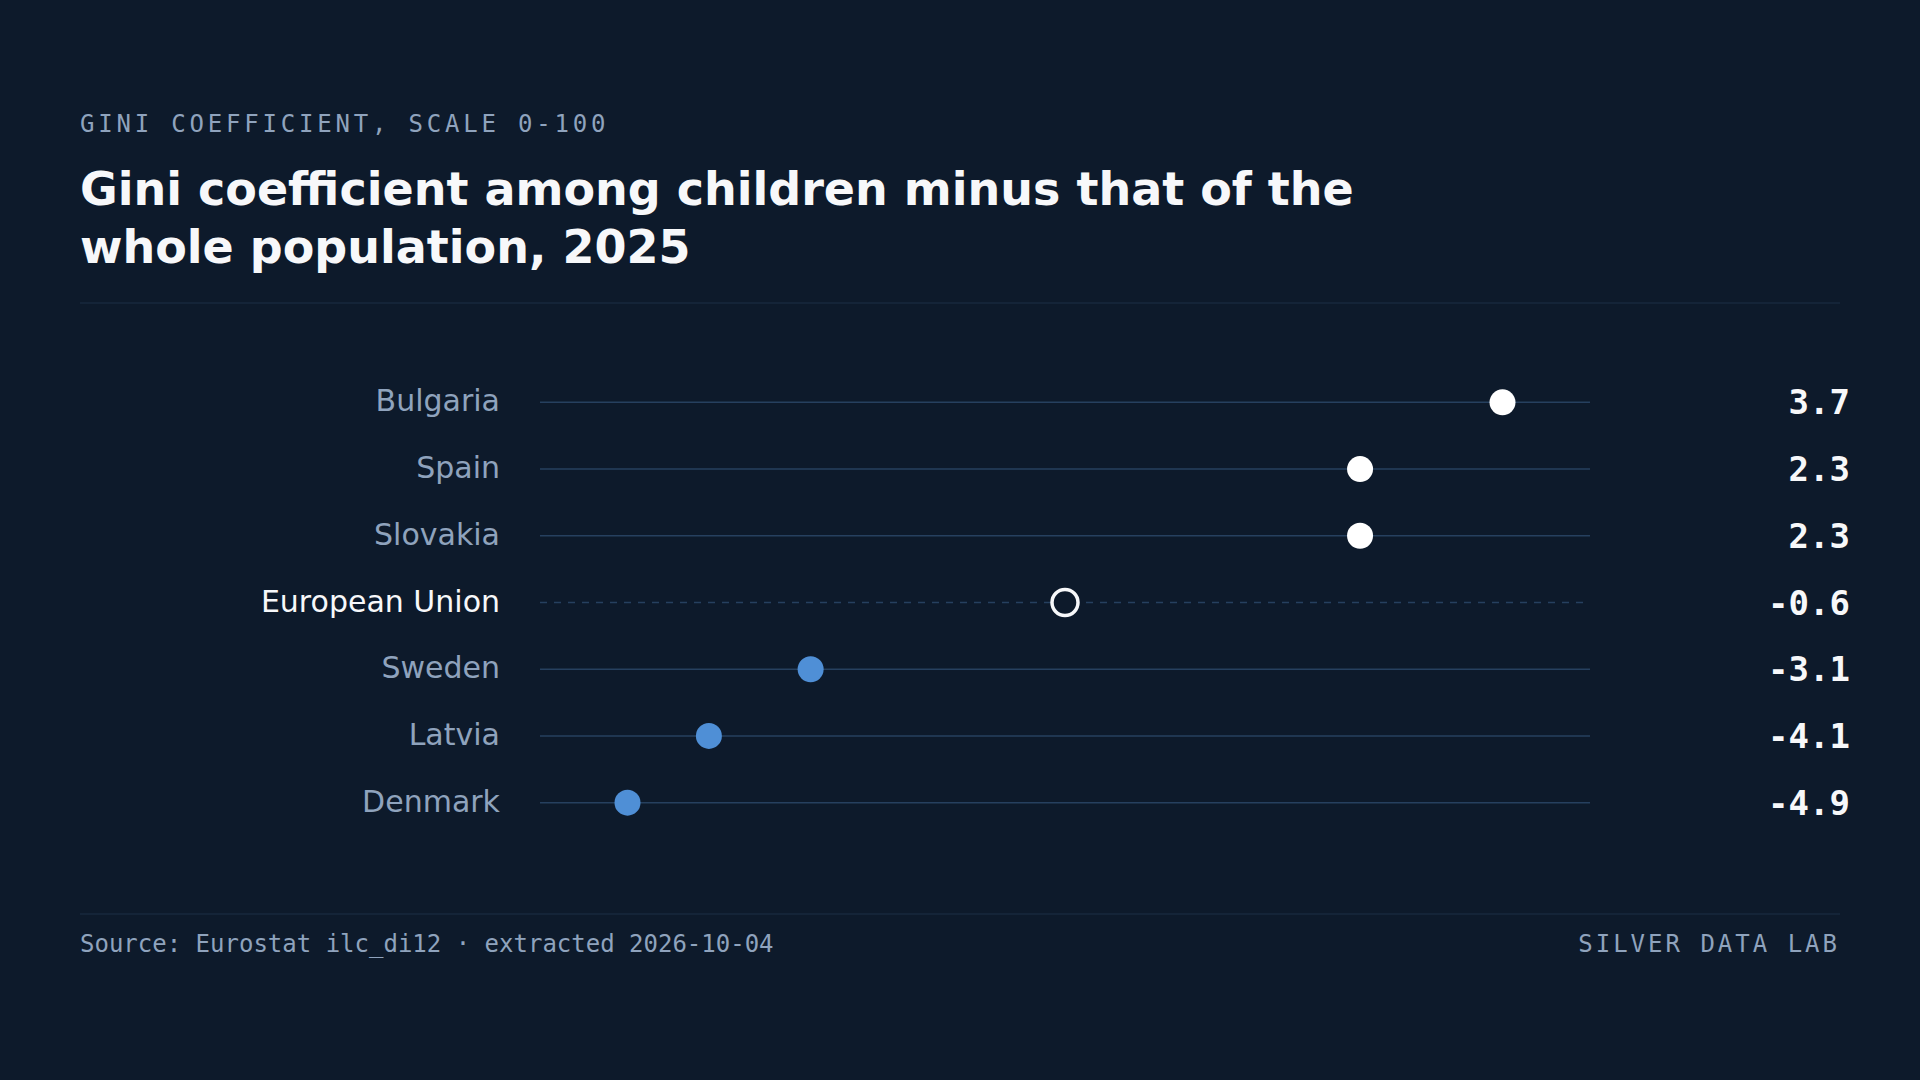
Among EU Children, Family Incomes Are Most Unequal in Bulgaria
Across the EU the Gini coefficient of disposable income among children under 18 was 28.6 in 2025, against 29.2 for the population as a whole.
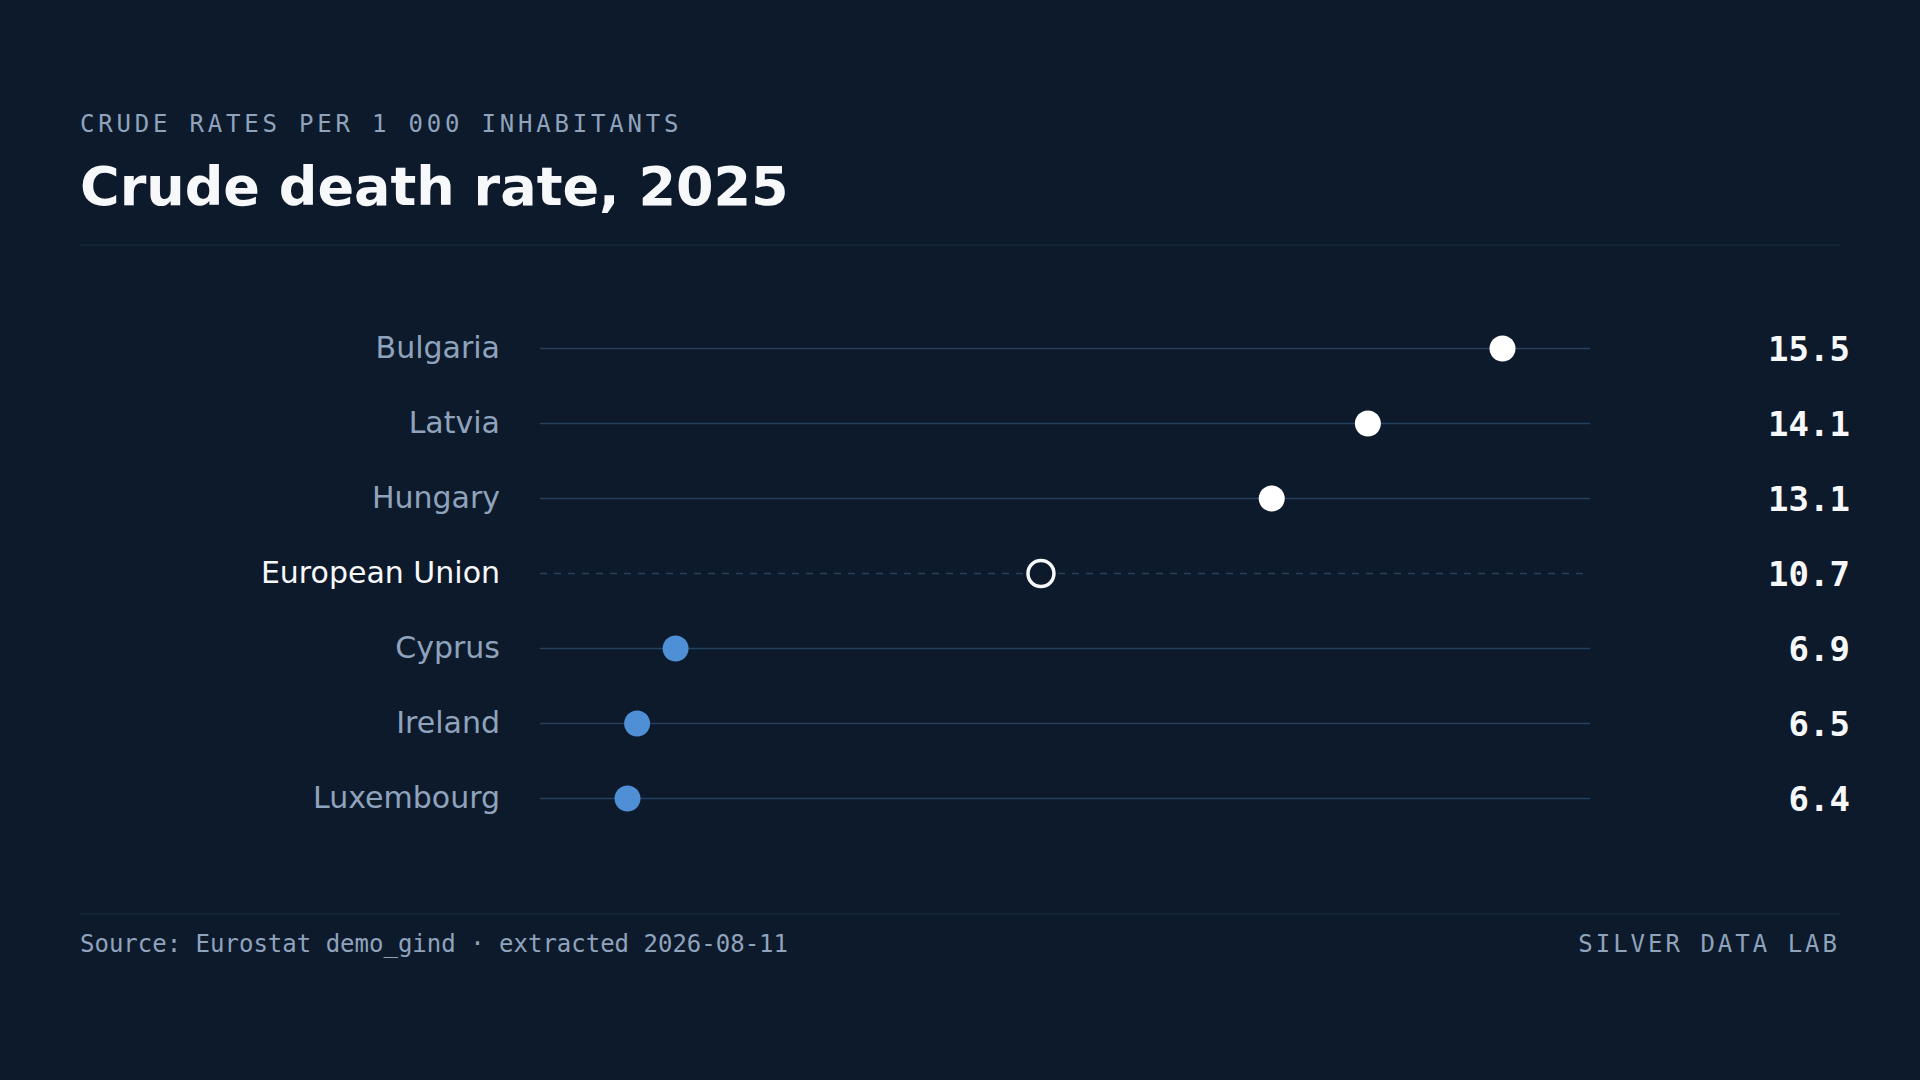
Deaths Outnumber Births in Twenty-One EU Countries
The EU recorded 7.7 births and 10.7 deaths per thousand inhabitants in 2025: a natural change of −3.0.