Manufacturing Is a Smaller Part of France's Economy Than of Bulgaria's
Silver Data Lab Research Desk · Statistical analysis · Published on 11 August 2026
- Data source
- Eurostat
- Reference period
- 2025
- Last updated
- 22 October 2026
Re-checked against the source on 23 October 2026. 28 values in its datasets moved between snapshots, 4 of them figures stated on this page. Every revision we have observed →
Key estimates
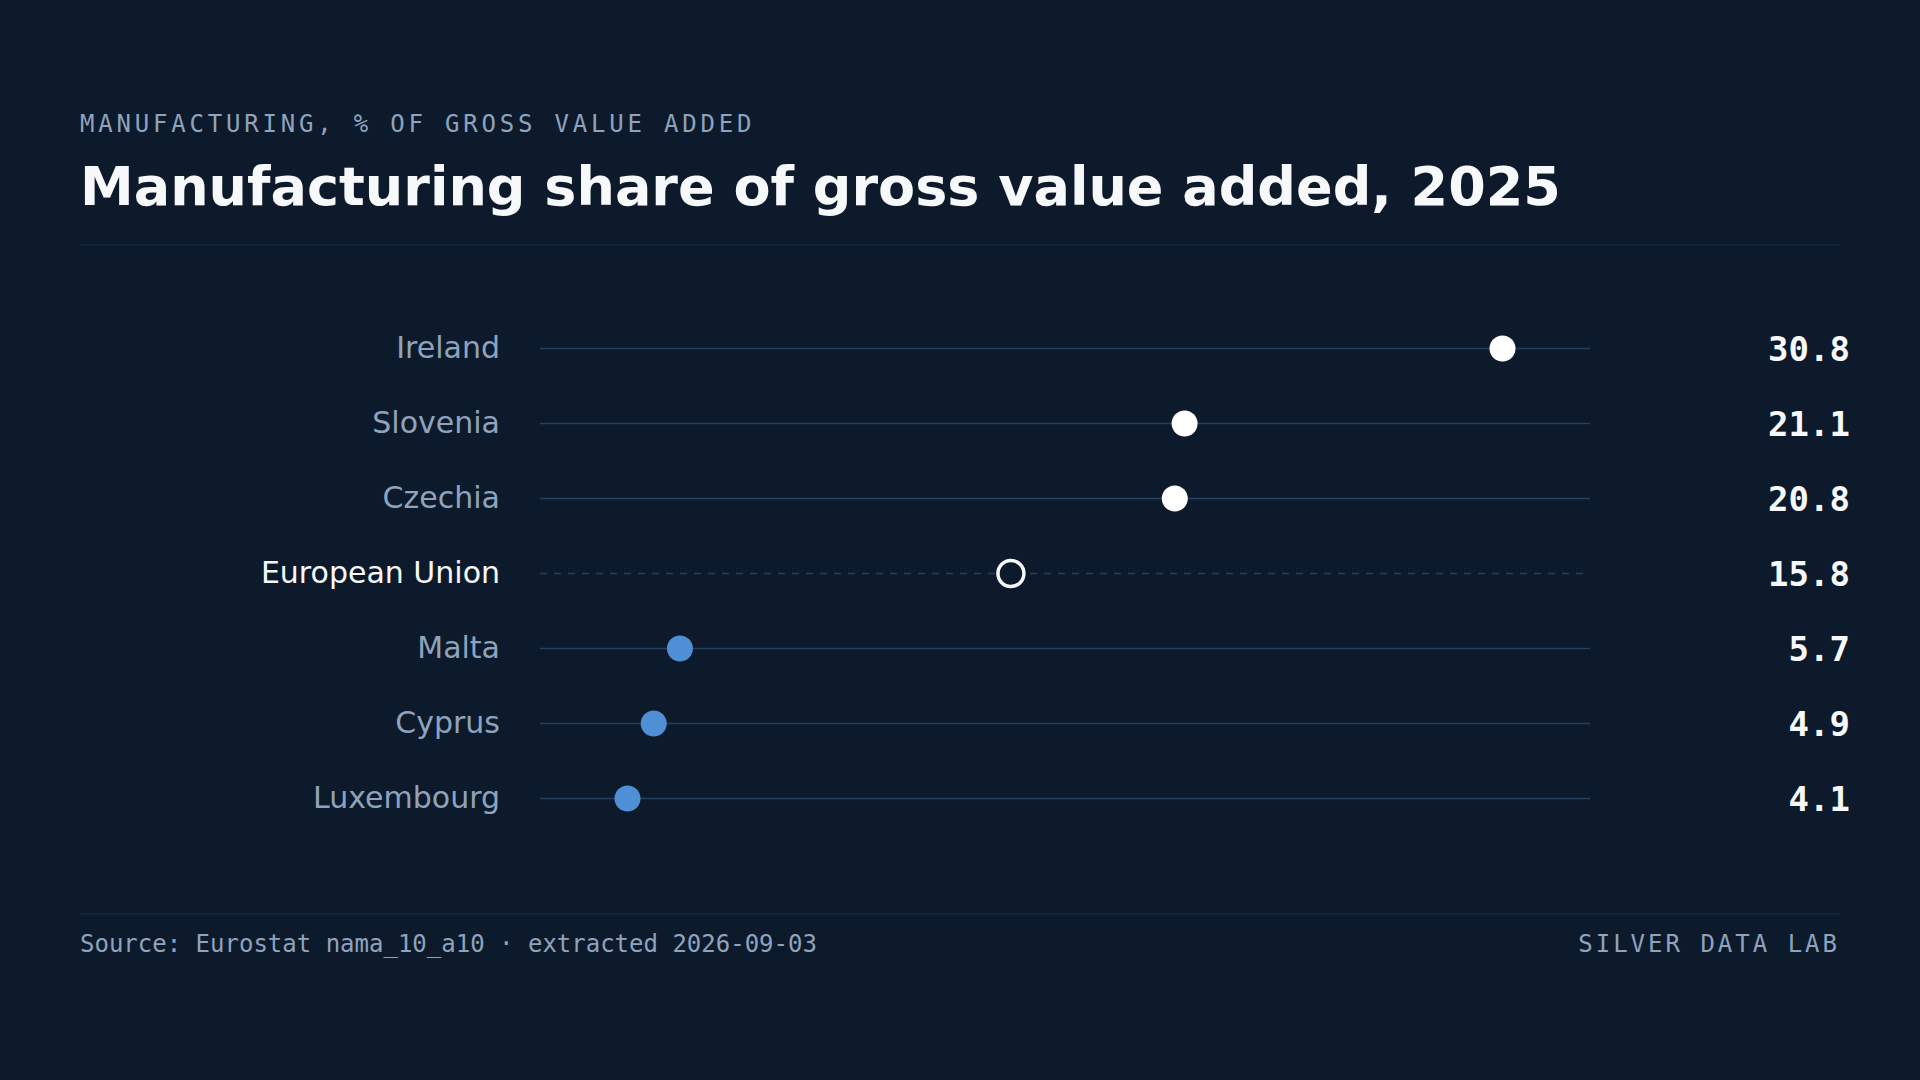
- Manufacturing accounted for 15.8% of gross value added in the EU in 2025.
- Slovenia at 21.1% and Czechia at 20.8% are the highest genuinely industrial economies in the Union.
- Ireland records 30.8%, a figure produced by multinational accounting rather than by Irish factories.
- France records 11.2%, joint fourth from the bottom of the Union with Greece, and below Bulgaria, Romania and Portugal.
- Eleven Member States are above the EU share and sixteen below it.
Where the Union still makes things
Manufacturing's share of gross value added measures how much of an economy's output comes from making physical goods, as against services, construction, agriculture and energy.
For the European Union as a whole the answer in 2025 was 15.8%. Roughly one euro of value added in six.
The Irish figure, and why it comes first
Ireland tops the ranking at 30.8%, nearly double the EU share, and the number should be read with care rather than at face value.
Ireland hosts the European operations of a number of large pharmaceutical and technology firms, and output booked to those operations enters Irish value added. The resulting manufacturing share describes where profits are recorded more than where work is done. Irish manufacturing employment is not twice the European norm.
Stating that is not a reason to exclude the figure. It is a reason to read the second and third positions as the top of the ranking of ordinary industrial economies.
The central European belt
Slovenia records 21.1% and Czechia 20.8%. Slovakia follows at 17.5% and Hungary at 17.1%.
Germany, the economy most associated with European manufacturing, records 19.4% — behind Slovenia, Czechia and Denmark. It remains by far the Union's largest manufacturer in absolute terms, and in proportion to its own economy it is one industrial country among several.
The pattern is a belt running from Poland through Czechia, Slovakia and Hungary into Slovenia and Austria, tied into German supply chains. Most of them sell the bulk of their goods exports inside the Union rather than outside it, though Slovenia is a conspicuous exception; the intra-EU trade study on this site has the ranking.
France
France records 11.2%, the same share as Greece, and the two sit joint fourth from the bottom of the Union. The three below them are Malta, Cyprus and Luxembourg, all of them micro-states.
France manufactures a smaller share of its output than Bulgaria at 13.1%, Romania at 14.6% or Portugal at 12.8%, and well under Italy at 16.7%.
It is not alone down there, though, and that is the part usually missed. Spain and the Netherlands both record 11.7% and Latvia 11.6% — half a point or less above France and Greece, which puts five Member States in the same band rather than one exception. France is still the case that carries weight, because it is the Union's second-largest economy and because its industrial position is a recurring subject of its own politics, but the low-share group is a group.
What the indicator does not say
A share is not a size. France's manufacturing sector is one of the largest in the Union in absolute terms; it is small relative to the French economy, which has a correspondingly large services sector.
Nor does a falling share mean a shrinking industry. An economy whose services grow faster than its factories will show a declining manufacturing share while manufacturing output rises. This measure ranks composition, not industrial health.
Manufacturing share of gross value added, 2025
| Country | % of gross value added | Gap to EU averagepercentage points, derived |
|---|---|---|
| Ireland | 30.8 | +15.0 |
| Slovenia | 21.1 | +5.3 |
| Czechia | 20.8 | +5.0 |
| European Unionaggregate | 15.8 | — |
| Malta | 5.7 | −10.1 |
| Cyprus | 5.0p | −10.8 |
| Luxembourg | 4.6p | −11.2 |
Flags carried by the source on these values: p provisional
This table as data: CSV · JSON
Every Member State for this indicator+
Members see every Member State for this indicator here, not only the rows the ranking prints. Become a Member
Embed this chart
Paste this code into a page. The frame carries the source and the extraction date, and links back to the study.
What these figures cannot tell you
- A share, not a level
- The indicator measures manufacturing against the rest of the domestic economy. A country can increase manufacturing output and still record a falling share if its services sector grows faster, so this is a measure of composition rather than of industrial performance.
- Ireland is distorted by multinational accounting
- Output booked to foreign-owned pharmaceutical and technology operations enters Irish value added, producing a manufacturing share far above what Irish manufacturing employment would suggest. The figure is correct as published and does not describe the domestic economy.
- Manufacturing excludes mining, energy and construction
- NACE section C covers manufacturing alone. Economies with large extractive or energy sectors record those elsewhere, so this is not a measure of the whole industrial base.
- Value added is measured where activity is recorded
- In closely integrated supply chains, the same product passes through several countries and each records only its own value added. That is the correct treatment, and it means national shares reflect position in a chain as well as industrial strength.
- Nine of the shares on this page are not final
- Eurostat publishes the 2025 value of this indicator as provisional for eleven Member States: Belgium, Croatia, Cyprus, France, Germany, Greece, Hungary, Luxembourg, Portugal, Romania and Spain. Nine of the nineteen shares printed on this page come from that group, including France, one of the two countries the title compares; the EU aggregate carries no such flag. A provisional value can be revised, and a comparison between two of them can reorder.
Frequently asked questions
- How much of the EU economy is manufacturing?
- 15.8% of gross value added in 2025 — roughly one euro in six. National shares run from 30.8% in Ireland to 4.6% in Luxembourg.
- Which EU country manufactures the most?
- As a share of its own economy, Ireland at 30.8%, though that figure reflects output booked by foreign-owned firms rather than Irish factories. Among ordinary industrial economies Slovenia leads at 21.1%, followed by Czechia at 20.8%. In absolute terms Germany is the Union's largest manufacturer by a wide margin.
- Why is France so low on manufacturing?
- France records 11.2% of gross value added, joint fourth from the bottom of the Union with Greece. Only three micro-states are lower. It manufactures a smaller share of its output than Bulgaria, Romania or Portugal, though its manufacturing sector remains one of the largest in the Union in absolute terms.
- Does a low manufacturing share mean industrial decline?
- Not necessarily. The share falls whenever the rest of the economy grows faster, even if manufacturing output is rising. The indicator ranks what an economy is made of, not whether its industry is healthy.
Methodological note
Gross value added by industry is published by Eurostat under NACE Rev. 2. This study uses section C, manufacturing, expressed as a percentage of total gross value added across all activities.
Values are for 2025, the most recent year with complete coverage of the 27 Member States at the extraction date.
The counts of Member States above and below the EU share, the count above 20%, France's position from the bottom of the ranking, the comparisons with individual Member States, and the count of provisional values read from the source's own observation flags are derived by Silver Data Lab from the published shares.
Source data
The underlying series can be inspected and re-downloaded from the Eurostat data browser. The filters below are the ones applied.
Gross value added and income by main industry (NACE Rev. 2)
nama_10_a10
- Filters applied:
- freq=A · unit=PC_TOT · na_item=B1G · nace_r2=C · time=2025
- Extracted:
- 2026-10-23
- Source last updated:
- 2026-10-22
Download the data
The data the study you have just read is built on, exactly as it was downloaded and archived.
Yours as a Member.
Data downloadable by Members
How to cite
Record the vintage as well as the study: the figures on this page are the ones extracted on the dates below.
Silver Data Lab Research Desk (2026). Manufacturing Is a Smaller Part of France's Economy Than of Bulgaria's. Silver Data Lab, published 11 August 2026, last updated 22 October 2026. https://www.silverdatalab.com/studies/manufacturing-in-the-eu
- Data: Eurostat, Gross value added and income by main industry (NACE Rev. 2) (nama_10_a10), filters freq=A, unit=PC_TOT, na_item=B1G, nace_r2=C, time=2025; extracted 2026-10-23; source last updated 2026-10-22. https://doi.org/10.2908/nama_10_a10
Silver Data Lab's analysis is licensed CC BY 4.0. The statistics remain their publisher's and keep its terms of reuse.
Ask the research desk
A question about this study — a definition, a filter, a break in the series, what the figures can and cannot support — answered by the desk that made the extraction.
Members can write to the research desk
Other studies on the same dataset
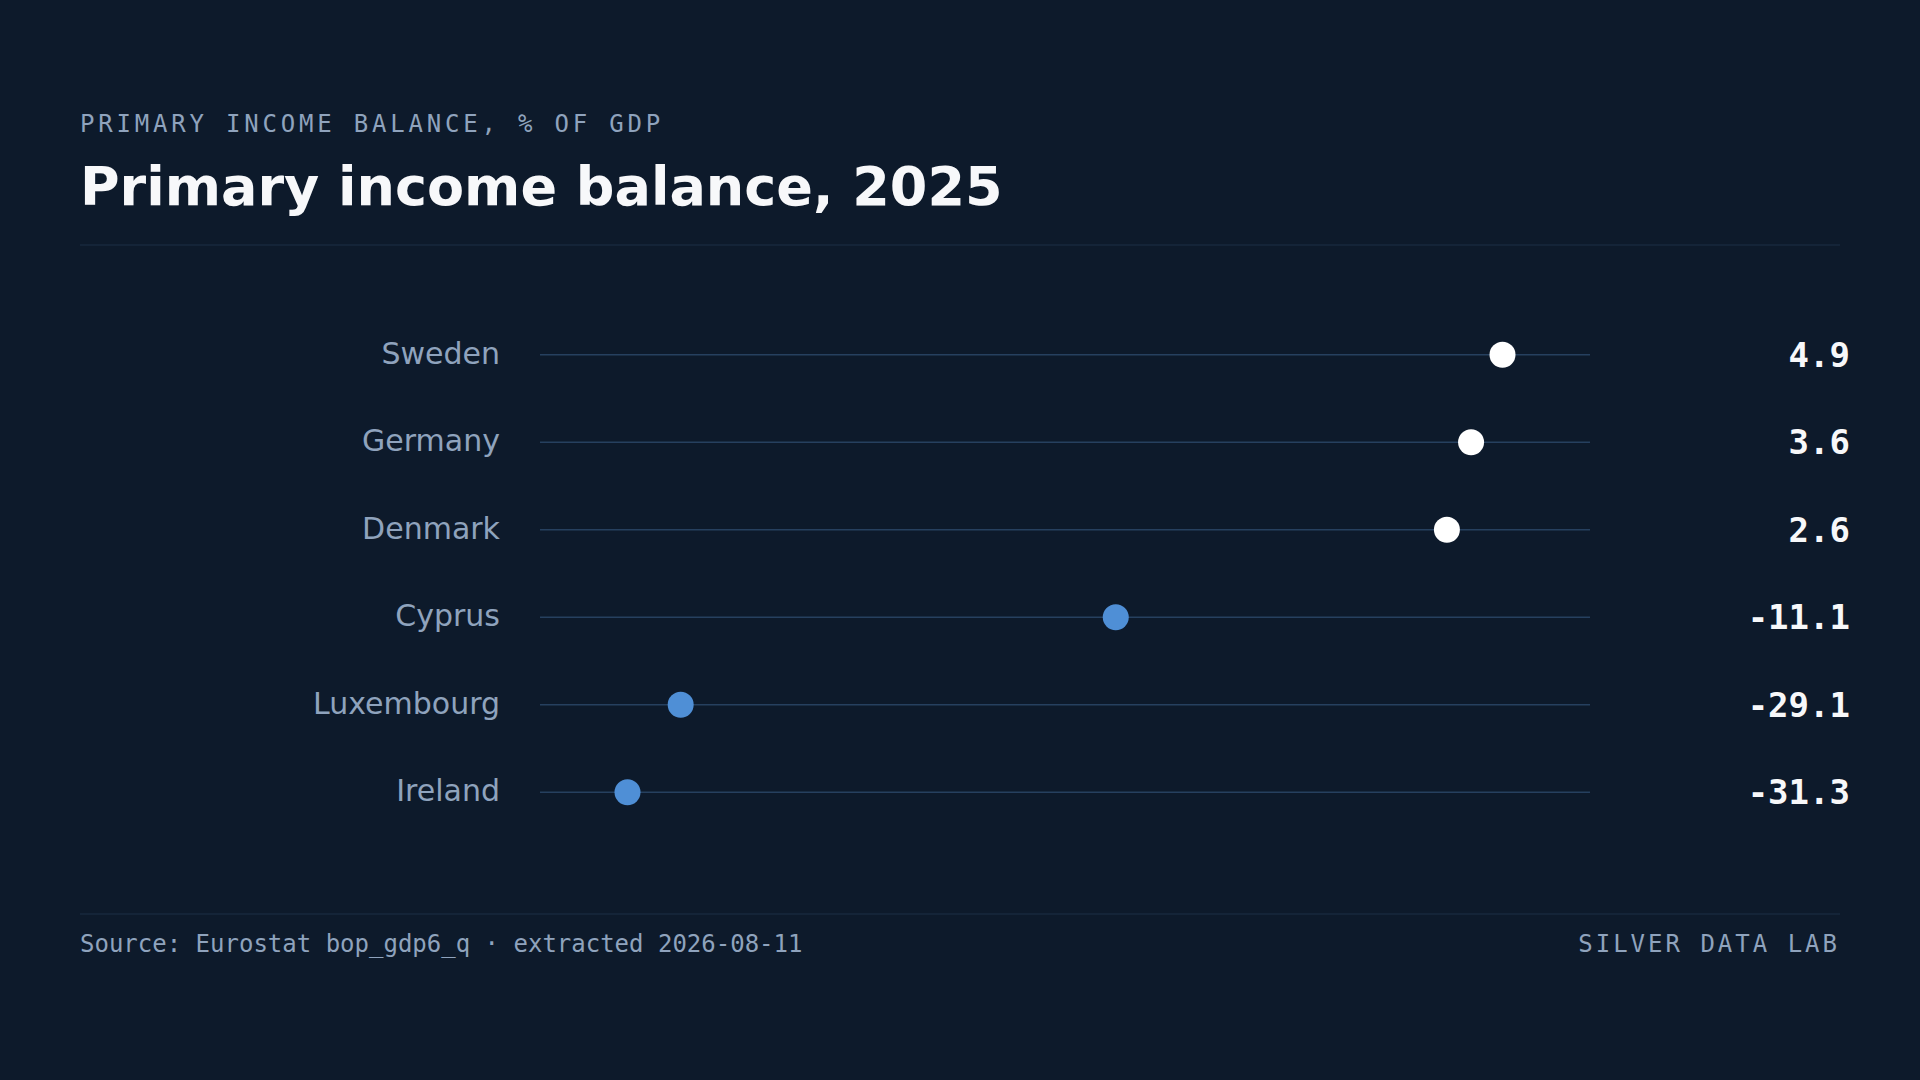
Ireland Pays Out More Income Abroad Than It Receives, a Net 28.6% of GDP
Ireland's net primary income outflow was 28.6% of GDP in 2025, second only to Luxembourg's 29.3%.
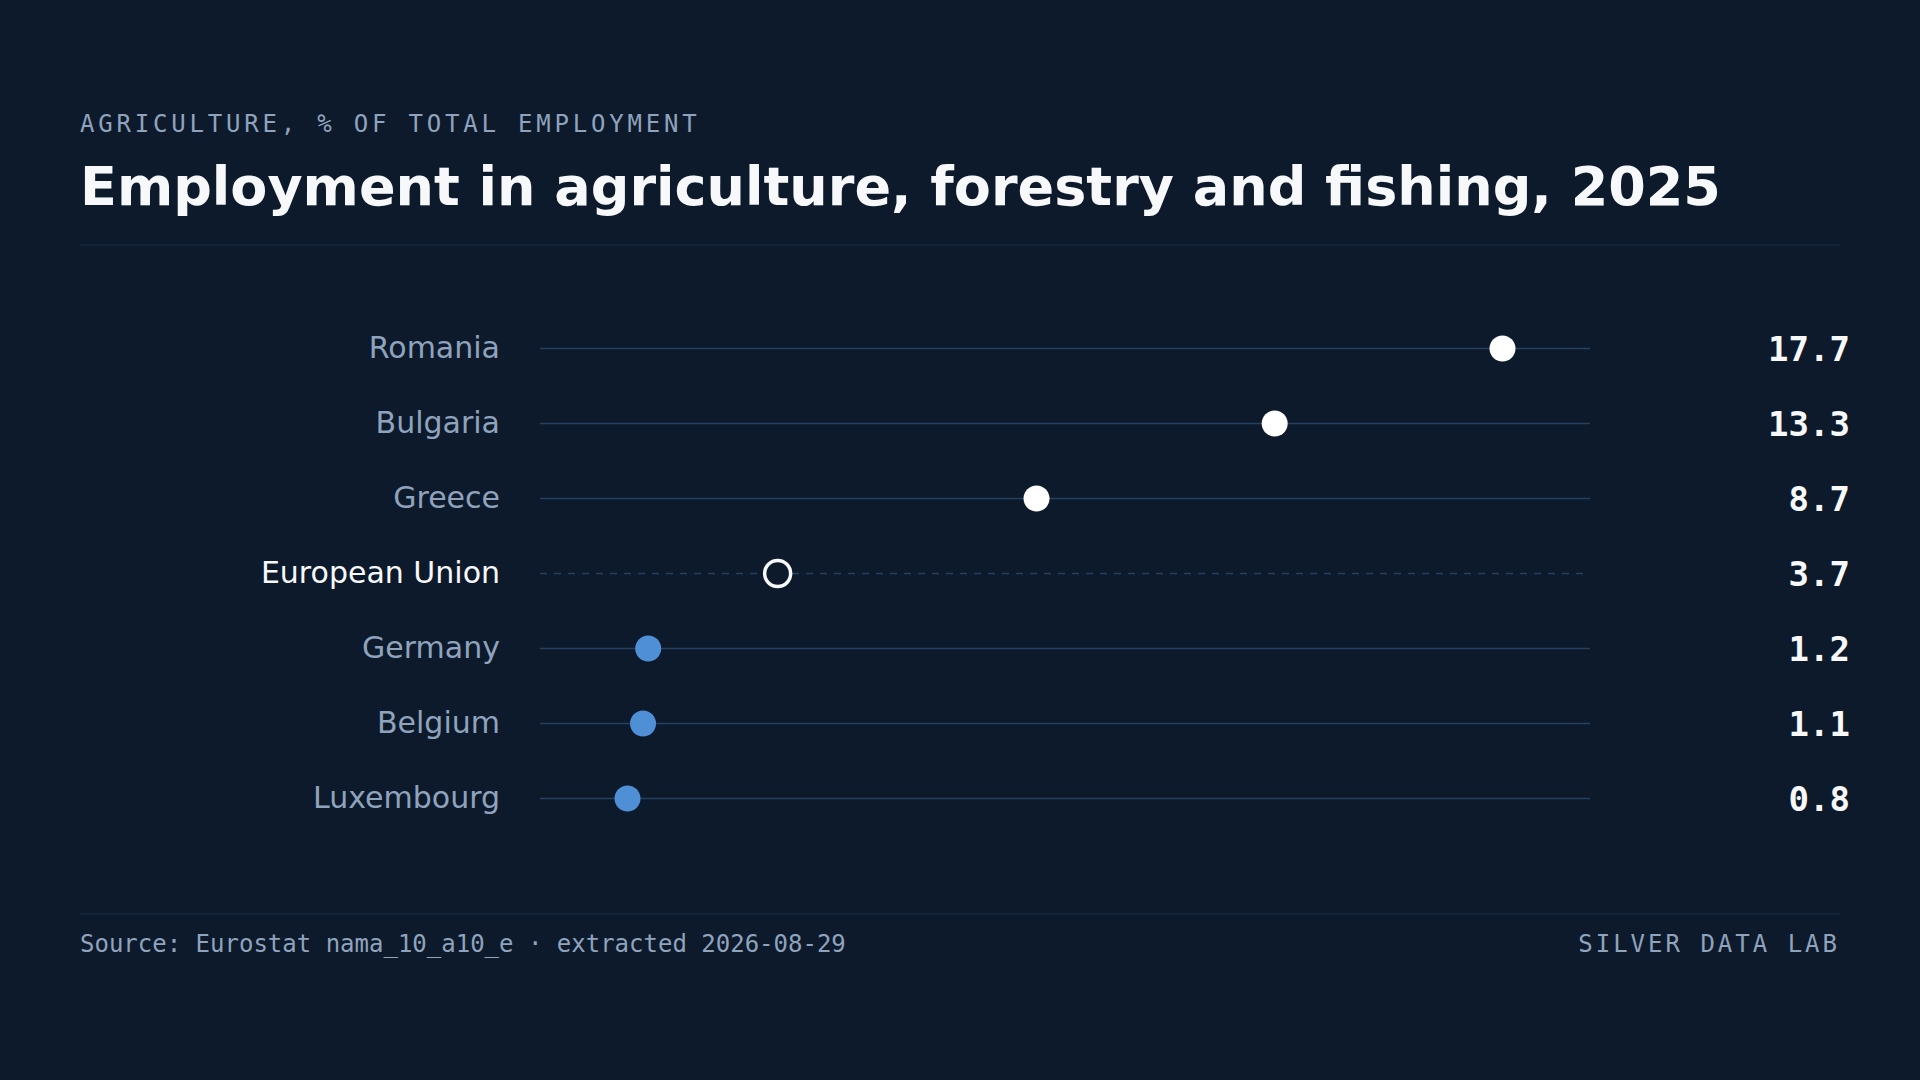
More Than One Romanian Worker in Six Works in Agriculture
Agriculture, forestry and fishing employed 3.8% of workers in the EU in 2025 and produced 1.8% of its gross value added.
Studies where the same country leads or trails
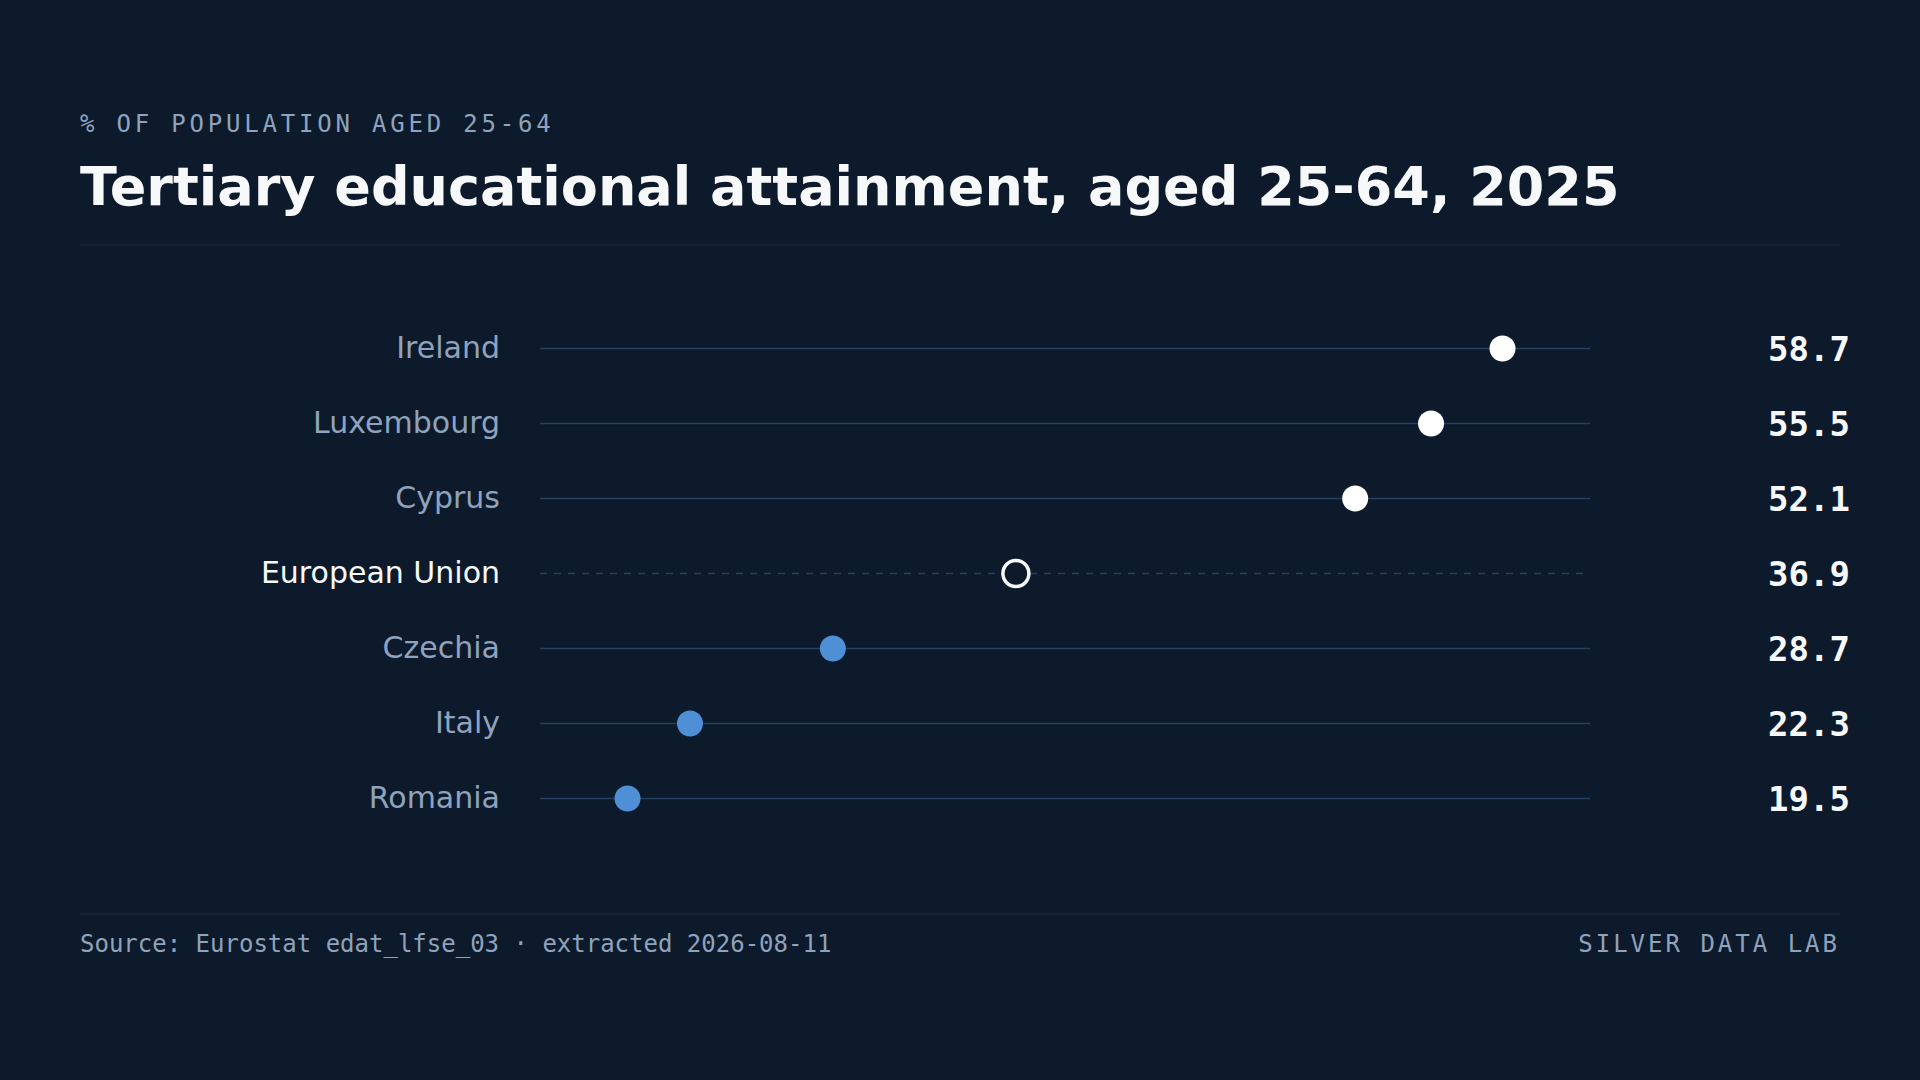
A Degree Is Three Times as Common Among Adults in Ireland as in Romania
36.9% of people aged 25 to 64 in the EU held a tertiary qualification in 2025.
Deaths Outnumber Births in Twenty-One EU Countries
The EU recorded 7.7 births and 10.7 deaths per thousand inhabitants in 2025: a natural change of −3.0.
In Luxembourg, Women Are Paid More Than Men
Women in the EU earned 11.1% less per hour than men in 2024, before any adjustment for occupation or hours.