The EU's Highest Unemployment Is in Its Territories Outside Europe
Silver Data Lab Research Desk · Statistical analysis · Published on 03 July 2026
- Data source
- Eurostat
- Reference period
- 2025
- Last updated
- 11 October 2026
Re-checked against the source on 11 September 2026. No value in its datasets has moved between the snapshots we hold. Every revision we have observed →
Key estimates
- Unemployment among people aged 20 to 64 averaged 5.8% across the EU in 2025.
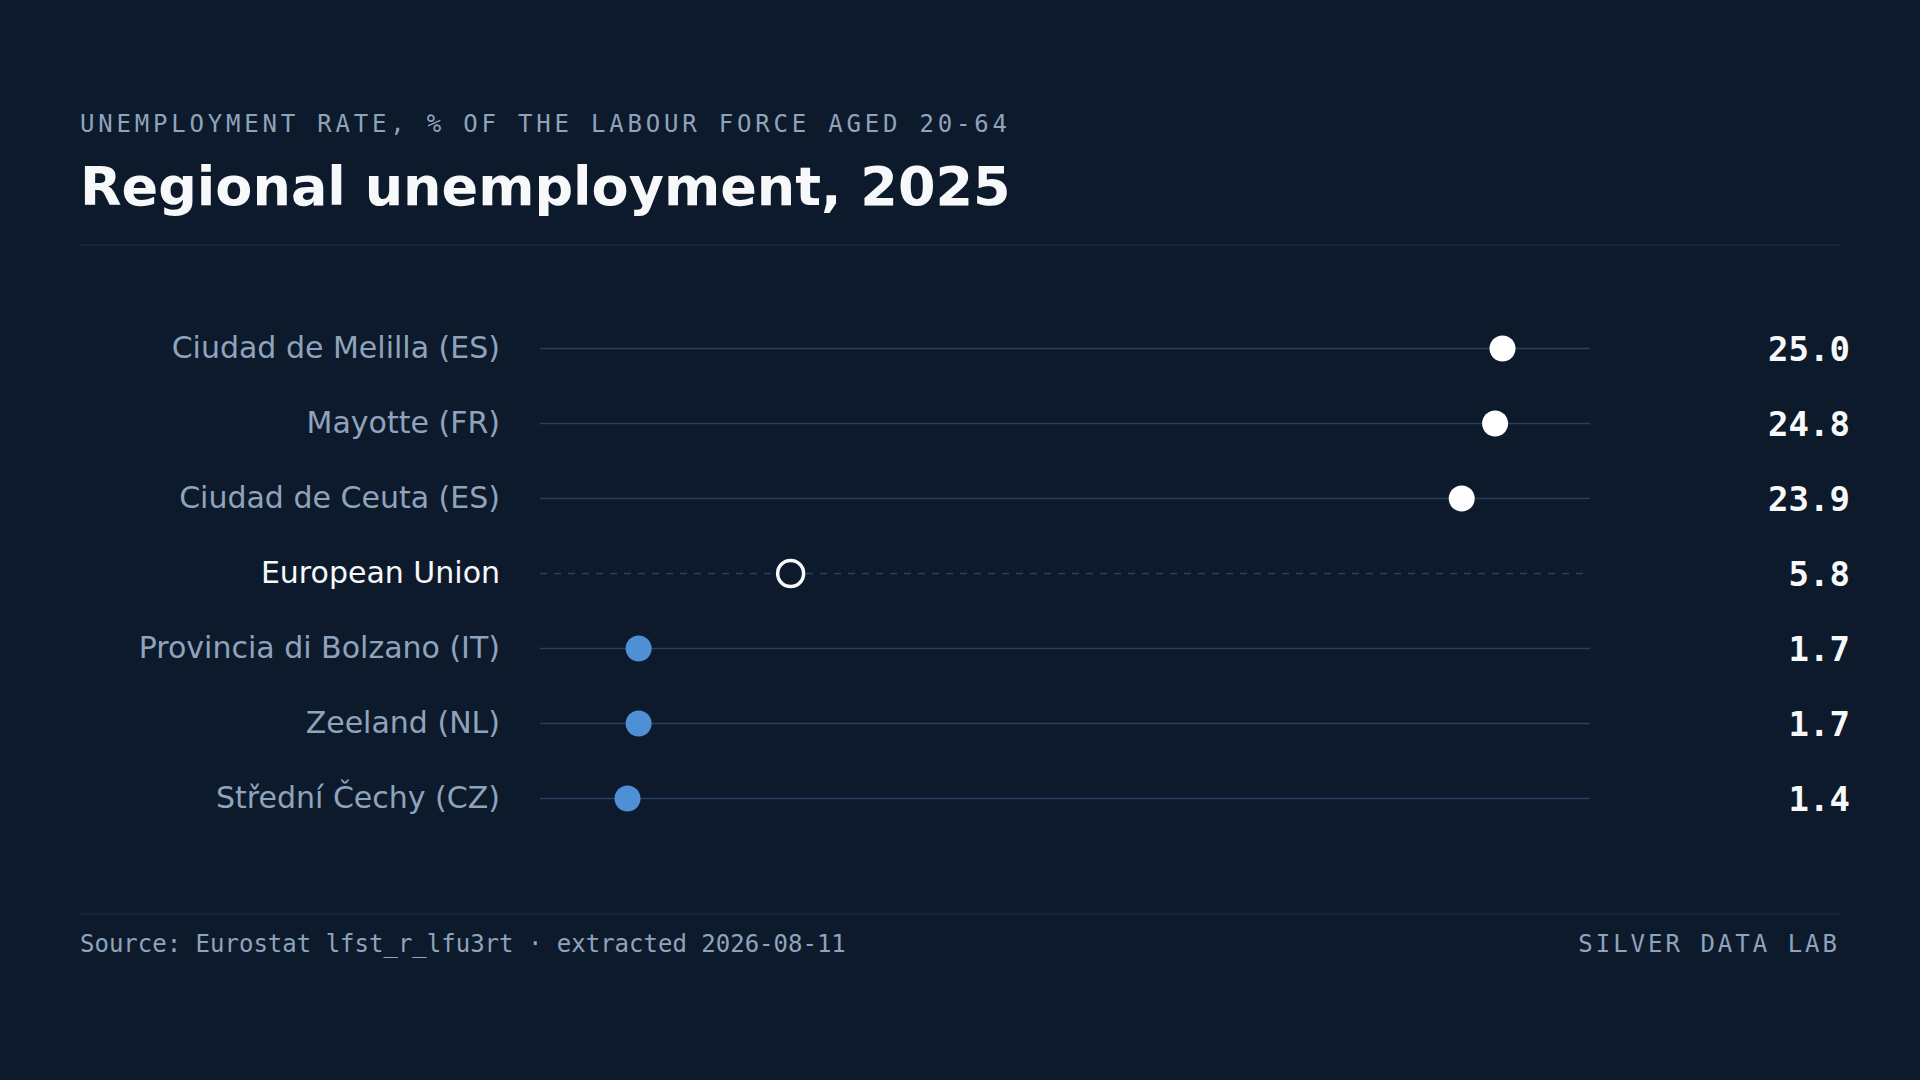
- Ciudad de Melilla records 25.0%, Mayotte 24.8% and Ciudad de Ceuta 23.9%.
- Střední Čechy in Czechia records 1.4%, the lowest of 241 EU regions with data.
- Thirty-five regions are below 3% and seven are above 15% — and six of those seven lie outside continental Europe.
- Bucureşti-Ilfov records 1.8% while Romania's north-east is far higher — the same country contains near-full employment and its opposite.
A national rate is an average of very different places
Unemployment is usually reported by country. Counted region by region on the EU's statistical map — the NUTS 2 level — there are 241 regions with published rates for 2025, and the spread between them is roughly eighteen to one.
The EU average was 5.8%. The regional figures run from 25.0% to 1.4%.
The extremes are not on the mainland
The three highest rates belong to Ciudad de Melilla at 25.0%, Mayotte at 24.8% and Ciudad de Ceuta at 23.9%.
Melilla and Ceuta are Spanish cities on the North African coast; Mayotte is a French overseas department in the Indian Ocean. All three are small, geographically separated from the economies they belong to, and each is an administrative region in its own right.
The pattern holds below them. Guyane at 16.7%, Guadeloupe at 16.4% and La Réunion at 15.6% are fourth, fifth and sixth, and all three are French overseas departments as well. The first region on the European mainland is Dytiki Makedonia in northern Greece, seventh at 15.3%: of the seven regions above 15%, six lie outside continental Europe.
That matters for how the ranking is read. The worst unemployment in the European Union is not a feature of southern Spain or southern Italy in the way headline comparisons usually suggest; it is concentrated in a handful of small territories whose economies are structurally detached from the mainland.
Mayotte also carries the caveat this site applies to it consistently: it is covered by a separate annual survey and its figures are not fully comparable with the rest.
Where work is easiest to find
Střední Čechy in Czechia records 1.4%, Zeeland in the Netherlands 1.7% and the autonomous province of Bolzano in Italy 1.7%.
Thirty-five of the 241 regions are below 3% — a level normally treated as full employment. They are concentrated in Czechia, Poland, the Netherlands, Germany and northern Italy.
Bolzano at 1.7% inside Italy is the observation worth pausing on. Italy contains regions at both ends of the European distribution, and a national Italian unemployment rate averages them into a figure that describes neither.
The Romanian split
Bucureşti-Ilfov records 1.8%, among the lowest in the Union.
Romania also has the Union's highest NEET rate and the largest share of its workforce in low-productivity agriculture, both covered separately here. A capital region at near-full employment coexists with a countryside where a great many working-age people are outside the labour force entirely.
That is the limitation of an unemployment rate stated plainly: it counts people looking for work, and a region where people have stopped looking records a low rate for the wrong reason. Regional unemployment should be read next to regional employment rates, never instead of them.
What the distribution implies
Seven regions above 15% and thirty-five below 3% is not a distribution around a common European average. It is two populations of regions with very little between them at either tail.
Labour market policy set at national level acts on averages that, in several Member States, correspond to no actual region.
Regional unemployment, 2025
| Country | % of the labour force aged 20-64 | Gap to EU averagepercentage points, derived |
|---|---|---|
| Ciudad de Melilla (ES) | 25.0d | +19.2 |
| Mayotte (FR) | 24.8d | +19.0 |
| Ciudad de Ceuta (ES) | 23.9d | +18.1 |
| European Unionaggregate | 5.8 | — |
| Provincia di Bolzano (IT) | 1.7 | −4.1 |
| Zeeland (NL) | 1.7 | −4.1 |
| Střední Čechy (CZ) | 1.4 | −4.4 |
Flags carried by the source on these values: d definition differs
This table as data: CSV · JSON
Every Member State for this indicator+
Members see every Member State for this indicator here, not only the rows the ranking prints. Become a Member
Embed this chart
Paste this code into a page. The frame carries the source and the extraction date, and links back to the study.
What these figures cannot tell you
- Unemployment counts only those looking for work
- A region where people have withdrawn from the labour market records a low rate for a bad reason. This measure must be read alongside employment rates, and in Romania in particular the two point different ways.
- The extremes are small territories
- The six regions above 15% other than Dytiki Makedonia — Melilla, Ceuta, Mayotte, Guyane, Guadeloupe and La Réunion — have small populations and economies detached from their mainlands. Their rates are correct but describe unusual cases rather than the mainland pattern that headline comparisons imply.
- Mayotte is surveyed separately
- Mayotte is covered by a separate annual survey and carries a definition-differs flag. Its figures are not fully comparable with the other regions in this ranking.
- Region of residence, not of work
- Regional labour force data is compiled by region of usual residence. Someone unemployed in a commuter region is counted there rather than where they last worked or are seeking work.
Frequently asked questions
- Which EU region has the highest unemployment?
- Ciudad de Melilla, a Spanish city on the North African coast, at 25.0% in 2025. Mayotte at 24.8% and Ciudad de Ceuta at 23.9% follow. The Union's worst unemployment is concentrated in small territories detached from their mainland economies rather than in mainland southern Europe.
- Which EU region has the lowest unemployment?
- Střední Čechy in Czechia, at 1.4% in 2025, with Zeeland in the Netherlands and the province of Bolzano in Italy at 1.7%. Thirty-five of the 241 EU regions are below 3%.
- How much does unemployment vary within the EU?
- From 1.4% to 25.0% across NUTS 2 regions, a spread of roughly eighteen to one, against an EU average of 5.8%. Seven regions are above 15% and thirty-five below 3%.
- Does a low regional unemployment rate mean a strong labour market?
- Not always. Unemployment counts people actively looking for work, so a region where many have stopped looking records a low rate for a bad reason. Bucureşti-Ilfov records 1.8% while Romania has the Union's highest share of young people not in employment, education or training.
Methodological note
Eurostat publishes unemployment rates by NUTS 2 region from the EU labour force survey. This study uses the rate for the population aged 20 to 64, both sexes, all education levels.
Values are for 2025, covering 241 EU NUTS 2 regions with published values. The dataset also contains regions of candidate and EFTA countries, which are excluded here.
The counts of regions above 15% and below 3% are derived by Silver Data Lab from the published rates. The comparisons with NEET rates and agricultural employment draw on companion studies on this site.
Source data
The underlying series can be inspected and re-downloaded from the Eurostat data browser. The filters below are the ones applied.
Unemployment rates by NUTS 2 region
lfst_r_lfu3rt
- Filters applied:
- freq=A · sex=T · age=Y20-64 · isced11=TOTAL · unit=PC · time=2025
- Extracted:
- 2026-09-11
- Source last updated:
- 2026-09-10
Download the data
The data the study you have just read is built on, exactly as it was downloaded and archived.
Yours as a Member.
Data downloadable by Members
How to cite
Record the vintage as well as the study: the figures on this page are the ones extracted on the dates below.
Silver Data Lab Research Desk (2026). The EU's Highest Unemployment Is in Its Territories Outside Europe. Silver Data Lab, published 03 July 2026, last updated 11 October 2026. https://www.silverdatalab.com/studies/regional-unemployment-in-the-eu
- Data: Eurostat, Unemployment rates by NUTS 2 region (lfst_r_lfu3rt), filters freq=A, sex=T, age=Y20-64, isced11=TOTAL, unit=PC, time=2025; extracted 2026-09-11; source last updated 2026-09-10. https://doi.org/10.2908/lfst_r_lfu3rt
Silver Data Lab's analysis is licensed CC BY 4.0. The statistics remain their publisher's and keep its terms of reuse.
Ask the research desk
A question about this study — a definition, a filter, a break in the series, what the figures can and cannot support — answered by the desk that made the extraction.
Members can write to the research desk