Three EU Countries Import More Than Their Entire Economies Produce
Silver Data Lab Research Desk · Statistical analysis · Published on 11 August 2026
- Data source
- Eurostat
- Reference period
- 2025
- Last updated
- 21 October 2026
Re-checked against the source on 23 October 2026. 81 values in its datasets moved between snapshots, 12 of them figures stated on this page. Every revision we have observed →
Key estimates
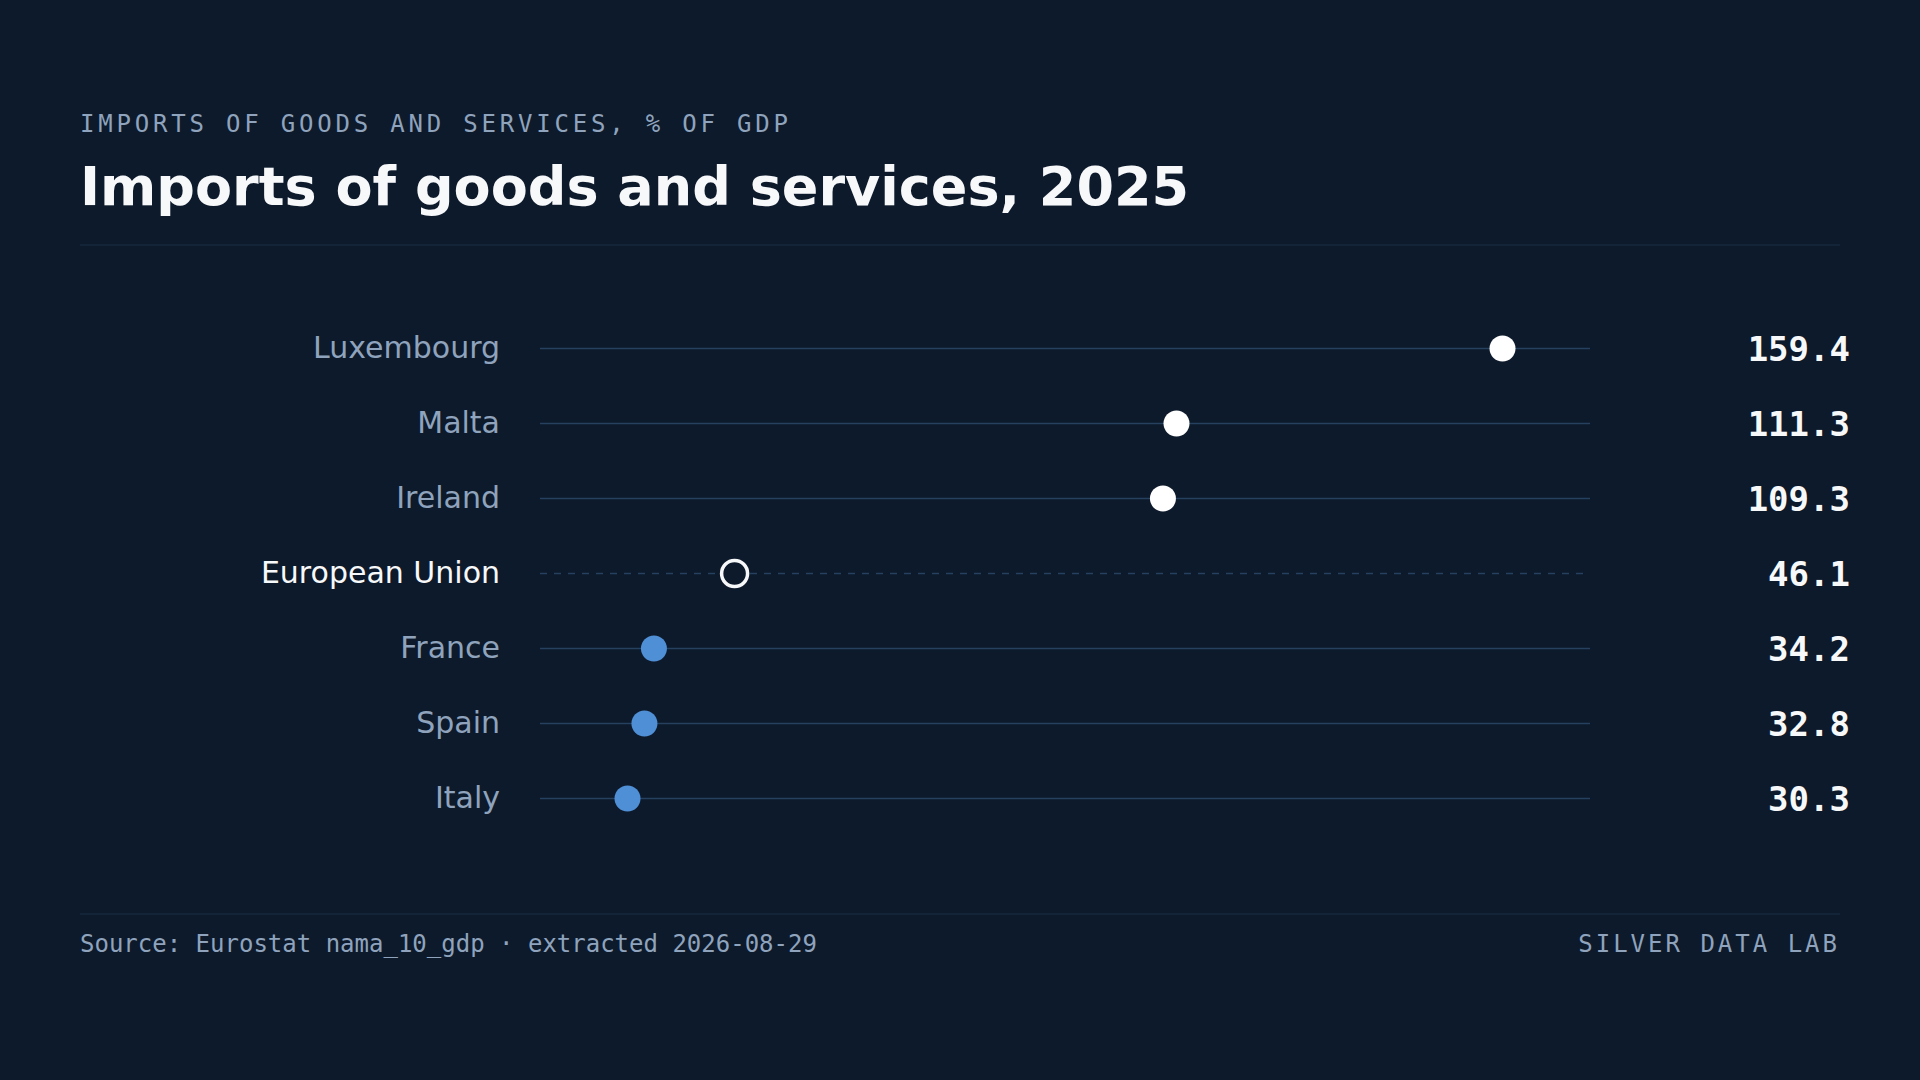
- Imports of goods and services into the 27 Member States equalled 46.1% of their combined GDP in 2025.
- Luxembourg imports 170.6% of its GDP, Malta 111.3% and Ireland 109.3% — all three more than they produce.
- Italy records 30.2%, Spain 32.6% and France 34.2%.
- Nineteen Member States import more relative to their economies than the EU figure.
- Germany at 37.9% is below the EU figure, as are all four of the Union's largest economies.
The other half of trade openness
The international trade category on this site reports exports as a share of GDP and finds that the Union's four largest economies are all among its six least open. Imports were worth checking rather than assuming, and they give a sharper result: the same four economies are the four lowest in the Union.
Across the 27 Member States, imports of goods and services equalled 46.1% of combined GDP in 2025.
Above 100%
Luxembourg imports 170.6% of its GDP, Malta 111.3% and Ireland 109.3%.
As with exports, ratios above 100% are arithmetically sound. Imports are counted at their full value while GDP counts only value added, so goods arriving, being lightly processed and leaving again enter the import figure at full price and the GDP figure at the margin.
Ireland's position has a second cause specific to it. Irish pharmaceutical and technology operations import inputs and intellectual property services at very large values, and the same activity that inflates Irish GDP inflates Irish imports.
The largest economies at the bottom
Italy records 30.2%, Spain 32.6%, France 34.2% and Germany 37.9%. All four are below the EU figure of 46.1%.
The explanation is the one that applies to exports. A large economy contains more of its own supply chain, so a smaller share of what it consumes crosses a border. An Italian firm buying components from another Italian firm records no import; a Slovak firm buying the same components from Austria does.
Import dependence measured this way is therefore close to an inverse measure of economic size, and it should not be read as a statement about self-sufficiency or resilience.
What it does not measure
Nothing here identifies what is imported or from whom.
A country importing 30% of GDP entirely in critical inputs from a single supplier is more exposed than one importing 60% from many suppliers across many product categories. The concentration of trade, not its volume, is what determines vulnerability, and this indicator measures only volume.
The energy import dependency study on this site measures the concentration question for one specific commodity, and produces a completely different ranking: Malta at 98.4% and Estonia at 4.6%, with Italy above the EU average rather than below it.
Why the EU row is what it is
The 46.1% figure is the sum of the 27 national values, so imports from other Member States are counted in it. It describes how much cross-border buying the Union's economies do, not how much the Union buys from outside itself.
Roughly three fifths of Member States' goods exports go to other Member States, as the intra-EU study on this site reports. That study measures exports, not imports, but every sale from one Member State to another is also an import for the buyer, so trade inside the single market is part of this figure too. What the Union buys from outside itself is therefore smaller than this figure suggests, and this dataset cannot say by how much.
Imports of goods and services, 2025
| Country | % of GDP | Gap to EU totalpercentage points, derived |
|---|---|---|
| Luxembourg | 170.6 | +124.5 |
| Malta | 111.3 | +65.2 |
| Ireland | 109.3 | +63.2 |
| European Unionaggregate | 46.1 | — |
| France | 34.2 | −11.9 |
| Spain | 32.6 | −13.5 |
| Italy | 30.2 | −15.9 |
This table as data: CSV · JSON
Every Member State for this indicator+
Members see every Member State for this indicator here, not only the rows the ranking prints. Become a Member
Embed this chart
Paste this code into a page. The frame carries the source and the extraction date, and links back to the study.
What these figures cannot tell you
- Gross imports against value added
- Imports are counted at full value while GDP counts only value added. Any economy that imports, processes lightly and re-exports records a high ratio, which is why three Member States exceed 100%.
- The EU figure is not consolidated
- The 46.1% shown for the Union is the sum of national imports and includes trade between Member States. Only part of those imports comes from outside the Union, and the national accounts used here do not say which part.
- Volume, not concentration
- The indicator measures how much a country imports, not what or from whom. Exposure to supply disruption depends on concentration of suppliers and criticality of products, neither of which appears here.
- Eleven of the national figures are provisional
- Eurostat publishes the 2025 national accounts of Belgium, Cyprus, Germany, Greece, Spain, France, Croatia, Hungary, Luxembourg, Portugal and Romania as provisional, on the import series and the GDP series alike. Luxembourg at the top of this ranking and France and Spain at the bottom are among them, so three of the six national rows shown here may move when the year is finalised. The EU figure is not flagged.
- Tracks economic size
- A larger economy contains more of its own supply chain, so this ranking is close to an inverse ranking of size. It is weak evidence about self-sufficiency or trade policy.
Frequently asked questions
- How much does the EU import?
- Imports of goods and services into the 27 Member States equalled 46.1% of their combined GDP in 2025. That figure includes imports from other Member States, so it is not the Union's dependence on the rest of the world.
- Which EU country imports the most?
- Luxembourg, at 170.6% of GDP, followed by Malta at 111.3% and Ireland at 109.3% — all three import more than they produce. Imports are counted at full value while GDP counts only value added, which makes ratios above 100% possible.
- Which EU country imports the least?
- Italy at 30.2% of GDP, Spain at 32.6% and France at 34.2%. All four of the Union's largest economies, Germany included, are below the EU figure, because a large economy contains more of its own supply chain.
- Does a low import ratio mean a country is more self-sufficient?
- Not usefully. The ratio largely tracks economic size, and it measures volume rather than concentration. A country importing less overall but depending on a single supplier for a critical input is more exposed than one importing more from many sources.
Methodological note
Imports of goods and services and gross domestic product are both taken from Eurostat's annual national accounts at current prices in millions of euro. The import ratio is computed here as imports divided by GDP for each Member State and for the EU aggregate.
Values are for 2025 and cover all 27 Member States. Eurostat's observation flags are read from the same extraction: eleven Member States are published as provisional on both series, and the EU aggregate is not.
The ratio itself, the count of Member States above the EU figure, and the comparison between the four largest economies and the rest are derived by Silver Data Lab from the two published series and are labelled as derived. The comparisons with export openness, intra-EU trade and energy import dependency draw on companion studies on this site.
Source data
The underlying series can be inspected and re-downloaded from the Eurostat data browser. The filters below are the ones applied.
GDP and main components (output, expenditure and income)
nama_10_gdp
- Filters applied:
- freq=A · na_item=P7, B1GQ · unit=CP_MEUR · time=2025
- Extracted:
- 2026-10-23
- Source last updated:
- 2026-10-22
Download the data
The data the study you have just read is built on, exactly as it was downloaded and archived.
Yours as a Member.
Data downloadable by Members
How to cite
Record the vintage as well as the study: the figures on this page are the ones extracted on the dates below.
Silver Data Lab Research Desk (2026). Three EU Countries Import More Than Their Entire Economies Produce. Silver Data Lab, published 11 August 2026, last updated 21 October 2026. https://www.silverdatalab.com/studies/import-dependence-in-the-eu
- Data: Eurostat, GDP and main components (output, expenditure and income) (nama_10_gdp), filters freq=A, na_item=P7, B1GQ, unit=CP_MEUR, time=2025; extracted 2026-10-23; source last updated 2026-10-22. https://doi.org/10.2908/nama_10_gdp
Silver Data Lab's analysis is licensed CC BY 4.0. The statistics remain their publisher's and keep its terms of reuse.
Ask the research desk
A question about this study — a definition, a filter, a break in the series, what the figures can and cannot support — answered by the desk that made the extraction.
Members can write to the research desk
Other studies on the same dataset
Studies where the same country leads or trails
Bulgaria's GDP per Person Is About a Third of the EU Average
EU real GDP per capita was 34,250 euro in 2025, at 2020 prices.
Employment Rates Vary Far More Between EU Regions Than Between Countries
76.1% of people aged 20 to 64 were in employment across the EU in 2025, or 197.8 million people — the highest reading since the series began in 2009.
EU Countries Sell 61.1% of Their Goods Exports to Each Other
61.1% of the goods exported by EU Member States in 2025 went to other Member States.