A Bulgarian Worker Produces Less Than Half as Much as a Belgian
Silver Data Lab Research Desk · Statistical analysis · Published on 07 August 2026
This study is open to members only
Its sources, filters and extraction date are declared above, as they are for every study. Sign in to read the analysis in full.
- Data source
- Eurostat
- Reference period
- 2025
- Last updated
- 22 October 2026
Re-checked against the source on 23 October 2026. 87 values in its datasets moved between snapshots, 16 of them figures stated on this page. Every revision we have observed →
Key estimates
- Labour productivity per person employed is indexed to an EU average of 100.
- Ireland records 211.8, Luxembourg 156.3 and Belgium 129.1.
- Bulgaria records 59.4, Greece 66.7 and Latvia 70.1.
- Excluding Ireland and Luxembourg, the range runs from 129.1 to 59.4 — a ratio of 2.2 to one.
- Greece has the Union's second-slowest unit labour cost growth, after Cyprus, and its second-lowest productivity, which are two descriptions of the same economy.
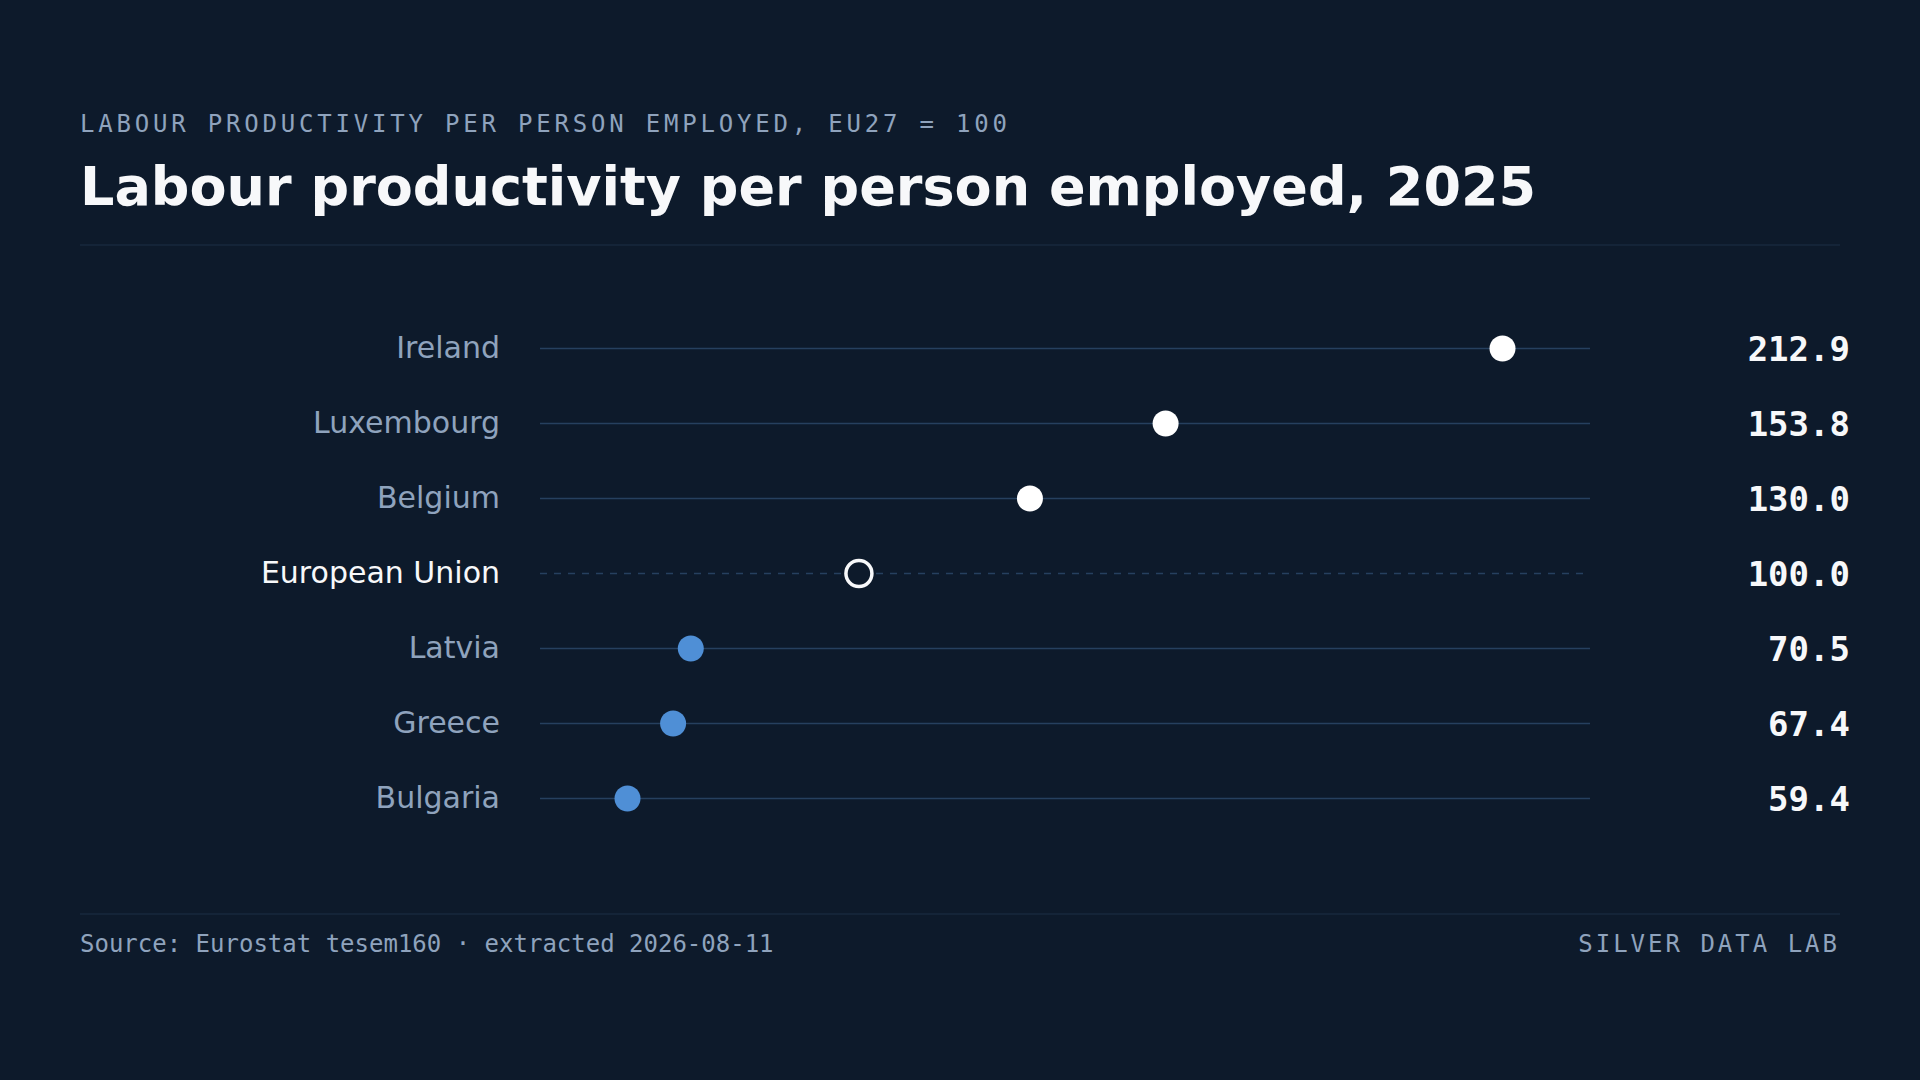
Output per worker, in purchasing power
Labour productivity here is gross domestic product per person employed, converted to purchasing power standards and indexed so that the EU average is 100. A country at 130 produces 30% more per worker than the European average.
It is the measure that sits underneath most of what this site records about wages, competitiveness and convergence, and it is the constraint on all of them: a country cannot sustainably pay more than its workers produce.
The two figures to discount
Ireland records 211.8 and Luxembourg 156.3.
Neither describes what workers in those countries produce. Irish GDP includes output booked by foreign-owned firms, which this site quantifies in the primary income study: in 2025 the income Ireland paid abroad exceeded the income it received by an amount equal to 28.6% of its output. Dividing an inflated numerator by Irish employment produces an inflated productivity figure.
Luxembourg's distortion runs the other way and reaches the same result. A large share of the people who work in Luxembourg live in Belgium, France or Germany. They appear in Luxembourg's output and, for some measures, not in its denominators.
Belgium at 129.1 is the highest figure in the Union that means what it appears to mean.
The genuine range
Setting Ireland and Luxembourg aside, productivity runs from Belgium at 129.1 to Bulgaria at 59.4: a ratio of 2.2 to one.
That is narrower than the gap in GDP per capita in euro, which is 9.0 to one, and narrower than the gap in purchasing power terms. The reason is that poorer Member States have both lower productivity and, in several cases, lower employment rates — the two compound in income per head and only one of them appears here.
Denmark, Austria, Sweden and France cluster between 105 and 120, with Germany a little below them at 103.4. The productivity differences among the large western economies are small.
Greece
Greece records 66.7, second from bottom.
The unit labour cost study on this site reports Greece with the second-slowest cost growth in the Union, after Cyprus: 110.6 against a 2020 base of 100, against an EU average of 119.1. Read as competitiveness that is the second-best result in the Union.
Both facts describe one economy. Greek labour is cheap relative to European labour because Greek output per worker is low, and the internal devaluation after 2010 lowered the price without raising the output. Cost competitiveness achieved by suppressing pay rather than raising productivity leaves a country competitive and poor at the same time, and Greece is the European case study in it.
Why this is the constraint
Almost every convergence question on this site reduces to this indicator.
Wages can converge only as fast as productivity, or unit labour costs rise and competitiveness erodes — which is what the fast-converging Member States are currently experiencing. Living standards can rise sustainably only as fast as output per worker. Public services can be funded only from what is produced.
A ratio of 2.2 to one in output per worker, inside a single market with free movement of capital and labour, is the measurement of how far European economic convergence still has to run.
Labour productivity per person employed, 2025
| Country | index, EU27 = 100 | Gap to EU averagederived |
|---|---|---|
| Ireland | 211.8 | +111.8 |
| Luxembourg | 156.3p | +56.3 |
| Belgium | 129.1p | +29.1 |
| European Unionaggregate | 100.0 | — |
| Latvia | 70.1 | −29.9 |
| Greece | 66.7p | −33.3 |
| Bulgaria | 59.4 | −40.6 |
Flags carried by the source on these values: p provisional
This table as data: CSV · JSON
Every Member State for this indicator+
Members see every Member State for this indicator here, not only the rows the ranking prints. Become a Member
What these figures cannot tell you
- Ireland and Luxembourg are not comparable
- Irish output includes production booked by foreign-owned firms and Luxembourg's is produced substantially by cross-border workers. Neither index describes what resident workers produce, and both should be excluded from any comparison of underlying productivity.
- Per person, not per hour
- This measure divides output by people employed, not by hours worked. Countries with high part-time employment record lower productivity per person than per hour — among them the Netherlands, which at 38.6% has the Union's highest part-time rate.
- Productivity is not effort
- Output per worker depends on capital equipment, industrial structure and the value of what a country produces far more than on how hard people work. A country specialising in high-value activity records high productivity for that reason alone.
- Purchasing power conversion
- Figures are converted using purchasing power parities, which are estimates subject to revision. The broad ordering is robust; small differences between adjacent Member States are not.
Frequently asked questions
- Which EU country has the highest labour productivity?
- Ireland records 211.8 against an EU average of 100, but that figure reflects output booked by foreign-owned firms rather than what Irish workers produce. Belgium at 129.1 is the highest figure that describes actual production, with Luxembourg's 156.3 also distorted by cross-border commuting.
- Which EU country has the lowest?
- Bulgaria at 59.4, followed by Greece at 66.7 and Latvia at 70.1. Excluding Ireland and Luxembourg, the range across the Union is 2.2 to one.
- Why does Greece have low productivity and low costs?
- Because they are the same fact. Greek labour is cheap relative to European labour because Greek output per worker is low. The internal devaluation after 2010 reduced the price of Greek labour without raising what it produces, leaving the country cost-competitive and poor simultaneously.
- Does high productivity mean people work harder?
- No. Output per worker is determined mainly by capital equipment, industrial structure and the value of what a country produces. A country specialising in high-value activity records high productivity regardless of effort.
Methodological note
Eurostat publishes labour productivity per person employed as GDP in purchasing power standards per person employed, indexed to the EU27 average of 100.
The 2025 index covers all 27 Member States. Croatia's value, absent after Eurostat's release of 7 October, is published again in the release of 21 October.
The range excluding Ireland and Luxembourg, and the comparisons with unit labour costs, GDP per capita and the primary income balance, are derived by Silver Data Lab across companion studies on this site, each with its own extraction.
Source data
The underlying series can be inspected and re-downloaded from the Eurostat data browser. The filters below are the ones applied.
Labour productivity per person employed and hour worked
tesem160
- Filters applied:
- freq=A · unit=PC_EU27_2020_MPPS_CP · na_item=NLPR_PER · time=2025
- Extracted:
- 2026-10-23
- Source last updated:
- 2026-10-22
Download the data
The data the study you have just read is built on, exactly as it was downloaded and archived.
Yours as a Member.
Data downloadable by Members
How to cite
Record the vintage as well as the study: the figures on this page are the ones extracted on the dates below.
Silver Data Lab Research Desk (2026). A Bulgarian Worker Produces Less Than Half as Much as a Belgian. Silver Data Lab, published 07 August 2026, last updated 22 October 2026. https://www.silverdatalab.com/studies/labour-productivity-in-the-eu
- Data: Eurostat, Labour productivity per person employed and hour worked (tesem160), filters freq=A, unit=PC_EU27_2020_MPPS_CP, na_item=NLPR_PER, time=2025; extracted 2026-10-23; source last updated 2026-10-22. https://doi.org/10.2908/tesem160
Silver Data Lab's analysis is licensed CC BY 4.0. The statistics remain their publisher's and keep its terms of reuse.
Ask the research desk
A question about this study — a definition, a filter, a break in the series, what the figures can and cannot support — answered by the desk that made the extraction.
Members can write to the research desk
Studies where the same country leads or trails
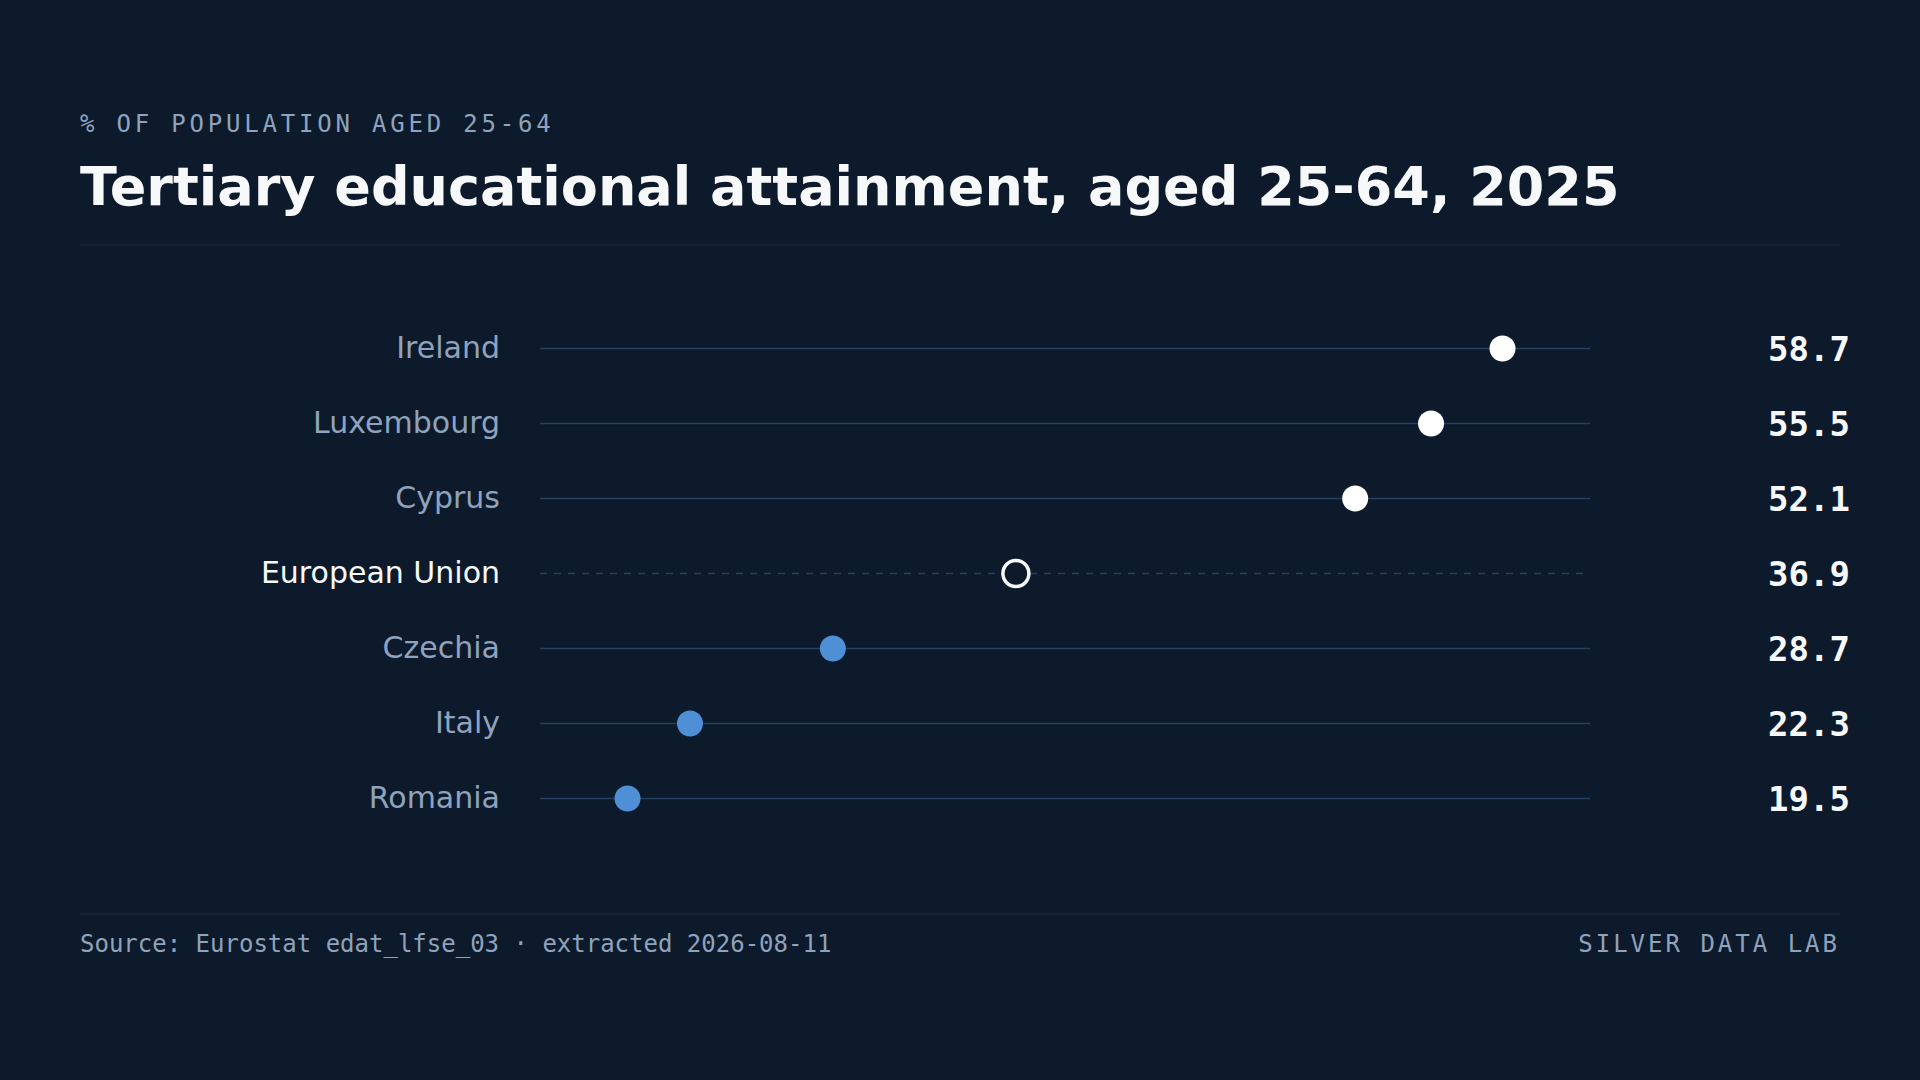
A Degree Is Three Times as Common Among Adults in Ireland as in Romania
36.9% of people aged 25 to 64 in the EU held a tertiary qualification in 2025.
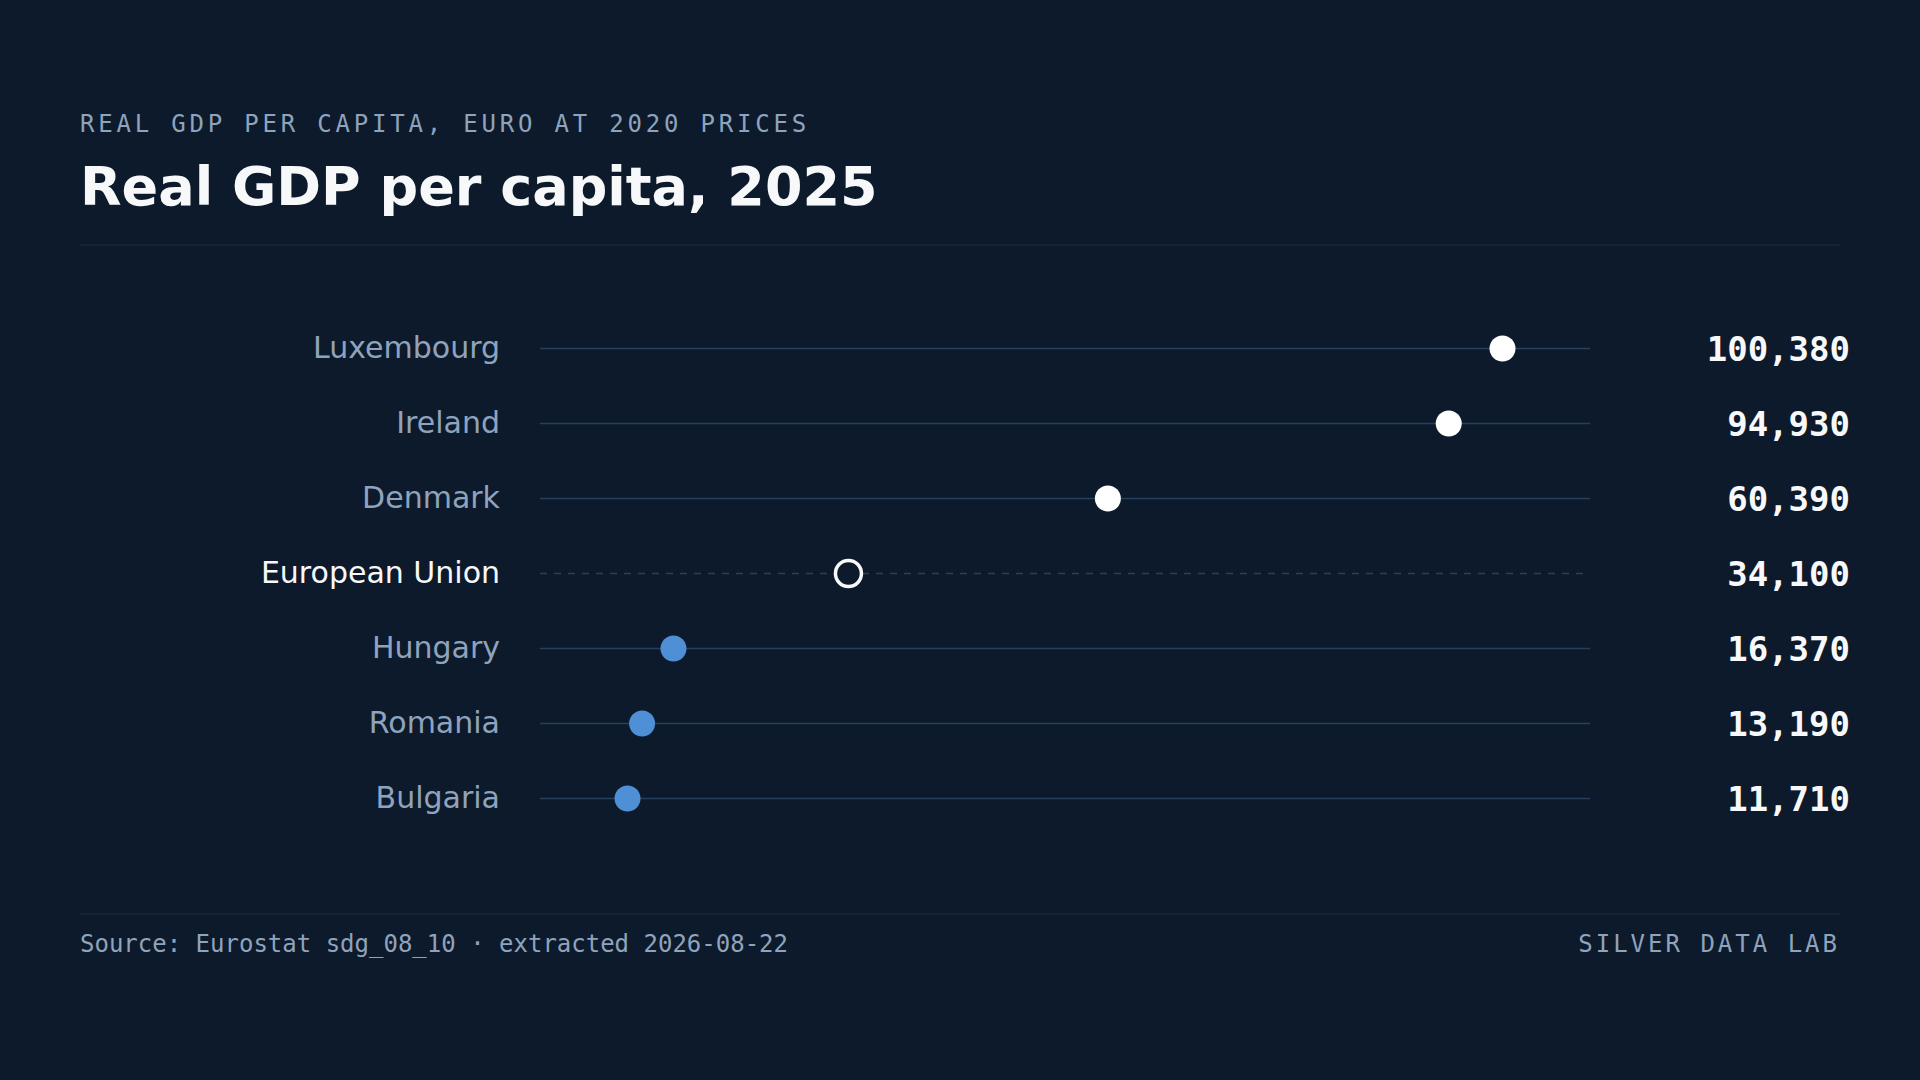
Bulgaria's GDP per Person Is About a Third of the EU Average
EU real GDP per capita was 34,250 euro in 2025, at 2020 prices.
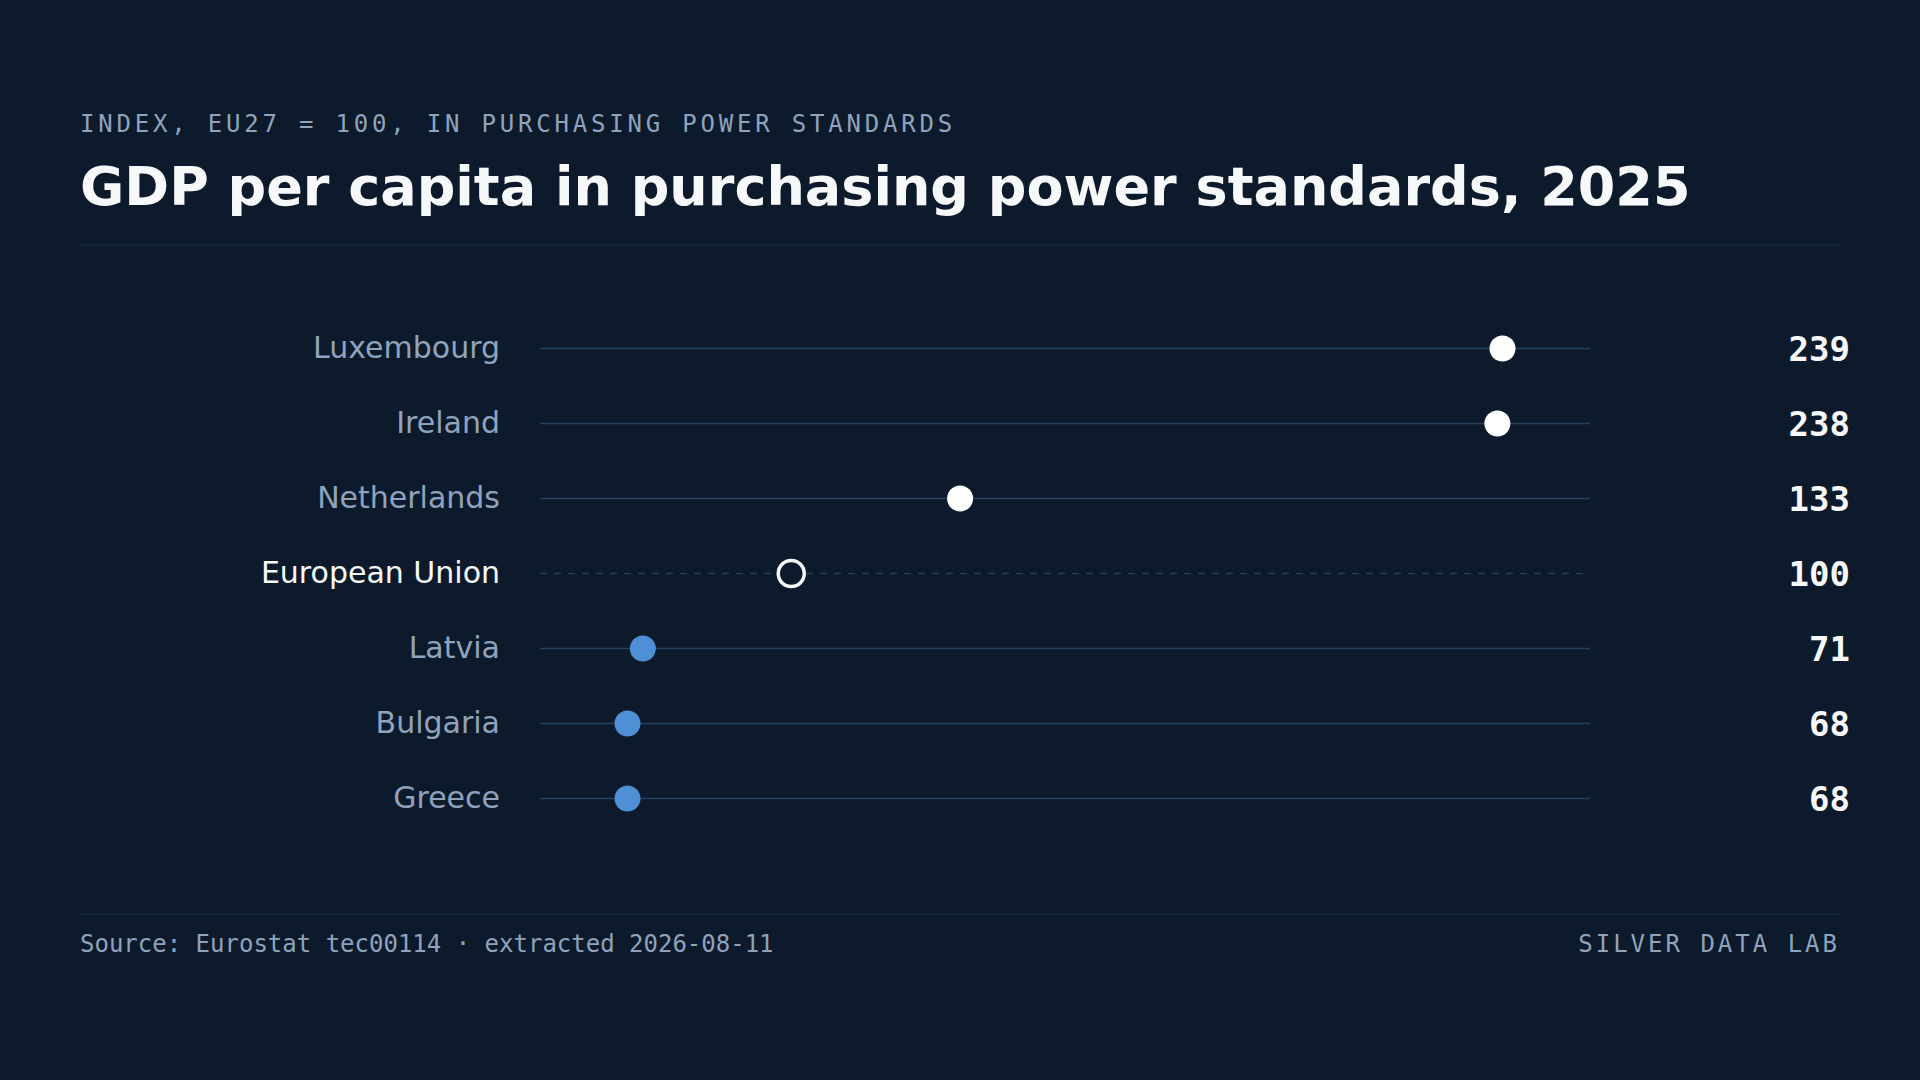
GDP per Head Makes Luxembourg and Ireland Look Richer Than They Are
Luxembourg records 239 and Ireland 238 against an EU average of 100 — more than double the Union's output per head.