A Third of the EU's Unemployed Have Been Out of Work for a Year or More
Silver Data Lab Research Desk · Statistical analysis · Published on 14 June 2026
- Data source
- Eurostat
- Reference period
- 2025
- Last updated
- 11 October 2026
Re-checked against the source on 11 September 2026. No value in its datasets has moved between the snapshots we hold. Every revision we have observed →
Key estimates
- 33.2% of unemployed people aged 20 to 64 in the EU had been out of work for twelve months or more in 2025 — 4.0 million people.
- More than half of them, 2.1 million, had been out of work for at least two years.
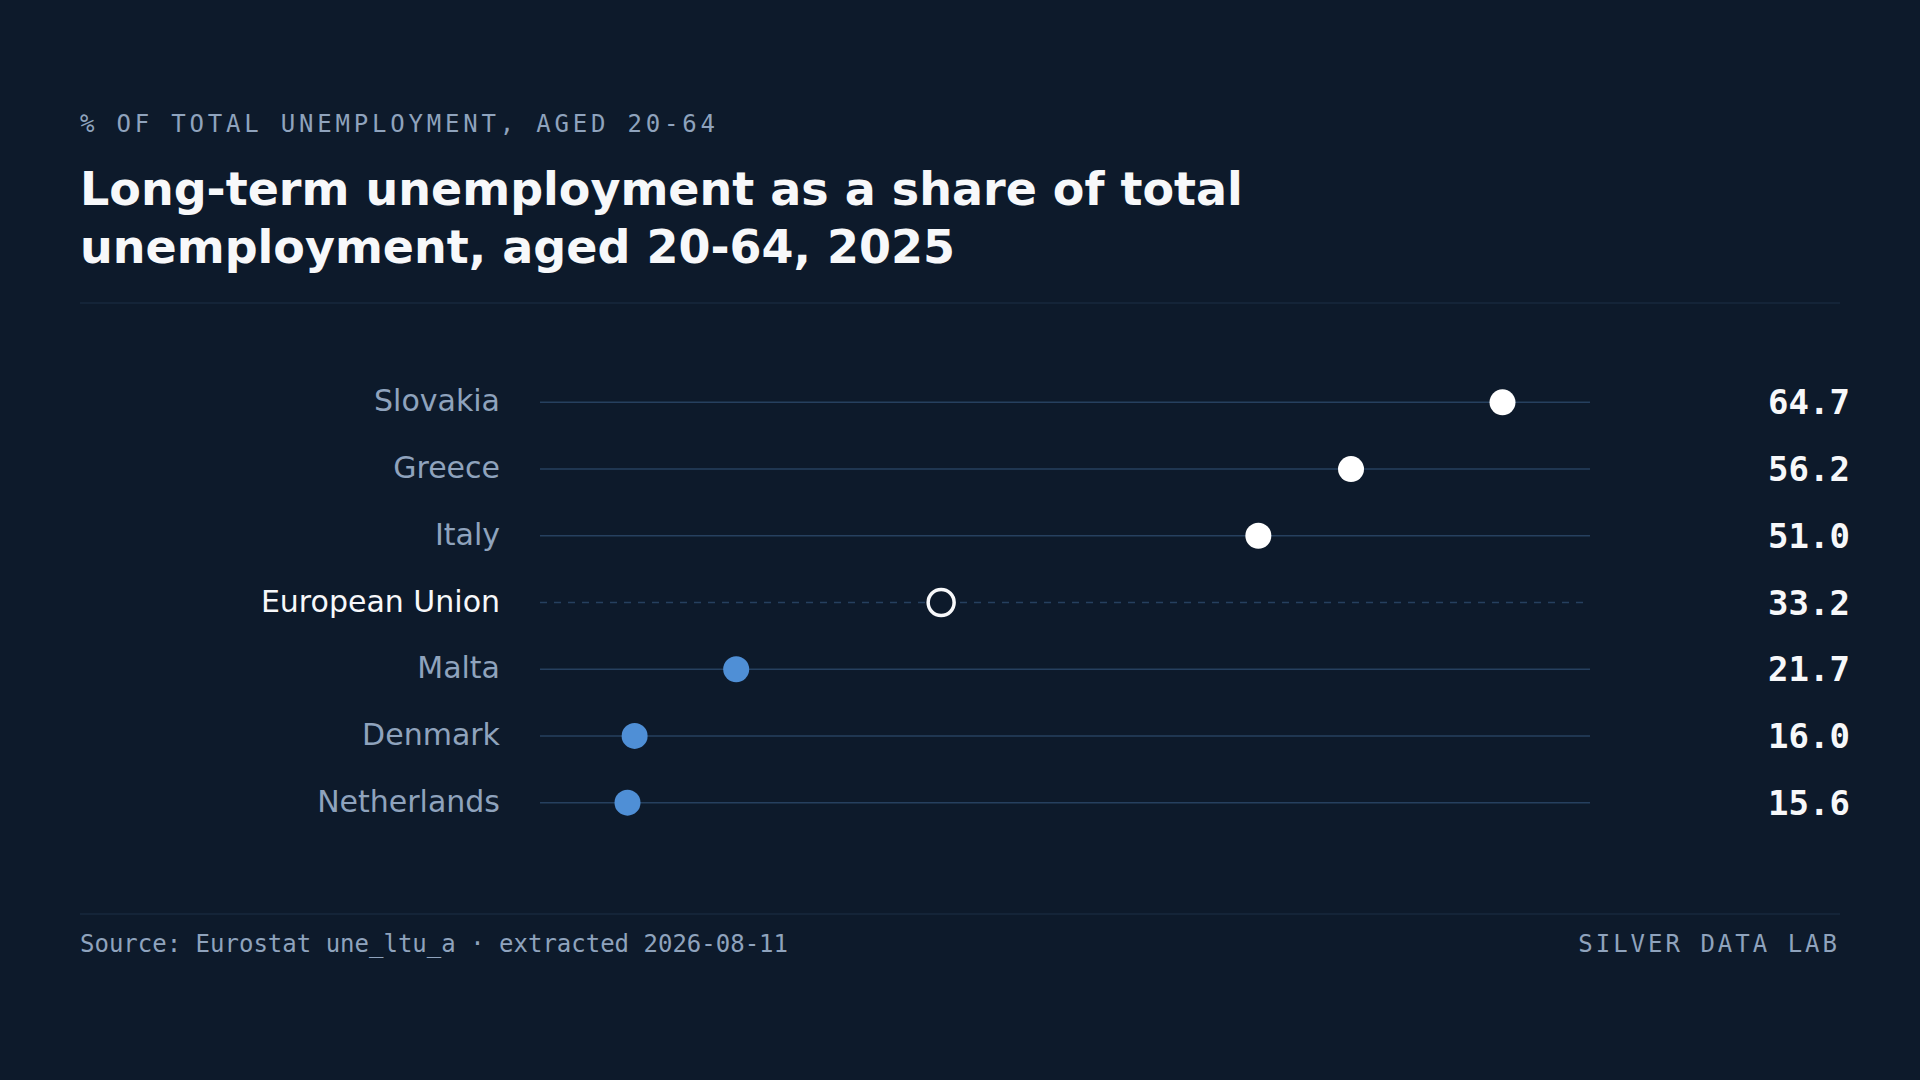
- Slovakia records the highest share at 64.7%, ahead of Greece at 56.2% and Italy at 51.0%.
- The Netherlands records the lowest at 15.6%, followed by Denmark at 16.0% and Malta at 21.7%.
- The gap between Slovakia and the Netherlands is 49.1 percentage points — three times the 16.0-point spread between the highest and lowest national employment rate.
Two countries, one rate, different problems
An unemployment rate describes how many people are out of work. It says nothing about how long they have been there, and that omission hides most of what matters.
Unemployment that lasts weeks is a labour market reallocating people between jobs. Unemployment that lasts years is something else: skills decay, employer scepticism hardens, and the probability of returning to work falls the longer the spell continues. Two countries reporting the same rate can be in entirely different situations depending on how that rate is distributed across durations.
Eurostat measures this directly. Long-term unemployment counts people out of work for twelve months or more, expressed as a share of total unemployment.
A third of Europe's unemployment is long-term
In 2025, 33.2% of unemployed people aged 20 to 64 in the EU had been without work for at least a year: 4.0 million people out of 12.2 million unemployed.
The more uncomfortable figure sits inside that one. Very long-term unemployment, meaning spells of two years or more, covered 2.1 million people. That is 52.4% of the long-term unemployed and 17.4% of all unemployment in the Union. The typical long-term unemployed person in Europe is not just past the twelve-month threshold; they are past twice it.
Composition varies far more than level
Slovakia records the highest share in the Union at 64.7%. Nearly two of every three unemployed Slovaks have been out of work for a year or more. Greece follows at 56.2% and Italy at 51.0%, with Bulgaria at 43.3% and Croatia at 39.6%.
At the other end, the Netherlands records 15.6%, Denmark 16.0% and Malta 21.7%, with Cyprus at 22.0% and Austria at 24.1%.
The distance between Slovakia and the Netherlands is 49.1 percentage points. For comparison, the widest national gap in the employment rate across the same Union is 16.0 points. Member States differ far more in the composition of their unemployment than in its level, and a European average of 33.2% describes almost none of them.
Why the composition matters more than the level
The countries at the top of this ranking are not uniformly the countries with the most unemployment. A labour market can hold its unemployment rate down while allowing the people who do fall out of work to stay out for years, and a labour market with more churn can post a higher rate made up of shorter, more recoverable spells.
That distinction changes what a policy response should look like. A high level with short durations is an argument about labour demand. A moderate level with long durations is an argument about re-entry: retraining, hiring incentives, and the treatment of employment gaps on a CV. The unemployment rate alone cannot tell those two situations apart, which is the reason this indicator exists.
Long-term unemployment as a share of total unemployment, aged 20-64, 2025
| Country | % of unemployment | Gap to EU averagepercentage points, derived |
|---|---|---|
| Slovakia | 64.7 | +31.5 |
| Greece | 56.2 | +23.0 |
| Italy | 51.0 | +17.8 |
| European Unionaggregate | 33.2 | — |
| Malta | 21.7 | −11.5 |
| Denmark | 16.0 | −17.2 |
| Netherlands | 15.6 | −17.6 |
This table as data: CSV · JSON
Every Member State for this indicator+
Members see every Member State for this indicator here, not only the rows the ranking prints. Become a Member
Embed this chart
Paste this code into a page. The frame carries the source and the extraction date, and links back to the study.
What these figures cannot tell you
- This is a share, not a rate
- Every figure on this page is a percentage of the unemployed, not of the population or of the labour force. A country can raise its long-term share simply by reducing short-term unemployment faster than long-term unemployment, without a single additional person becoming long-term unemployed. The share should be read alongside the unemployment level, not instead of it.
- Duration is self-reported
- The length of a spell comes from the respondent's own account in the Labour Force Survey rather than from administrative records. Spells that are interrupted by short periods of work, training or illness may be reported inconsistently across countries, and this affects the twelve-month threshold more than it affects the total count of unemployed.
- Small unemployment counts make shares volatile
- In Member States with low unemployment the denominator is small, so the share can move several points between years without a large change in the number of people involved. Year-on-year movements in the countries at the bottom of this ranking should be treated with more caution than movements at the top.
- Results before and after 2021 are not fully comparable
- A break in the series falls on 1 January 2021 with the introduction of the new EU Labour Force Survey framework. Comparisons spanning that date carry the discontinuity.
Frequently asked questions
- What counts as long-term unemployment?
- Being without work for twelve months or more. Eurostat also publishes a very long-term measure at twenty-four months or more. In the EU in 2025, 4.0 million people aged 20 to 64 were long-term unemployed and 2.1 million of them were very long-term unemployed.
- What share of EU unemployment is long-term?
- 33.2% in 2025, for people aged 20 to 64. Roughly one in three unemployed people in the Union had been out of work for at least a year, and just over half of those had been out of work for at least two.
- Which EU country has the most long-term unemployment?
- Measured as a share of its own unemployment, Slovakia, at 64.7% in 2025, ahead of Greece at 56.2% and Italy at 51.0%. This is a share and not a rate: it describes the composition of each country's unemployment, not how much unemployment it has.
- Why does the duration of unemployment matter?
- Because the chance of returning to work falls as a spell lengthens, through skill decay and employer reluctance to hire after a long gap. Two countries with identical unemployment rates can face different problems: one reallocating workers quickly between jobs, the other holding a group of people out of the labour market for years.
Methodological note
Long-term unemployment is defined as being unemployed for twelve months or more; very long-term unemployment as twenty-four months or more. Both are published here as a percentage of total unemployment for the 20 to 64 age band, using Eurostat's own PC_UNE unit rather than a ratio computed by us.
The denominator was verified rather than assumed, and it comes from a second dataset, declared below: Eurostat publishes 4,039 thousand long-term unemployed in une_ltu_a against 12,151 thousand unemployed in the same age band for 2025 in lfsi_sla_a, which gives 33.2% and matches the published percentage exactly.
The share of the long-term unemployed who are very long-term — 52.4% — is derived by Silver Data Lab from the two published counts and is labelled as derived wherever it appears.
Source data
This study draws on 2 datasets from Eurostat. Each can be inspected and re-downloaded from its catalogue, and the filters below are the ones applied.
Long-term unemployment by sex — annual data
une_ltu_a
- Filters applied:
- freq=A · indic_em=LTU, VLTU · age=Y20-64 · sex=T · unit=PC_UNE, THS_PER
- Extracted:
- 2026-09-11
- Source last updated:
- 2026-09-10
Labour market slack by sex and age — annual data
lfsi_sla_a
- Filters applied:
- freq=A · wstatus=UNE · age=Y20-64 · sex=T · unit=THS_PER · geo=EU27_2020
- Extracted:
- 2026-09-11
- Source last updated:
- 2026-09-10
Download the data
The data the study you have just read is built on, exactly as it was downloaded and archived.
Yours as a Member.
Data downloadable by Members
How to cite
Record the vintage as well as the study: the figures on this page are the ones extracted on the dates below.
Silver Data Lab Research Desk (2026). A Third of the EU's Unemployed Have Been Out of Work for a Year or More. Silver Data Lab, published 14 June 2026, last updated 11 October 2026. https://www.silverdatalab.com/studies/long-term-unemployment-in-the-eu
- Data: Eurostat, Long-term unemployment by sex — annual data (une_ltu_a), filters freq=A, indic_em=LTU, VLTU, age=Y20-64, sex=T, unit=PC_UNE, THS_PER; extracted 2026-09-11; source last updated 2026-09-10. https://doi.org/10.2908/une_ltu_a
- Data: Eurostat, Labour market slack by sex and age — annual data (lfsi_sla_a), filters freq=A, wstatus=UNE, age=Y20-64, sex=T, unit=THS_PER, geo=EU27_2020; extracted 2026-09-11; source last updated 2026-09-10. https://doi.org/10.2908/lfsi_sla_a
Silver Data Lab's analysis is licensed CC BY 4.0. The statistics remain their publisher's and keep its terms of reuse.
Ask the research desk
A question about this study — a definition, a filter, a break in the series, what the figures can and cannot support — answered by the desk that made the extraction.
Members can write to the research desk
Other studies on the same dataset
Studies where the same country leads or trails
Germany Has the EU's Biggest Trade Surplus in Goods With Non-EU Countries
EU Member States together ran a goods trade surplus of 113.9 billion euro with countries outside the Union in 2025.
Germany Is the Only EU Country Where Most People Do Not Own Their Home
68.5% of the EU population lived in a home owned by their household in 2025.
Nearly Half of Slovak Private-Sector Jobs Are in Firms With Under Ten Staff
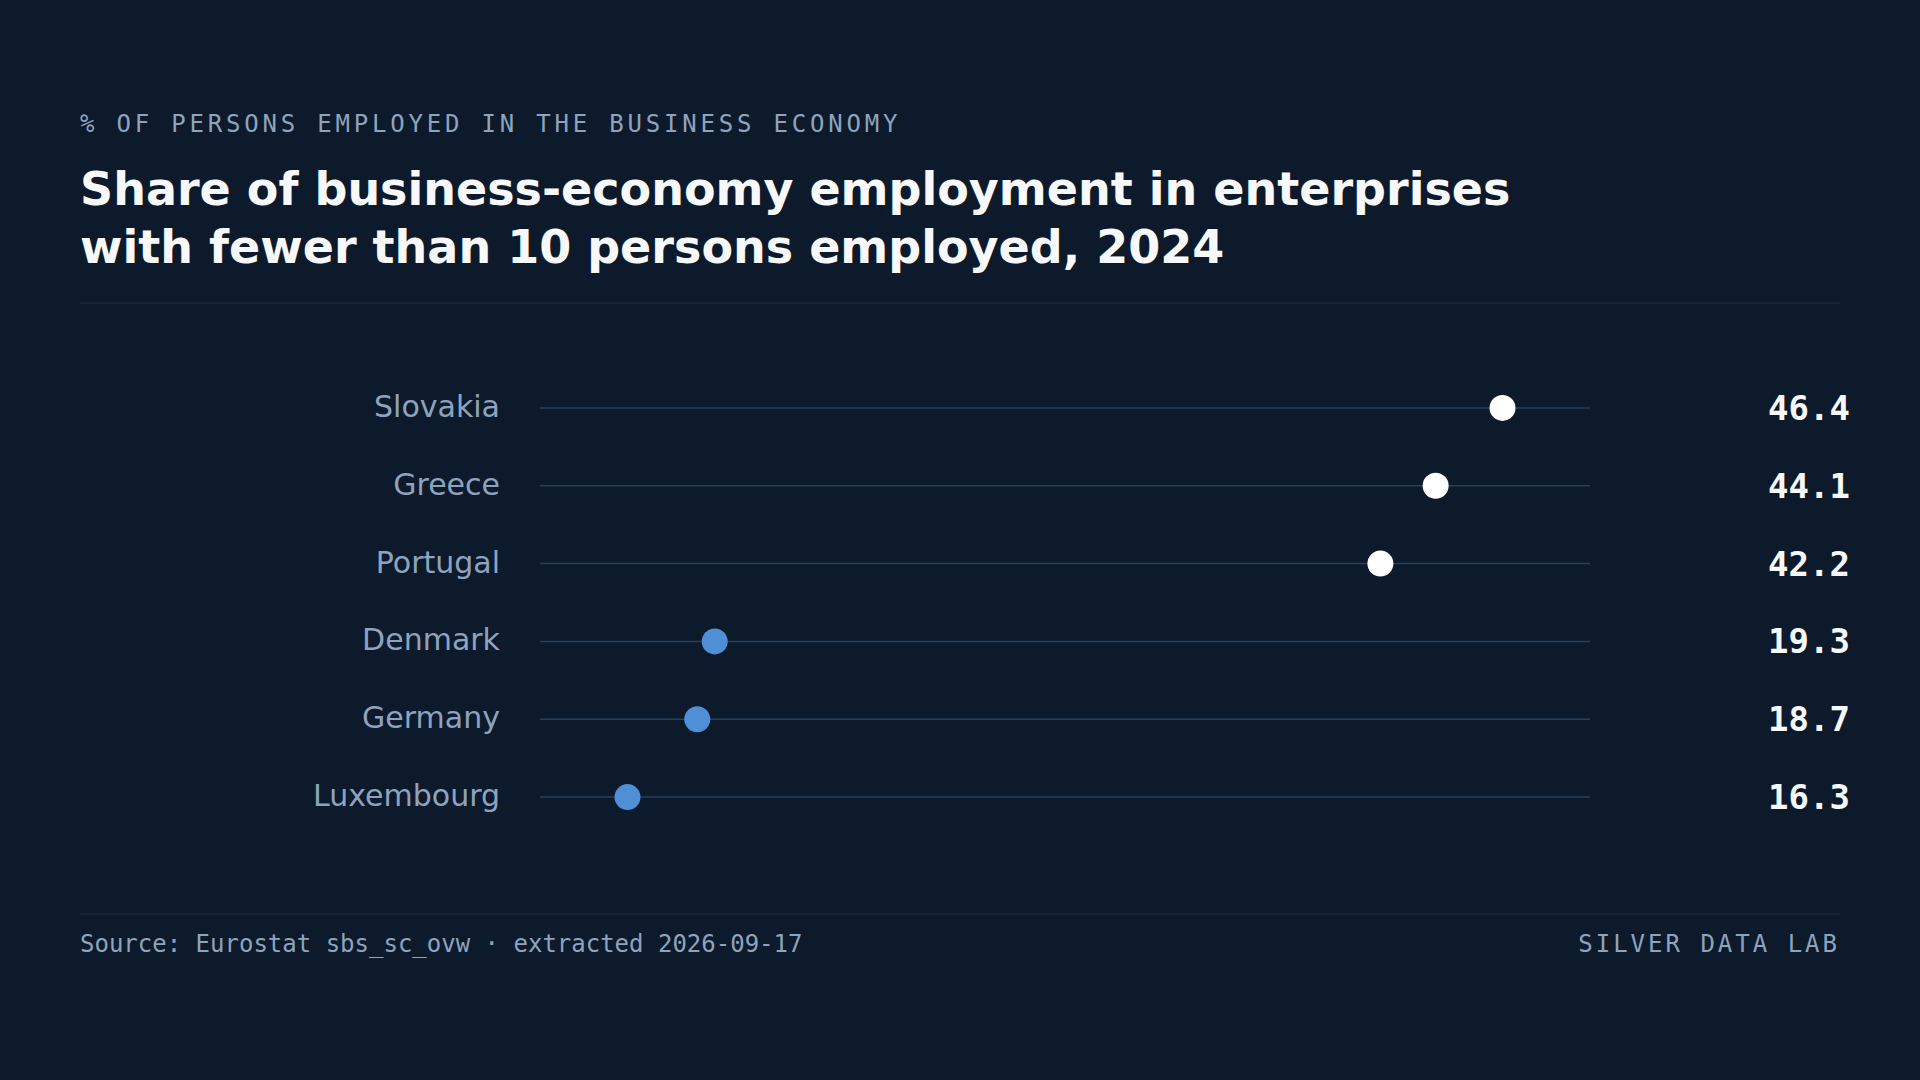
Enterprises with fewer than 10 persons employed account for 46.4% of business-economy employment in Slovakia, 44.1% in Greece, 42.2% in Portugal and 41.1% in Estonia, shares derived here from Eurostat's 2024 counts.