Germany Buys More Services From Abroad Than It Sells
Silver Data Lab Research Desk · Statistical analysis · Published on 11 July 2026
This study is open to members only
Its sources, filters and extraction date are declared above, as they are for every study. Sign in to read the analysis in full.
- Data source
- Eurostat
- Reference period
- 2025
- Last updated
- 11 October 2026
Re-checked against the source on 03 October 2026. 24 values in its datasets moved between snapshots, 6 of them figures stated on this page. Every revision we have observed →
Key estimates
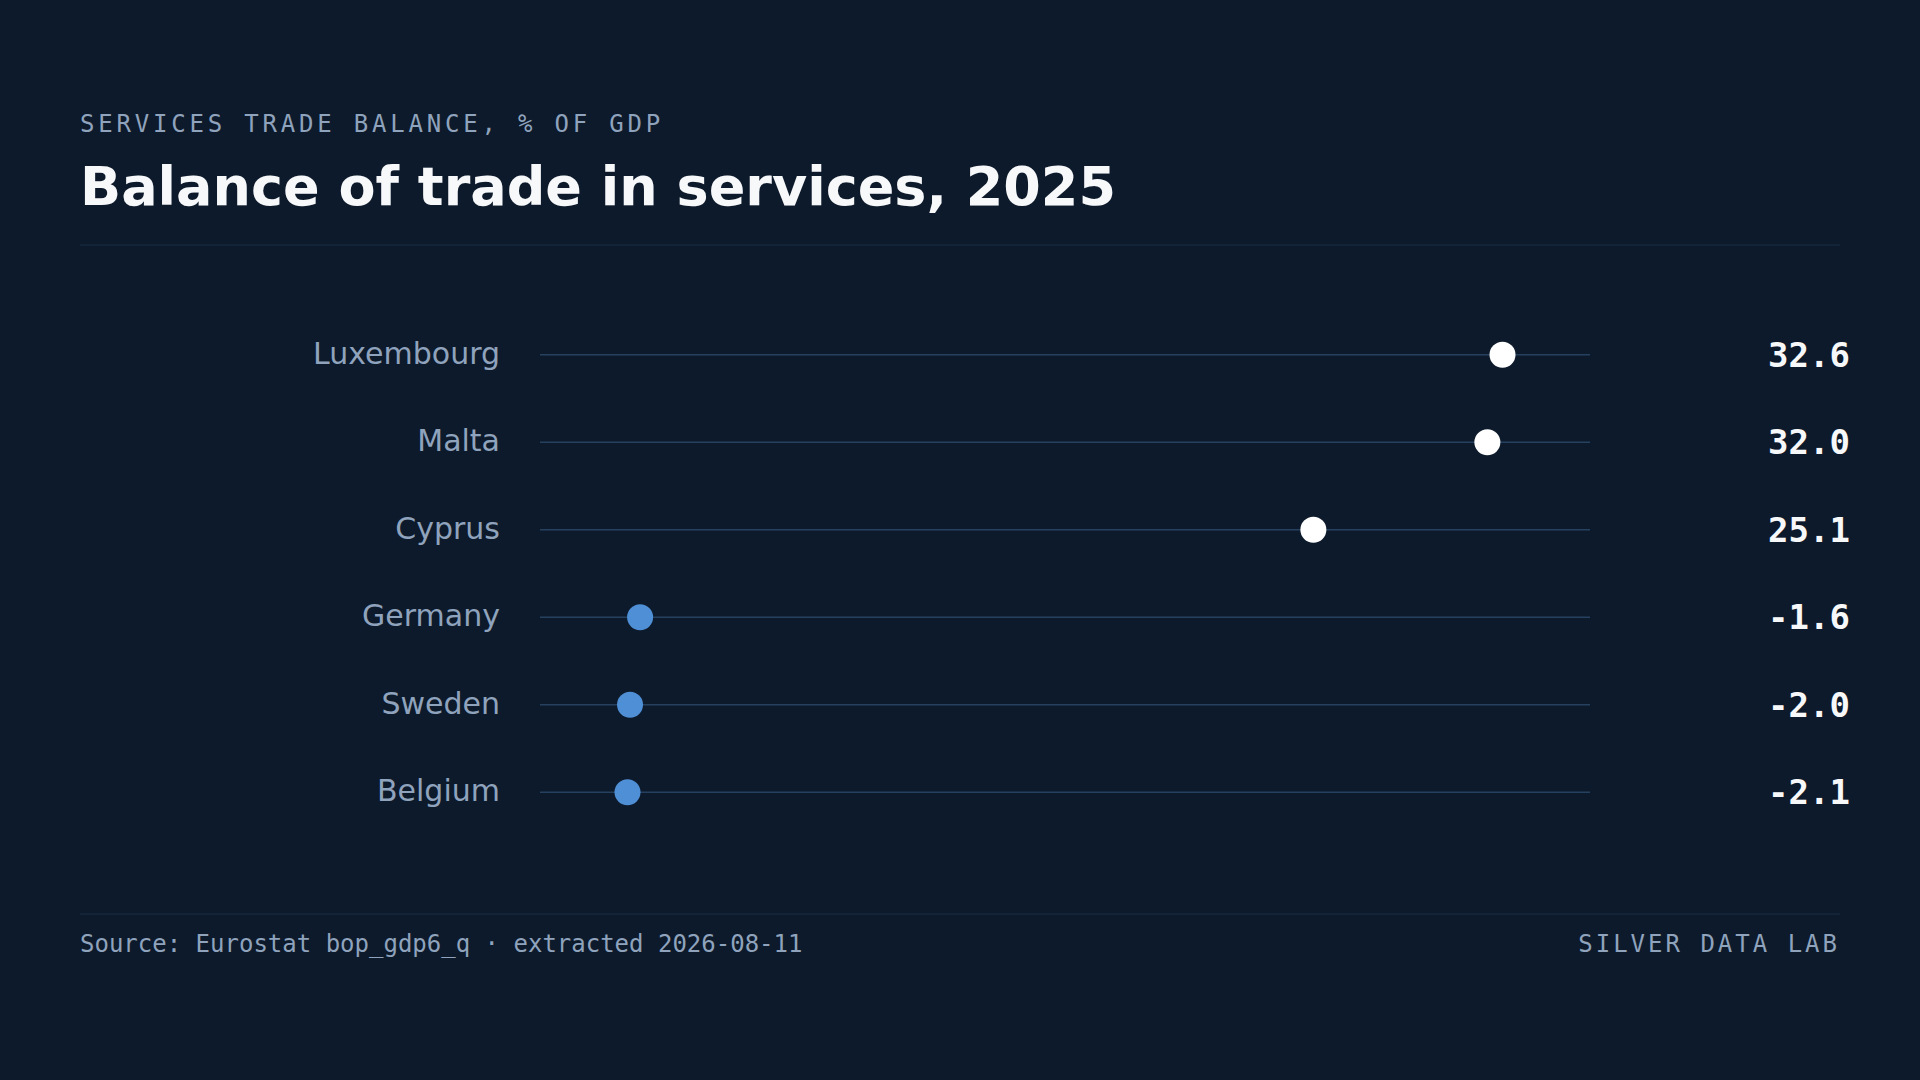
- Malta records a services trade surplus worth 33.2% of GDP, Luxembourg 30.3% and Cyprus 27.4%.
- Five Member States run services deficits: Italy, Finland, Germany, Sweden and Belgium.
- Germany, the Union's largest manufacturer, is a net importer of services at minus 1.7% of GDP.
- Croatia at 15.9% has the largest surplus of any Member State that is not a financial or shipping centre.
- Eurostat publishes no EU aggregate for this indicator, so this ranking carries no reference row.
A balance, not a volume
The balance of trade in services is what a country earns from selling services abroad minus what it spends buying them, expressed against the size of its economy. A positive figure means services bring money in on net; a negative one means they take it out.
Unlike most indicators on this site the scale runs through zero, and five Member States sit below it.
The surpluses
Malta records 33.2% of GDP, Luxembourg 30.3% and Cyprus 27.4%. All three are small economies whose services exports — financial, corporate and, for Cyprus and Malta, shipping-related — are large relative to everything else they do.
Croatia at 15.9% is the more interesting case, because it is the largest surplus in the Union that has an ordinary explanation. Croatian services exports are overwhelmingly tourism, and tourism receipts from foreign visitors count as a services export in exactly the same way a consultancy fee does.
Portugal at 10.7% and Greece at 9.0% sit in the same category. A summer spent by foreign visitors on a Mediterranean coast appears in this statistic as an export industry, which is what it is.
The deficits, and where they are
Sweden records minus 1.9%, Germany minus 1.7%, Finland minus 1.6%, Belgium minus 1.4% and Italy minus 0.3%.
Germany is the finding. It is the Union's largest manufacturing economy and its largest exporter of goods, and it buys more services from abroad than it sells. Sweden and Finland, both high-income economies with strong technology sectors, are in the same position.
What the pattern rules out
The ranking is close to the inverse of what a ranking of industrial strength would look like, and that is worth stating carefully. It does not show that manufacturing economies are weak at services: Germany's domestic services sector is large, and this indicator says nothing about it.
What it shows is narrower. Countries with large tradable goods sectors tend to buy services abroad — logistics, licensing, business services attached to their industrial operations — and countries without them are more likely to have built an export business out of services instead.
A services surplus is therefore not a mark of a more advanced economy, and a deficit is not a weakness. They describe what a country sells across its borders, and the two do not rank the same way.
Balance of trade in services, 2025
| Country | % of GDP |
|---|---|
| Malta | 33.2 |
| Luxembourg | 30.3 |
| Cyprus | 27.4 |
| Finland | -1.6 |
| Germany | -1.7 |
| Sweden | -1.9 |
This table as data: CSV · JSON
Every Member State for this indicator+
Members see every Member State for this indicator here, not only the rows the ranking prints. Become a Member
What these figures cannot tell you
- A balance conceals its size
- A country with very large services exports and imports can record a balance near zero, and a country with small flows in both directions records the same. This indicator shows the net position, not how much services trade a country does.
- Tourism dominates several positions
- For Croatia, Portugal, Greece and Cyprus, spending by foreign visitors is the largest component of services exports. That makes those figures sensitive to a single season and to events affecting travel.
- Financial routing in the small economies
- In Luxembourg, Malta and Ireland the services account reflects cross-border financial and corporate activity that is not proportionate to domestic employment or output. The figures are correct as published and do not describe the domestic economy on their own.
- No EU aggregate is published
- Eurostat does not publish an EU value for this series. Summing the Member States would count trade between them on both sides and produce a figure of our own construction, so this study reports none.
Frequently asked questions
- Which EU country has the largest services trade surplus?
- Malta, at 33.2% of GDP in 2025, followed by Luxembourg at 30.3% and Cyprus at 27.4%. All three are small economies with financial or shipping-related services exports that are large relative to the rest of their activity.
- Which EU countries import more services than they export?
- Five: Sweden at minus 1.9% of GDP, Germany at minus 1.7%, Finland at minus 1.6%, Belgium at minus 1.4% and Italy at minus 0.3%.
- Does tourism count as a services export?
- Yes. Money spent inside a country by foreign visitors is recorded as an export of services. That is the main reason Croatia records a surplus worth 15.9% of GDP, with Portugal at 10.7% and Greece at 9.0% close behind.
- Why is there no EU average on this chart?
- Because Eurostat does not publish one for this series. Adding the Member States together would count services traded between them on both sides of the ledger, producing a figure calculated here rather than one taken from the source, so the ranking is shown without a reference row.
Methodological note
The balance of trade in services is taken from Eurostat's balance of payments statistics under the BPM6 framework, expressed as a share of GDP, unadjusted, against the rest of the world.
Values are for 2025 and cover all 27 Member States. Eurostat lists an EU entry in this dataset but publishes no value for it, so no reference row is shown and no EU figure is quoted anywhere in this study.
The count of Member States in deficit, and the observation that the ranking runs close to the inverse of industrial size, are derived by Silver Data Lab from the published national values.
Source data
The underlying series can be inspected and re-downloaded from the Eurostat data browser. The filters below are the ones applied.
Main Balance of Payments items as share of GDP (BPM6)
bop_gdp6_q
- Filters applied:
- freq=A · unit=PC_GDP · s_adj=NSA · bop_item=S · stk_flow=BAL · partner=WRL_REST · time=2025
- Extracted:
- 2026-10-03
- Source last updated:
- 2026-10-02
Download the data
The data the study you have just read is built on, exactly as it was downloaded and archived.
Yours as a Member.
Data downloadable by Members
How to cite
Record the vintage as well as the study: the figures on this page are the ones extracted on the dates below.
Silver Data Lab Research Desk (2026). Germany Buys More Services From Abroad Than It Sells. Silver Data Lab, published 11 July 2026, last updated 11 October 2026. https://www.silverdatalab.com/studies/services-trade-balance-in-the-eu
- Data: Eurostat, Main Balance of Payments items as share of GDP (BPM6) (bop_gdp6_q), filters freq=A, unit=PC_GDP, s_adj=NSA, bop_item=S, stk_flow=BAL, partner=WRL_REST, time=2025; extracted 2026-10-03; source last updated 2026-10-02. https://doi.org/10.2908/bop_gdp6_q
Silver Data Lab's analysis is licensed CC BY 4.0. The statistics remain their publisher's and keep its terms of reuse.
Ask the research desk
A question about this study — a definition, a filter, a break in the series, what the figures can and cannot support — answered by the desk that made the extraction.
Members can write to the research desk
Other studies on the same dataset
Denmark Has the EU's Biggest Surplus With the World, at 12.3% of GDP
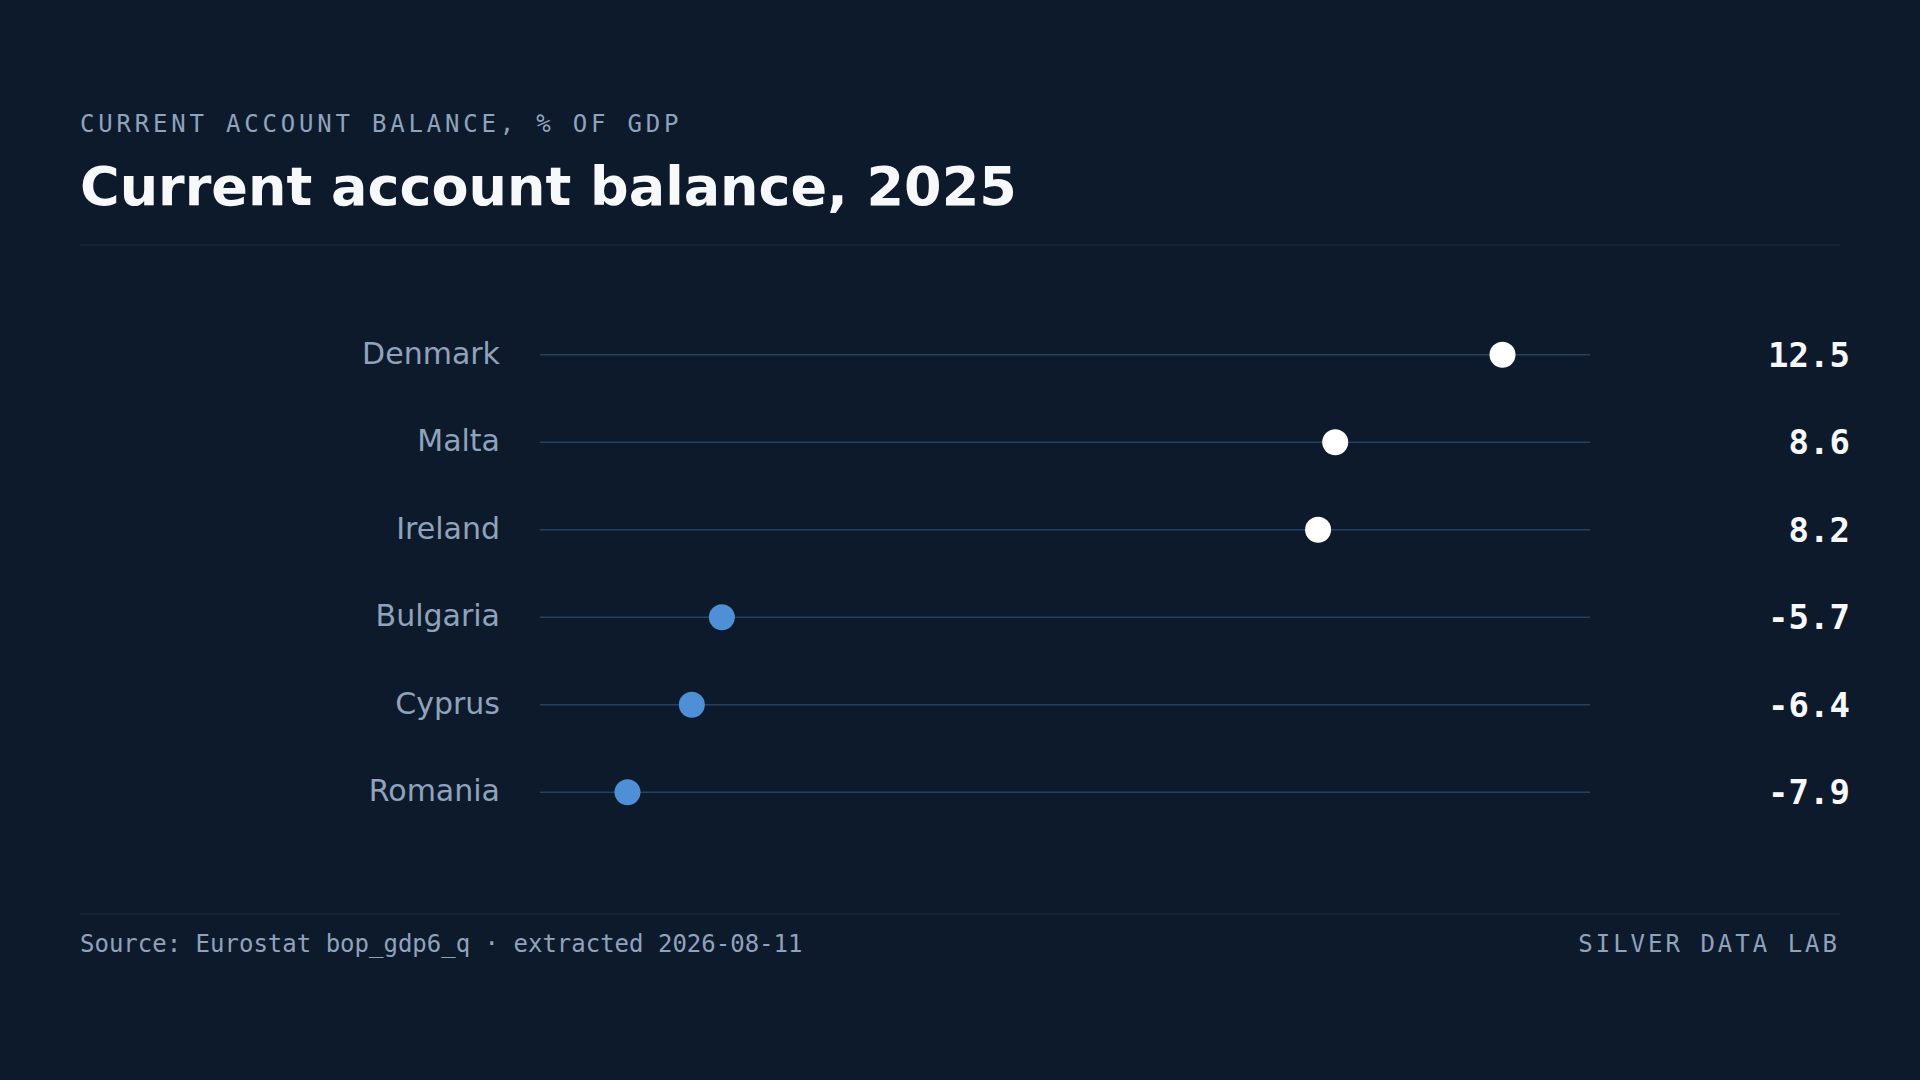
Denmark ran a current account surplus worth 12.3% of GDP in 2025, the largest in the Union.
Ireland Pays Out More Income Abroad Than It Receives, a Net 28.6% of GDP
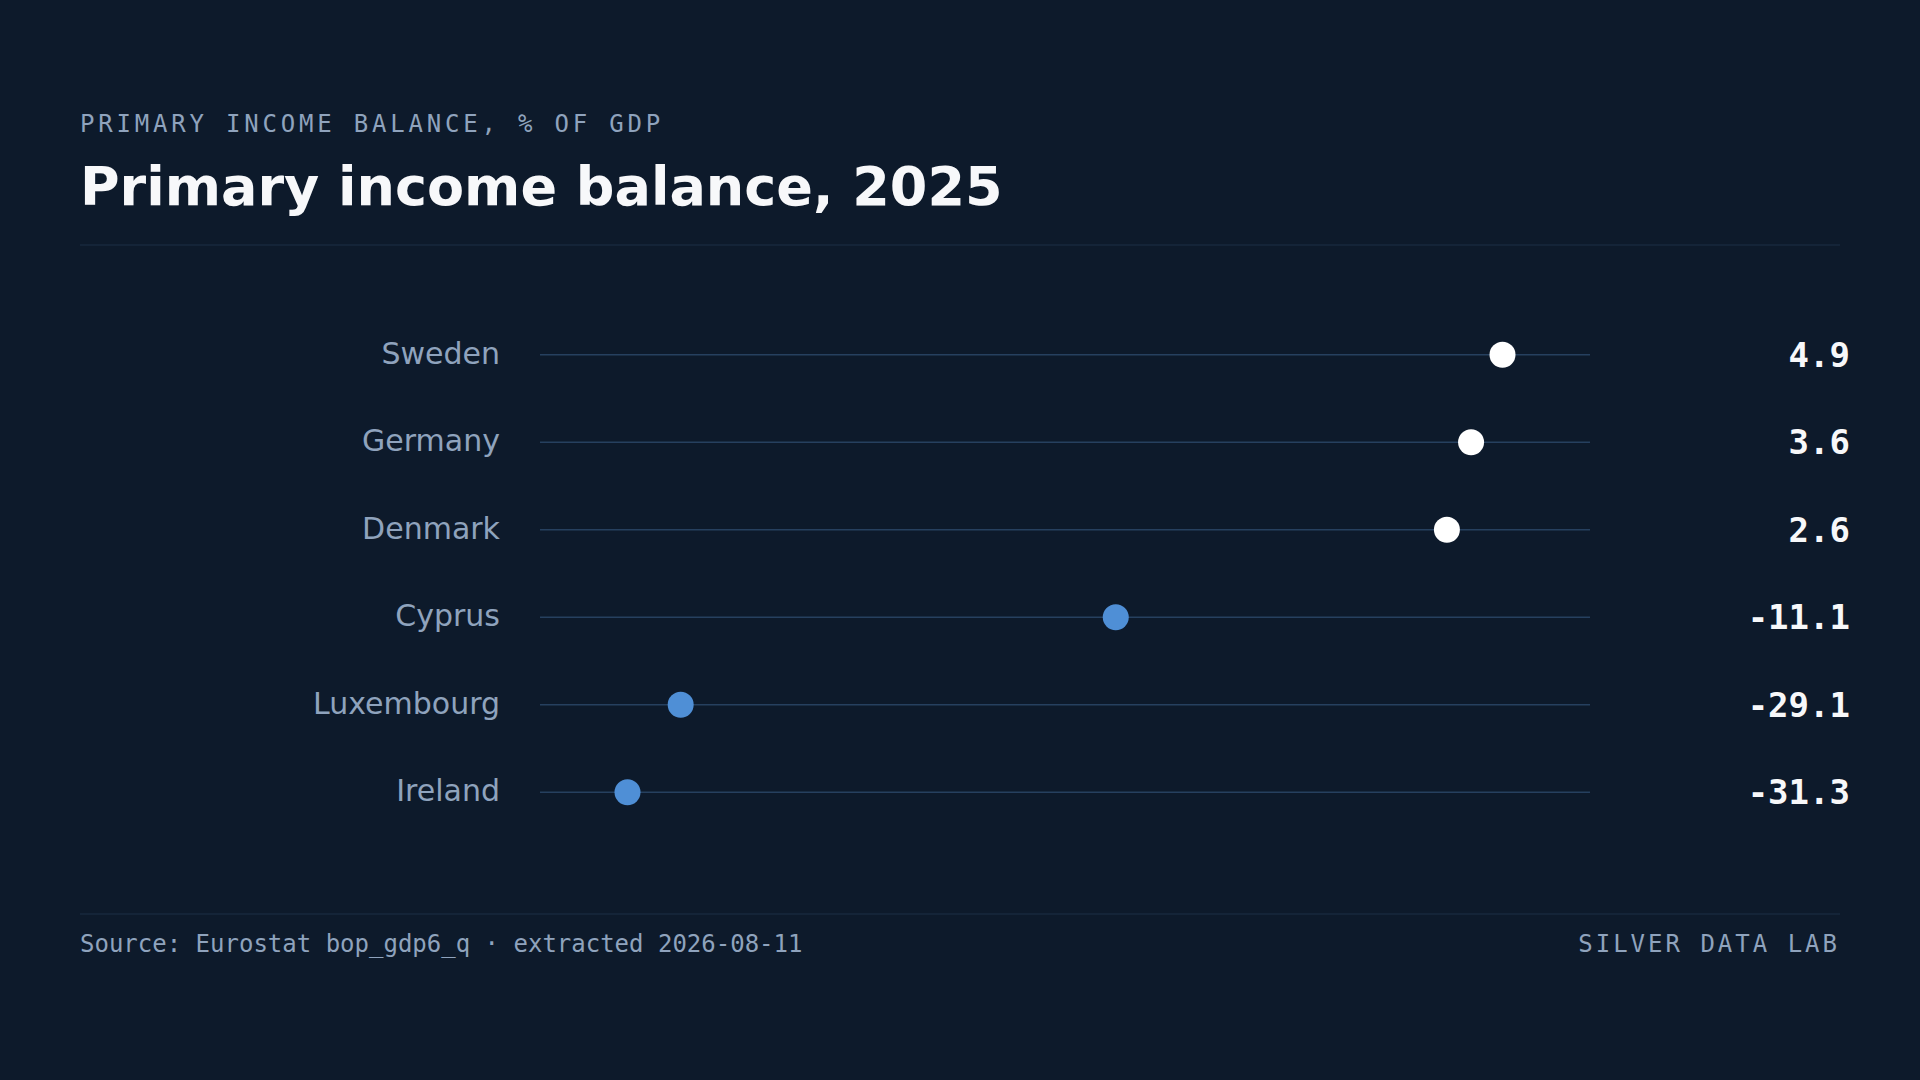
Ireland's net primary income outflow was 28.6% of GDP in 2025, second only to Luxembourg's 29.3%.
Denmark's Net Wealth Abroad Is Worth 97.8% of Its GDP
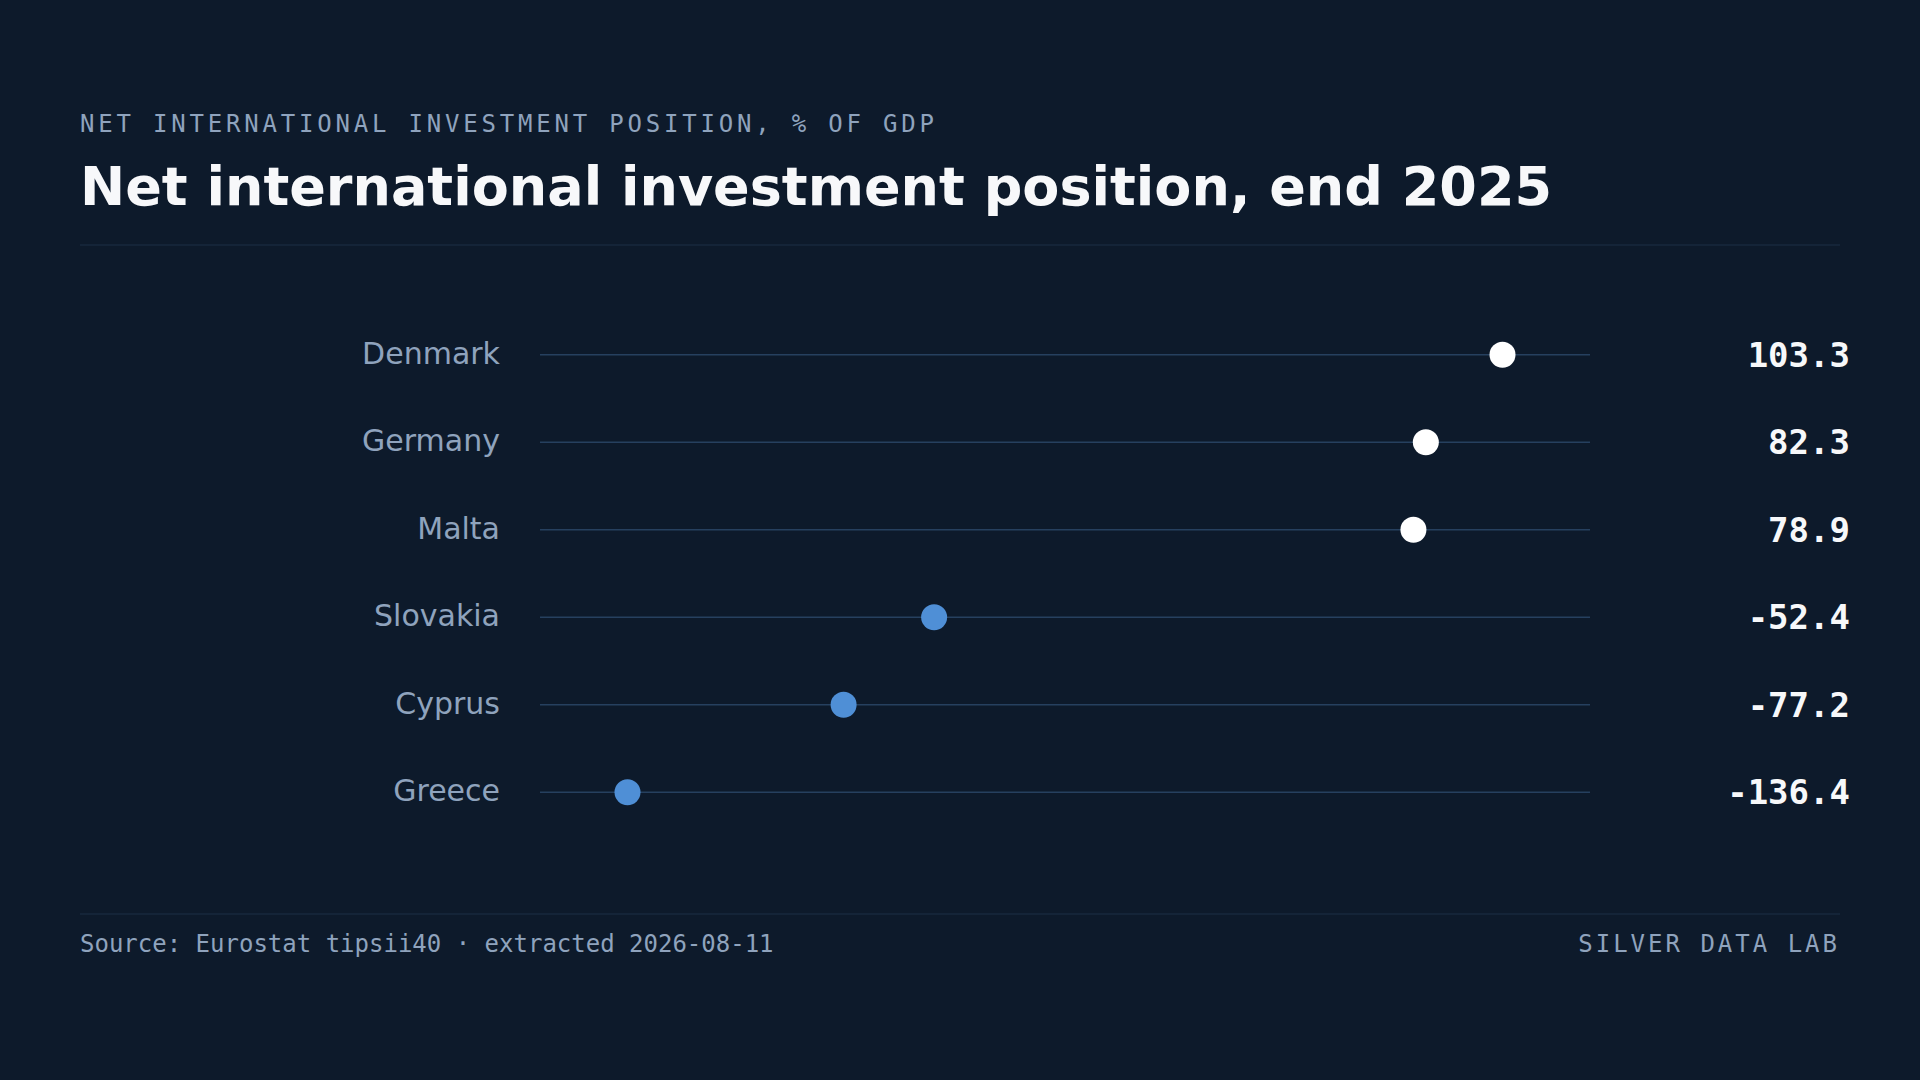
Denmark's net international investment position stood at 97.8% of GDP at the end of 2025 — close to a full year of its economic output.
Studies where the same country leads or trails
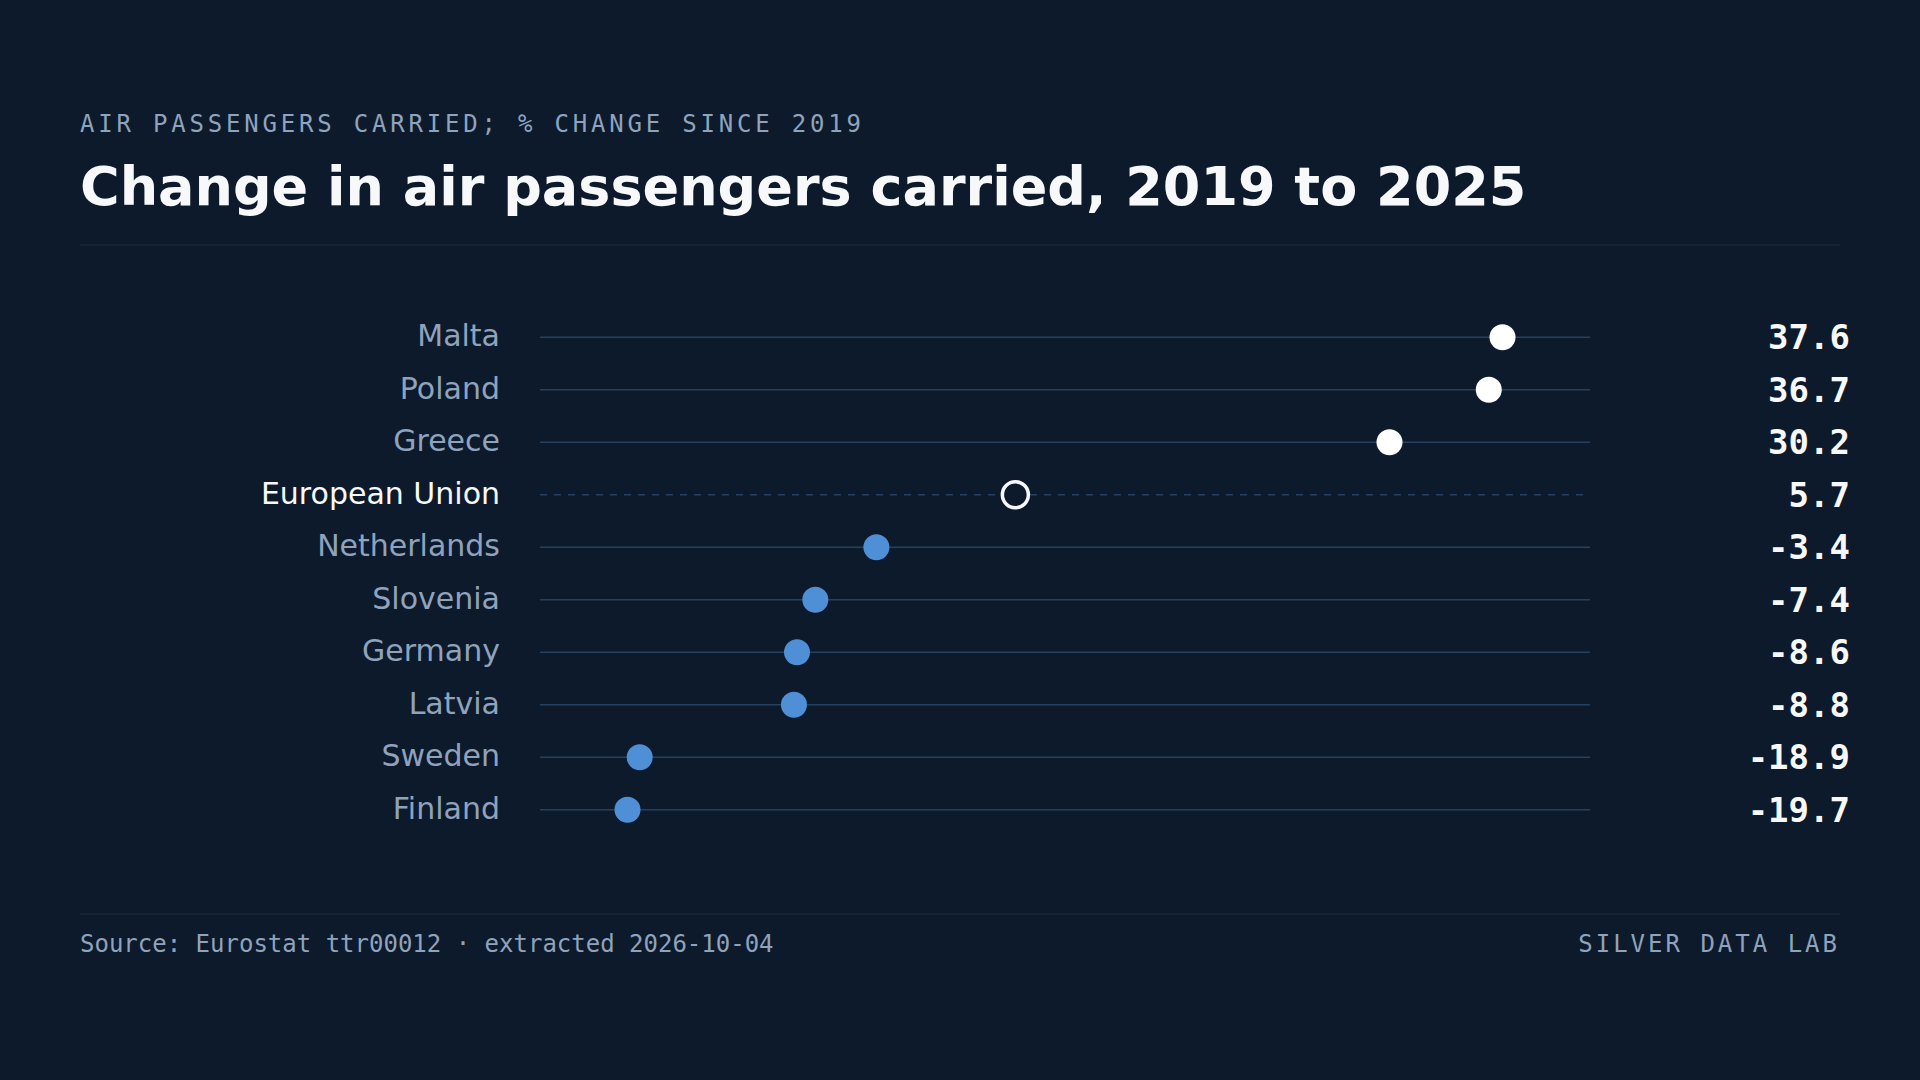
Air Travel in the EU Is Back Above Its Pre-Pandemic Level
Air passengers carried in the EU reached 1,093.6 million in 2025, 5.7% more than in 2019; the total first passed its 2019 level in 2024, by 0.7%.
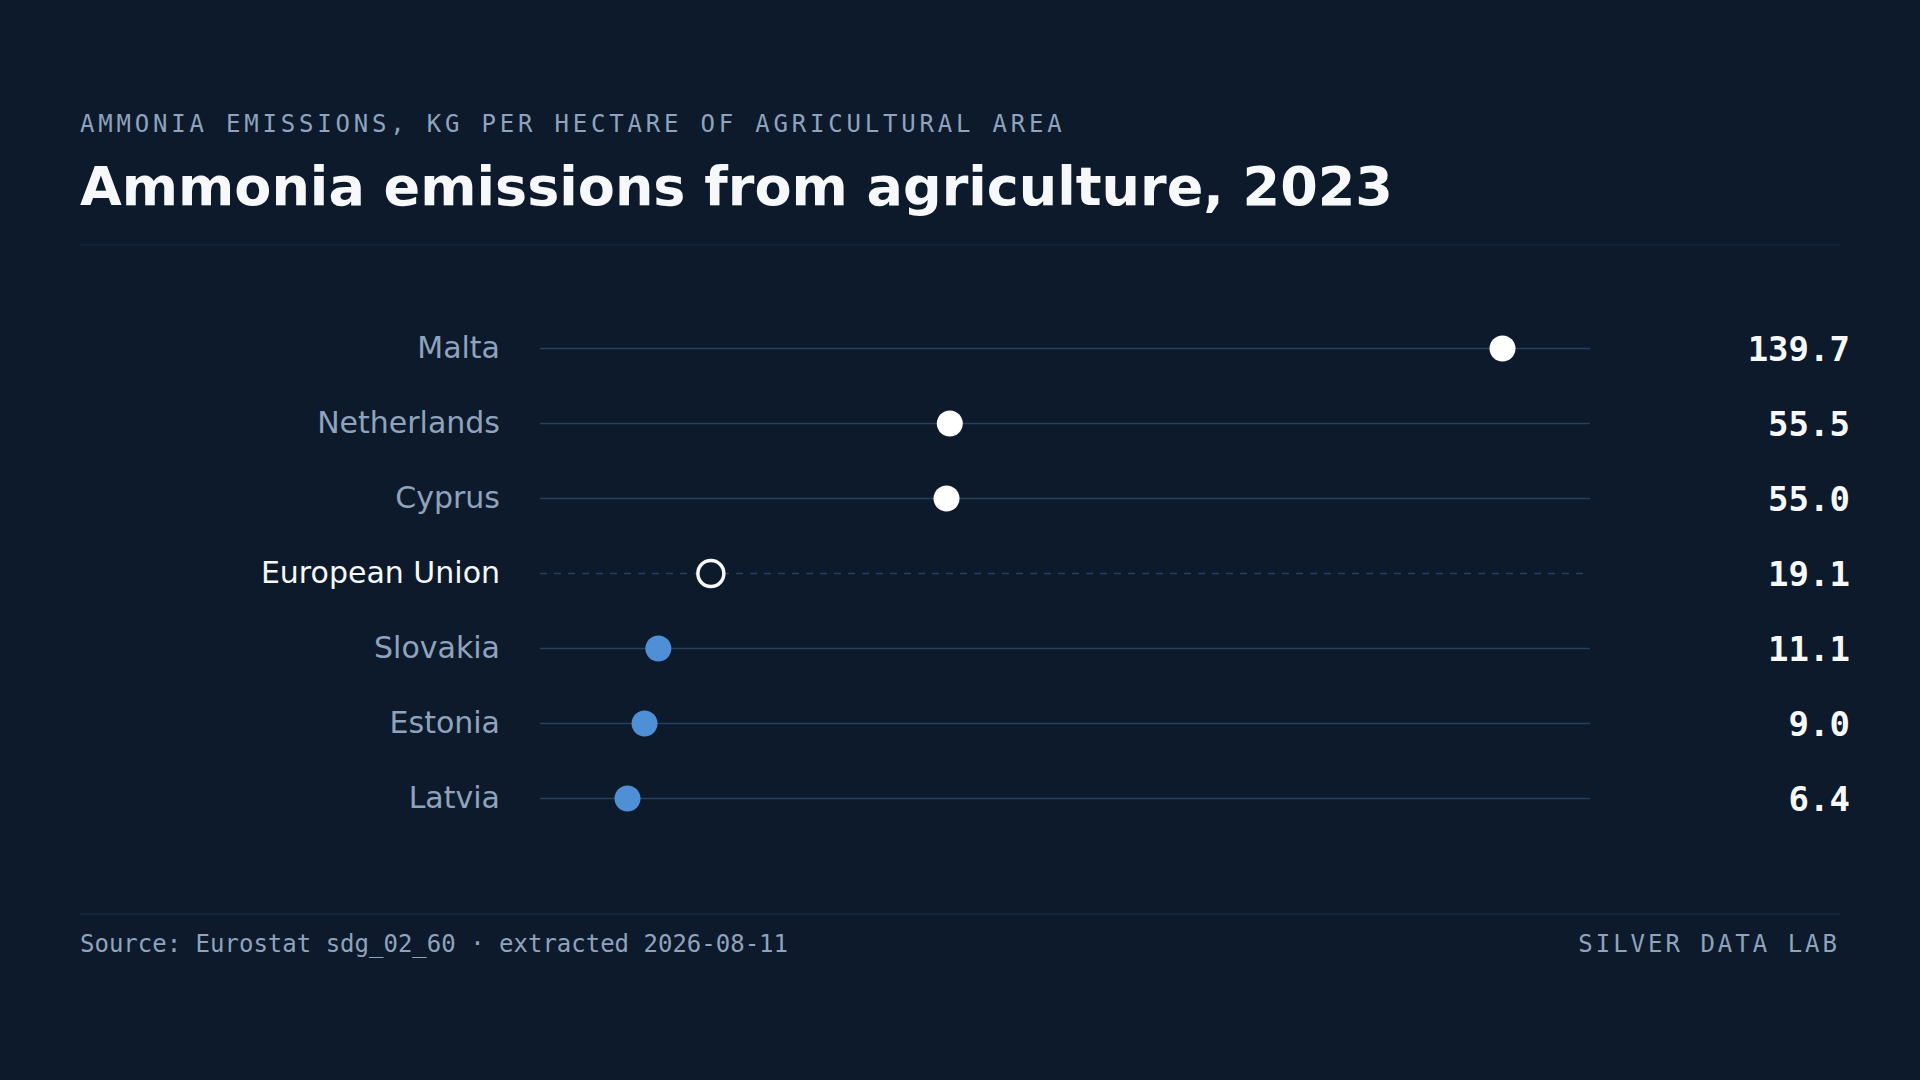
Dutch Farms Emit Nearly Three Times the EU Average of Ammonia per Hectare
EU agriculture emitted 19.2 kg of ammonia per hectare of agricultural area in 2023.
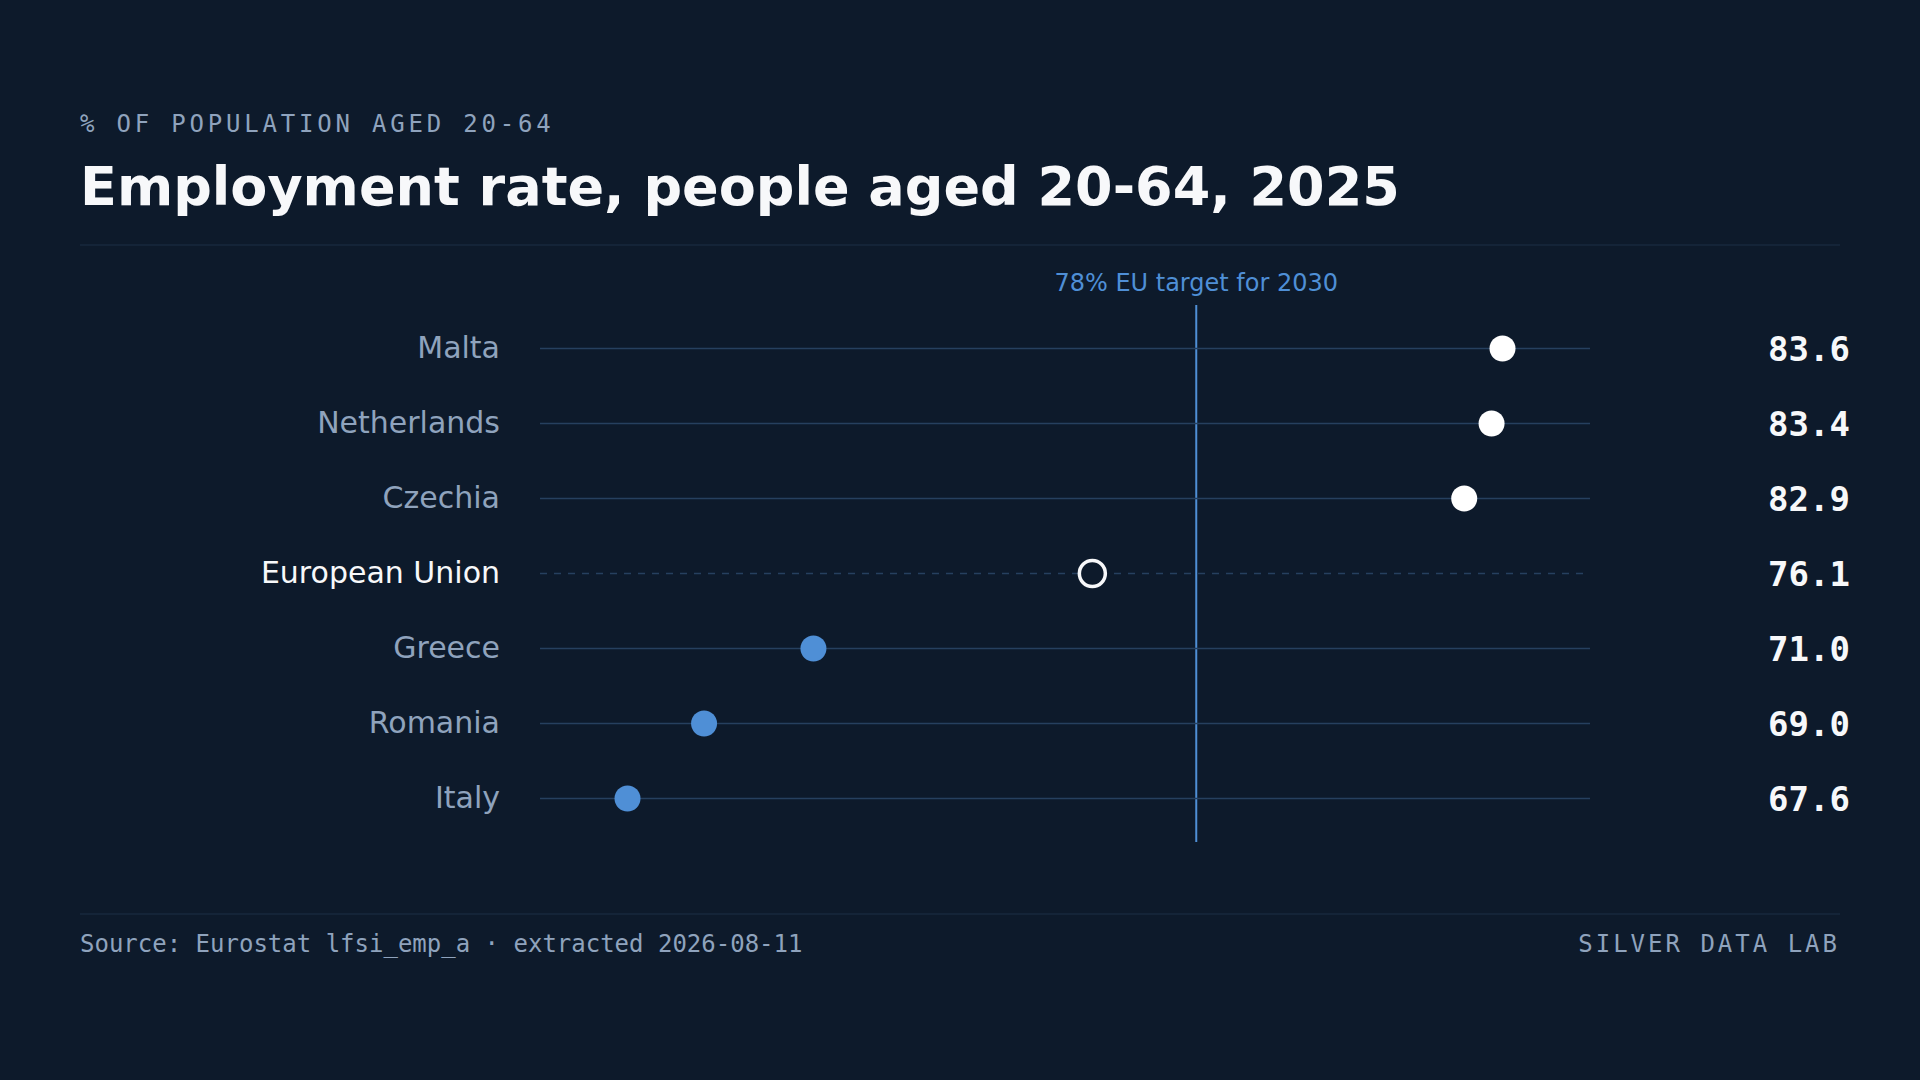
Employment Rates Vary Far More Between EU Regions Than Between Countries
76.1% of people aged 20 to 64 were in employment across the EU in 2025, or 197.8 million people — the highest reading since the series began in 2009.