The EU's Four Biggest Economies Export Less Than Most Others for Their Size
Silver Data Lab Research Desk · Statistical analysis · Published on 11 August 2026
- Data source
- Eurostat
- Reference period
- 2025
- Last updated
- 11 October 2026
Re-checked against the source on 23 October 2026. 81 values in its datasets moved between snapshots, 12 of them figures stated on this page. Every revision we have observed →
Key estimates
- Exports of goods and services from the 27 Member States equalled 49.6% of their combined GDP in 2025.
- Germany at 40.1%, Spain at 36.5%, France at 33.7% and Italy at 31.6% are the Union's four largest economies, and all four sit among its six least open.
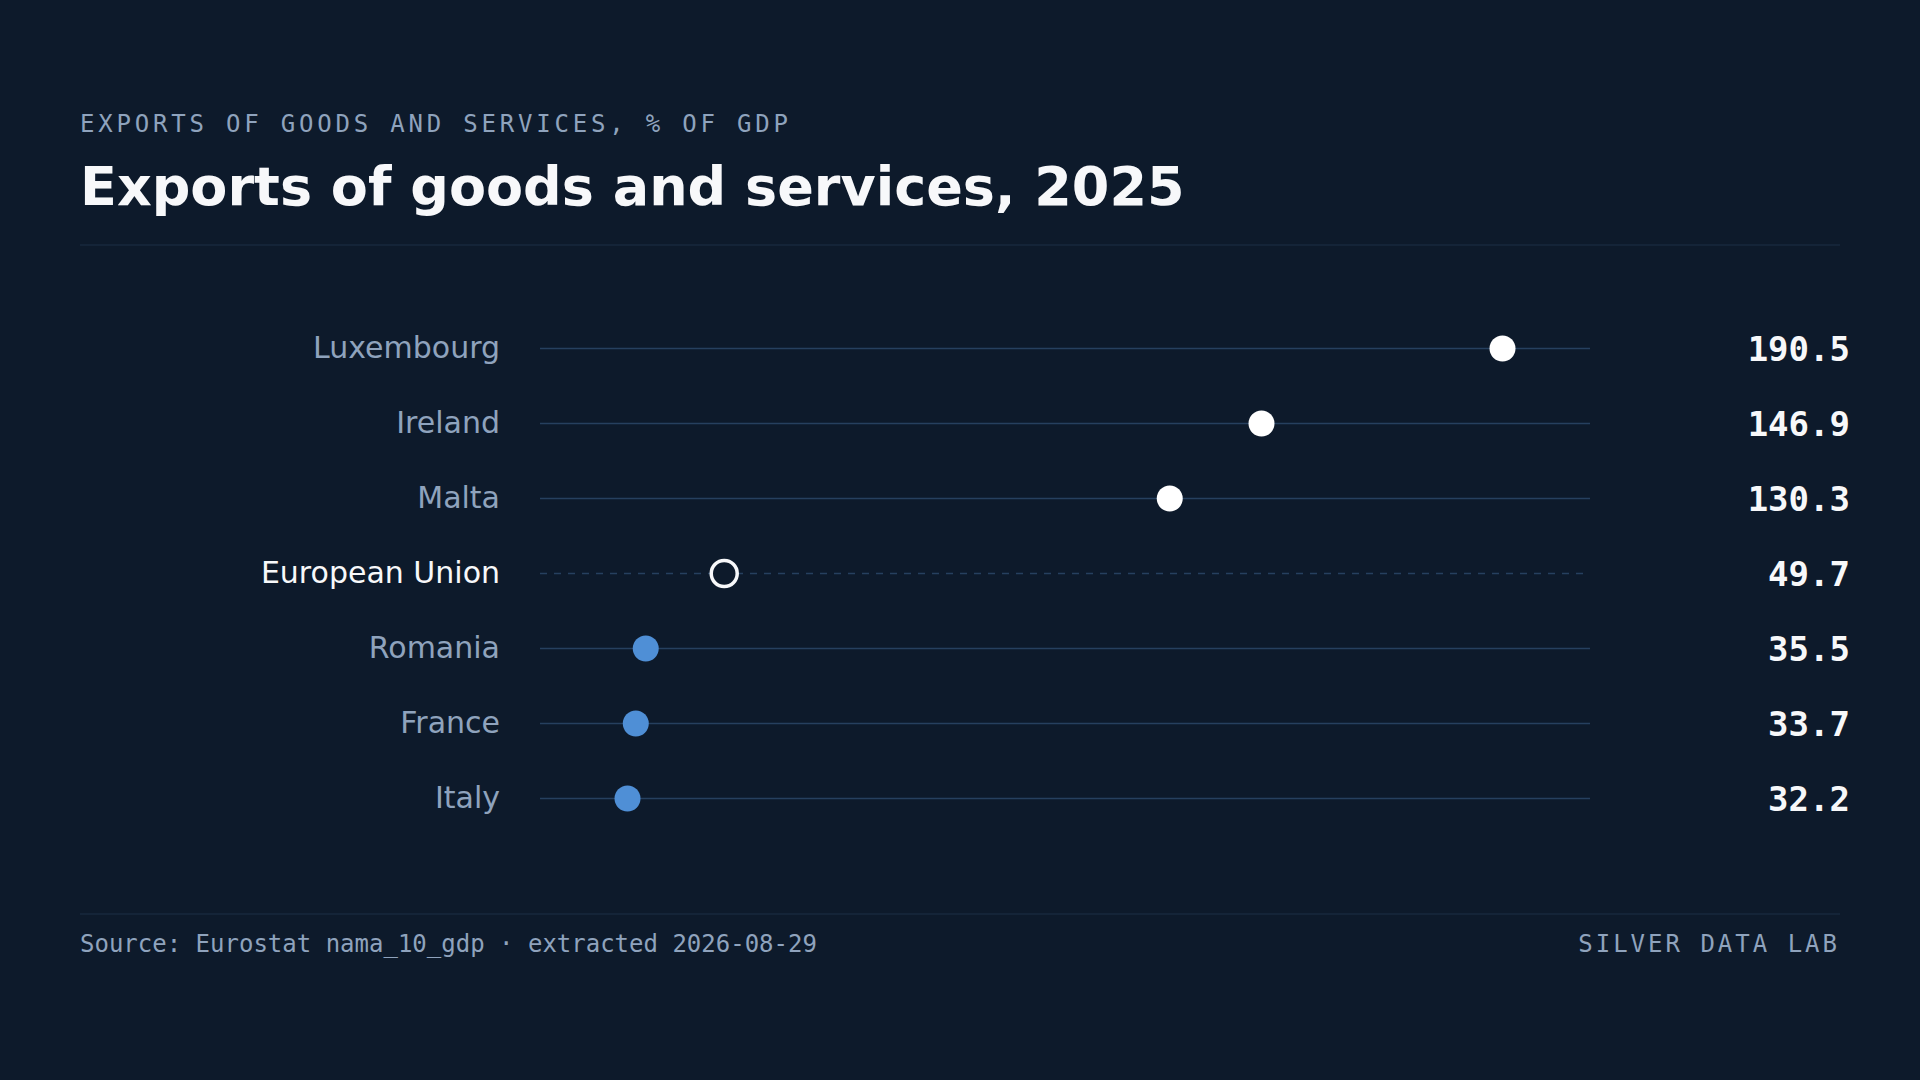
- Luxembourg exports 202.7% of its GDP, Ireland 146.9% and Malta 130.3% — all three above 100%.
- Eighteen Member States are more open than the EU figure and nine less open.
- The ratio between Luxembourg and Italy is 6.4 to one.
A ratio that can legitimately exceed one
Trade openness is exports measured against national output. It reads as a percentage, and the intuitive expectation is that it cannot pass 100%: a country should not be able to sell more than it makes.
Three Member States do. Luxembourg records 202.7%, Ireland 146.9% and Malta 130.3%.
The arithmetic is not broken. GDP counts value added, while exports count gross sales, so goods that arrive in a country, have a small amount of work done to them and leave again enter the export figure at their full value and the GDP figure at only the margin. Add cross-border services routed through a financial centre, and a small open economy can post a figure like Luxembourg's without anything unusual happening in it.
The inverse relationship with size
The finding here is not at the top of the ranking. It is that the Union's four largest economies occupy four of its lowest positions.
Germany records 40.1%, Spain 36.5%, France 33.7% and Italy 31.6%. All four are below the EU figure of 49.6%, and Italy and France are the two lowest in the Union.
Germany is the case most likely to surprise. It is routinely described as an export economy, and in absolute terms it is the Union's largest exporter by a wide margin. Measured against the size of its own economy, it is less open than Bulgaria, Poland or Croatia.
Why size drives the ratio
A large economy contains more of its own supply chain. A German firm buying components from another German firm records no trade; a Slovak firm buying the same components from Austria records an import and Austria records an export. The same industrial activity produces a higher trade ratio when it is split across more borders.
That is why openness measured this way is close to a measure of economic size, and why it should not be read as a measure of how internationally engaged a country is. Italy at the bottom of this ranking is not a closed economy. It is a large one.
What the EU row does and does not say
The figure of 49.6% is the sum of the 27 national values, which means trade between Member States counts as exports within it. It describes how much cross-border selling the Union's economies do, not how much the Union sells to the rest of the world.
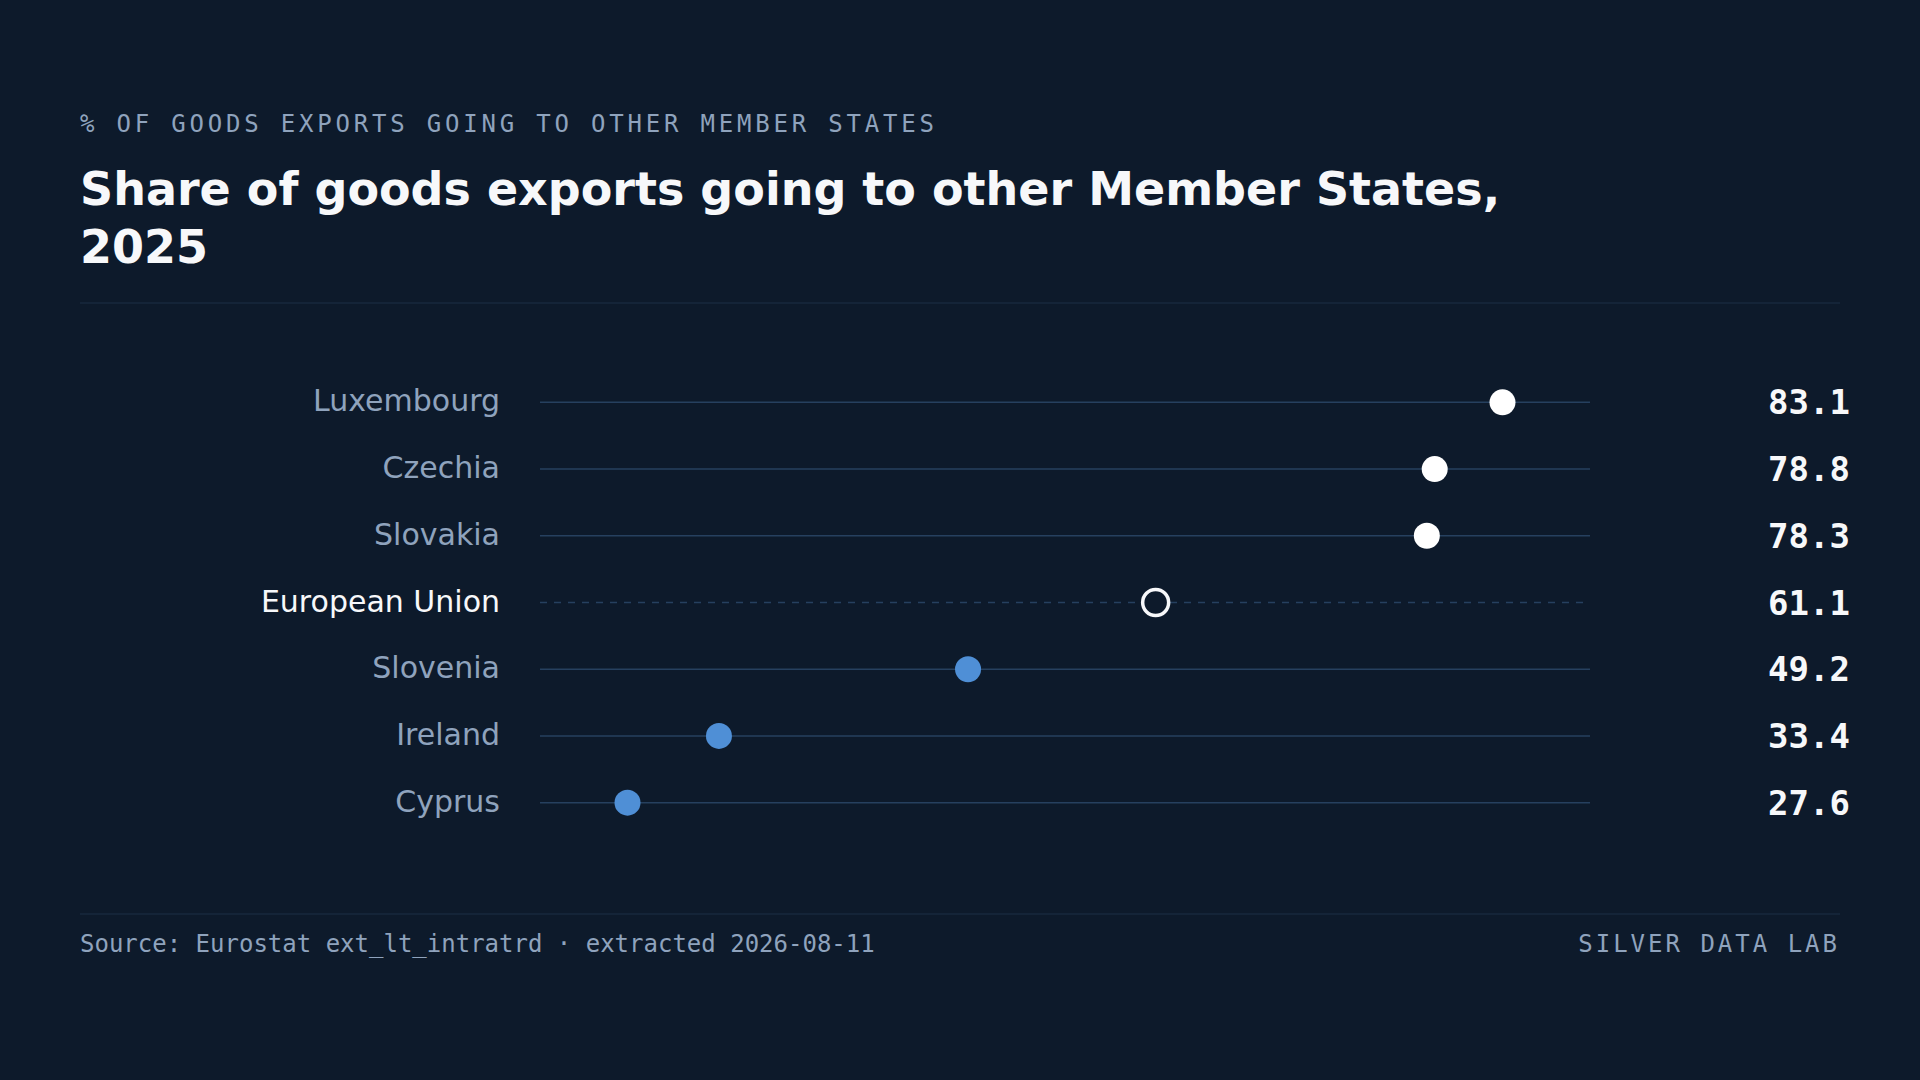
That distinction is not a technicality. Roughly three fifths of EU goods exports go to other Member States, which is the subject of a separate study in this category.
Exports of goods and services, 2025
| Country | % of GDP | Gap to EU totalpercentage points, derived |
|---|---|---|
| Luxembourg | 202.7 | +153.1 |
| Ireland | 146.9 | +97.3 |
| Malta | 130.3 | +80.7 |
| European Unionaggregate | 49.6 | — |
| Romania | 35.2 | −14.4 |
| France | 33.7 | −15.9 |
| Italy | 31.6 | −18.0 |
This table as data: CSV · JSON
Every Member State for this indicator+
Members see every Member State for this indicator here, not only the rows the ranking prints. Become a Member
Embed this chart
Paste this code into a page. The frame carries the source and the extraction date, and links back to the study.
What these figures cannot tell you
- Gross exports against value added
- Exports are counted at their full sale value while GDP counts only value added, so any economy that imports, processes lightly and re-exports records a high ratio. The measure is not comparable in the way a share of output normally would be.
- The EU figure is not consolidated
- The 49.6% shown for the Union is the sum of national exports and includes trade between Member States. The Union's exports to the rest of the world are a much smaller share of its GDP, and this dataset does not isolate them.
- Openness largely tracks economic size
- Because a larger economy contains more of its own supply chain, this indicator ranks small economies high and large ones low almost by construction. It is weak evidence about trade policy or international engagement.
- Financial and multinational routing
- In Luxembourg and Ireland the ratio is affected by cross-border services and by the operations of multinational firms domiciled there. Both figures are correct as published and neither describes the domestic economy on its own.
Frequently asked questions
- How open is the EU economy?
- Exports of goods and services from the 27 Member States equalled 49.6% of their combined GDP in 2025. That figure includes trade between Member States, so it measures cross-border selling within the Union as well as sales to the rest of the world.
- Which EU country is the most open economy?
- Luxembourg, whose exports equal 202.7% of GDP, ahead of Ireland at 146.9% and Malta at 130.3%. Ratios above 100% are possible because exports are counted at full value while GDP counts only value added.
- Why is Germany not near the top?
- Because the ratio is measured against the size of its own economy. Germany is the Union's largest exporter in absolute terms, but at 40.1% of GDP it is less open than Bulgaria or Poland — a large economy contains more of its own supply chain, so less of its activity crosses a border.
- Can exports really exceed GDP?
- Yes. GDP counts value added and exports count gross sales, so goods imported, lightly processed and re-exported appear at full value in one and at the margin in the other. Three Member States record ratios above 100%.
Methodological note
Exports of goods and services and gross domestic product are both taken from Eurostat's annual national accounts at current prices in millions of euro. Openness is computed here as exports divided by GDP for each Member State and for the EU aggregate.
Values are for 2025, the most recent year with complete coverage of the 27 Member States at the extraction date.
The ratio itself, the counts of Member States above and below the EU figure, and the comparison between the four largest economies and the rest are derived by Silver Data Lab from the two published series and are labelled as derived wherever they appear.
Source data
The underlying series can be inspected and re-downloaded from the Eurostat data browser. The filters below are the ones applied.
GDP and main components (output, expenditure and income)
nama_10_gdp
- Filters applied:
- freq=A · na_item=P6, B1GQ · unit=CP_MEUR · time=2025
- Extracted:
- 2026-10-23
- Source last updated:
- 2026-10-22
Download the data
The data the study you have just read is built on, exactly as it was downloaded and archived.
Yours as a Member.
Data downloadable by Members
How to cite
Record the vintage as well as the study: the figures on this page are the ones extracted on the dates below.
Silver Data Lab Research Desk (2026). The EU's Four Biggest Economies Export Less Than Most Others for Their Size. Silver Data Lab, published 11 August 2026, last updated 11 October 2026. https://www.silverdatalab.com/studies/trade-openness-in-the-eu
- Data: Eurostat, GDP and main components (output, expenditure and income) (nama_10_gdp), filters freq=A, na_item=P6, B1GQ, unit=CP_MEUR, time=2025; extracted 2026-10-23; source last updated 2026-10-22. https://doi.org/10.2908/nama_10_gdp
Silver Data Lab's analysis is licensed CC BY 4.0. The statistics remain their publisher's and keep its terms of reuse.
Ask the research desk
A question about this study — a definition, a filter, a break in the series, what the figures can and cannot support — answered by the desk that made the extraction.
Members can write to the research desk
Other studies on the same dataset
Studies where the same country leads or trails
Bulgaria's GDP per Person Is About a Third of the EU Average
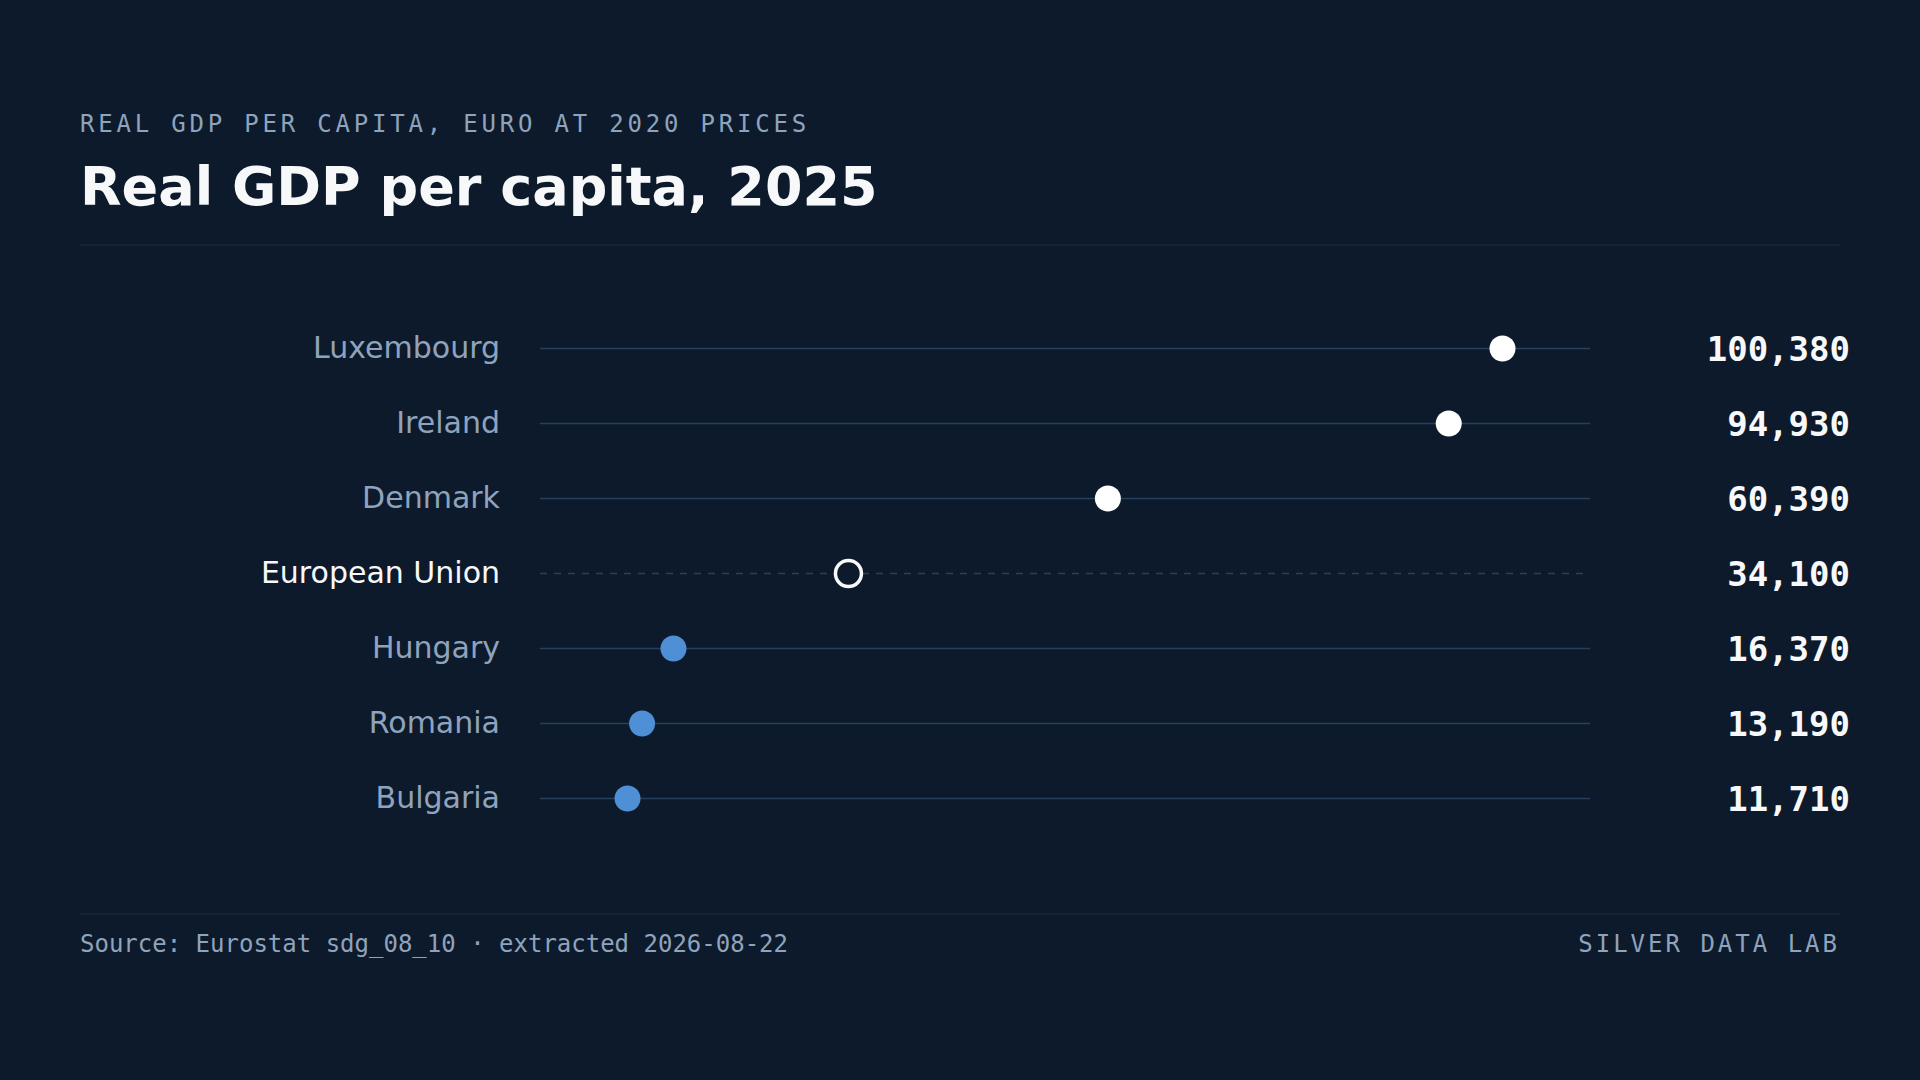
EU real GDP per capita was 34,250 euro in 2025, at 2020 prices.
Employment Rates Vary Far More Between EU Regions Than Between Countries
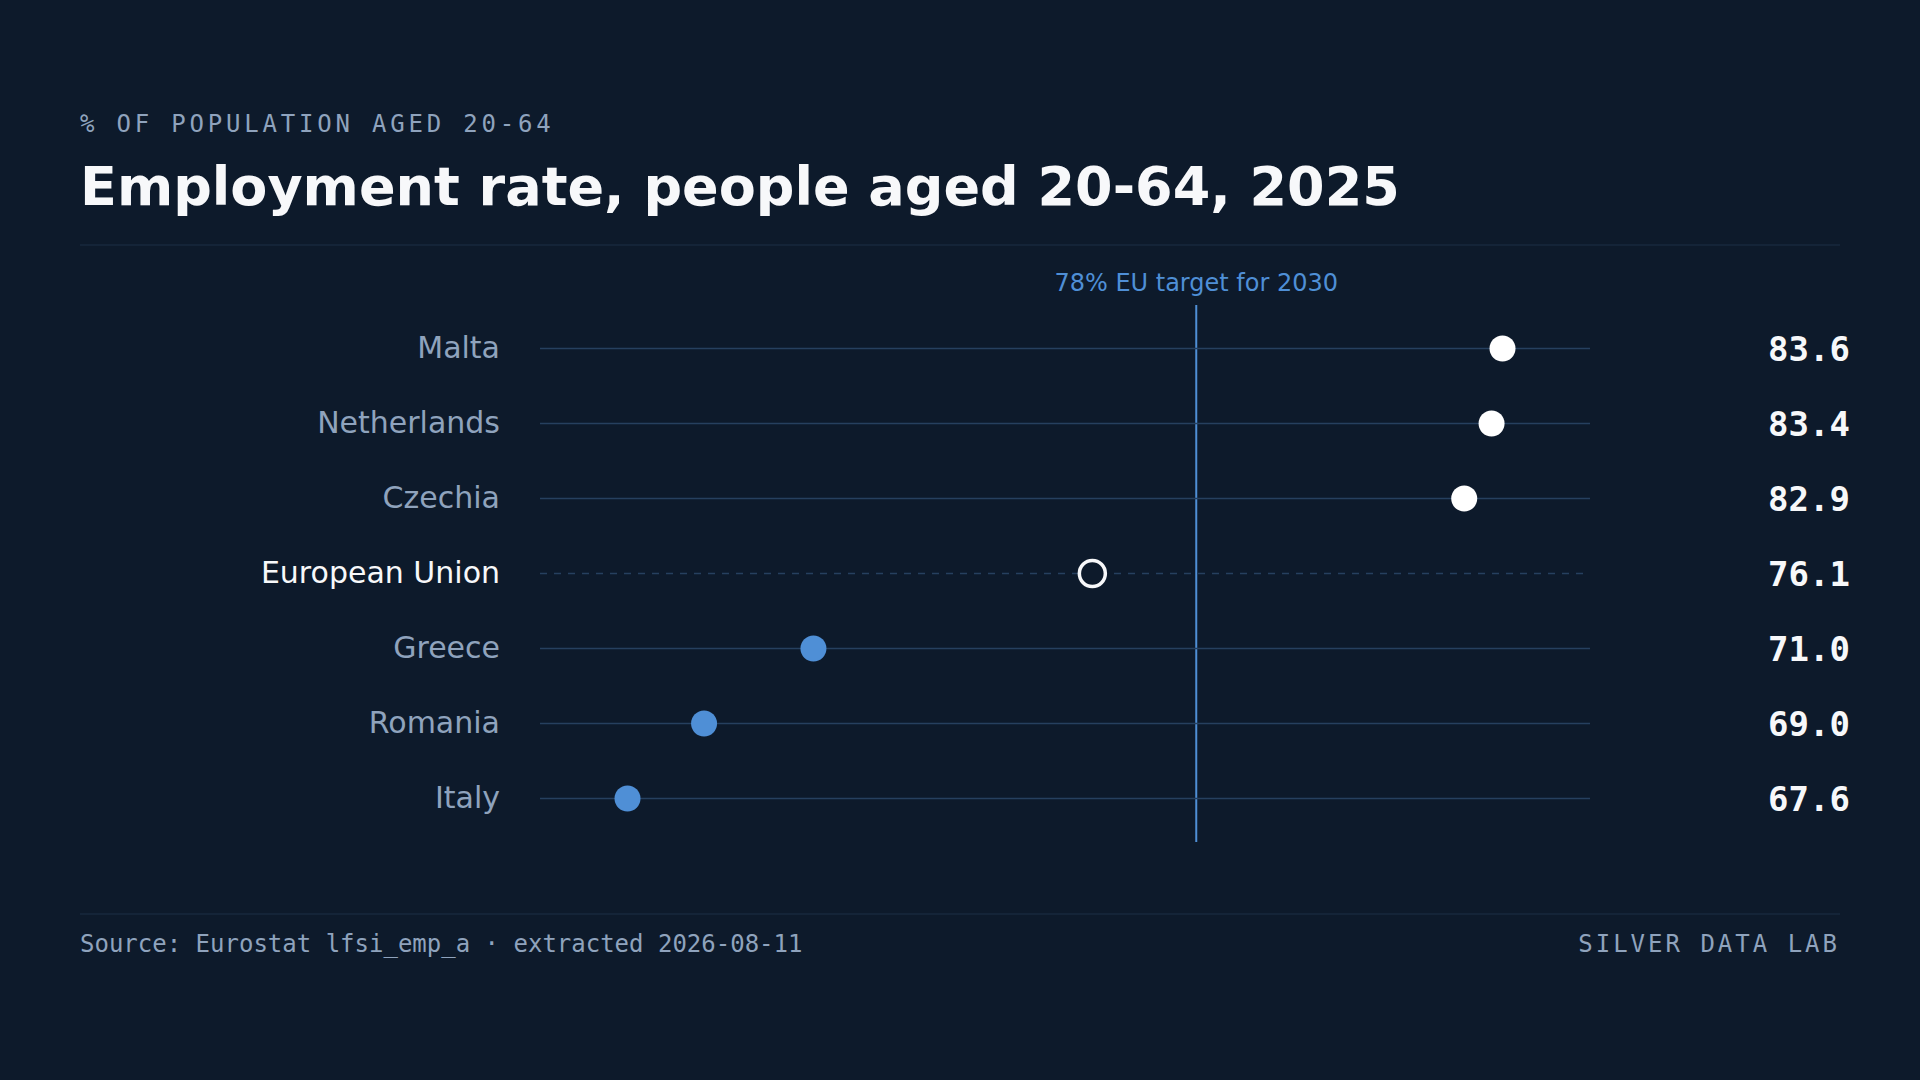
76.1% of people aged 20 to 64 were in employment across the EU in 2025, or 197.8 million people — the highest reading since the series began in 2009.
EU Countries Sell 61.1% of Their Goods Exports to Each Other
61.1% of the goods exported by EU Member States in 2025 went to other Member States.