The Dutch Are Likelier Than Bulgarians to Say Crime Is a Problem Locally
Silver Data Lab Research Desk · Statistical analysis · Published on 24 May 2026
- Data source
- Eurostat
- Reference period
- 2023
- Last updated
- 25 October 2026
Re-checked against the source on 11 August 2026. No value in its datasets has moved between the snapshots we hold. Every revision we have observed →
Key estimates
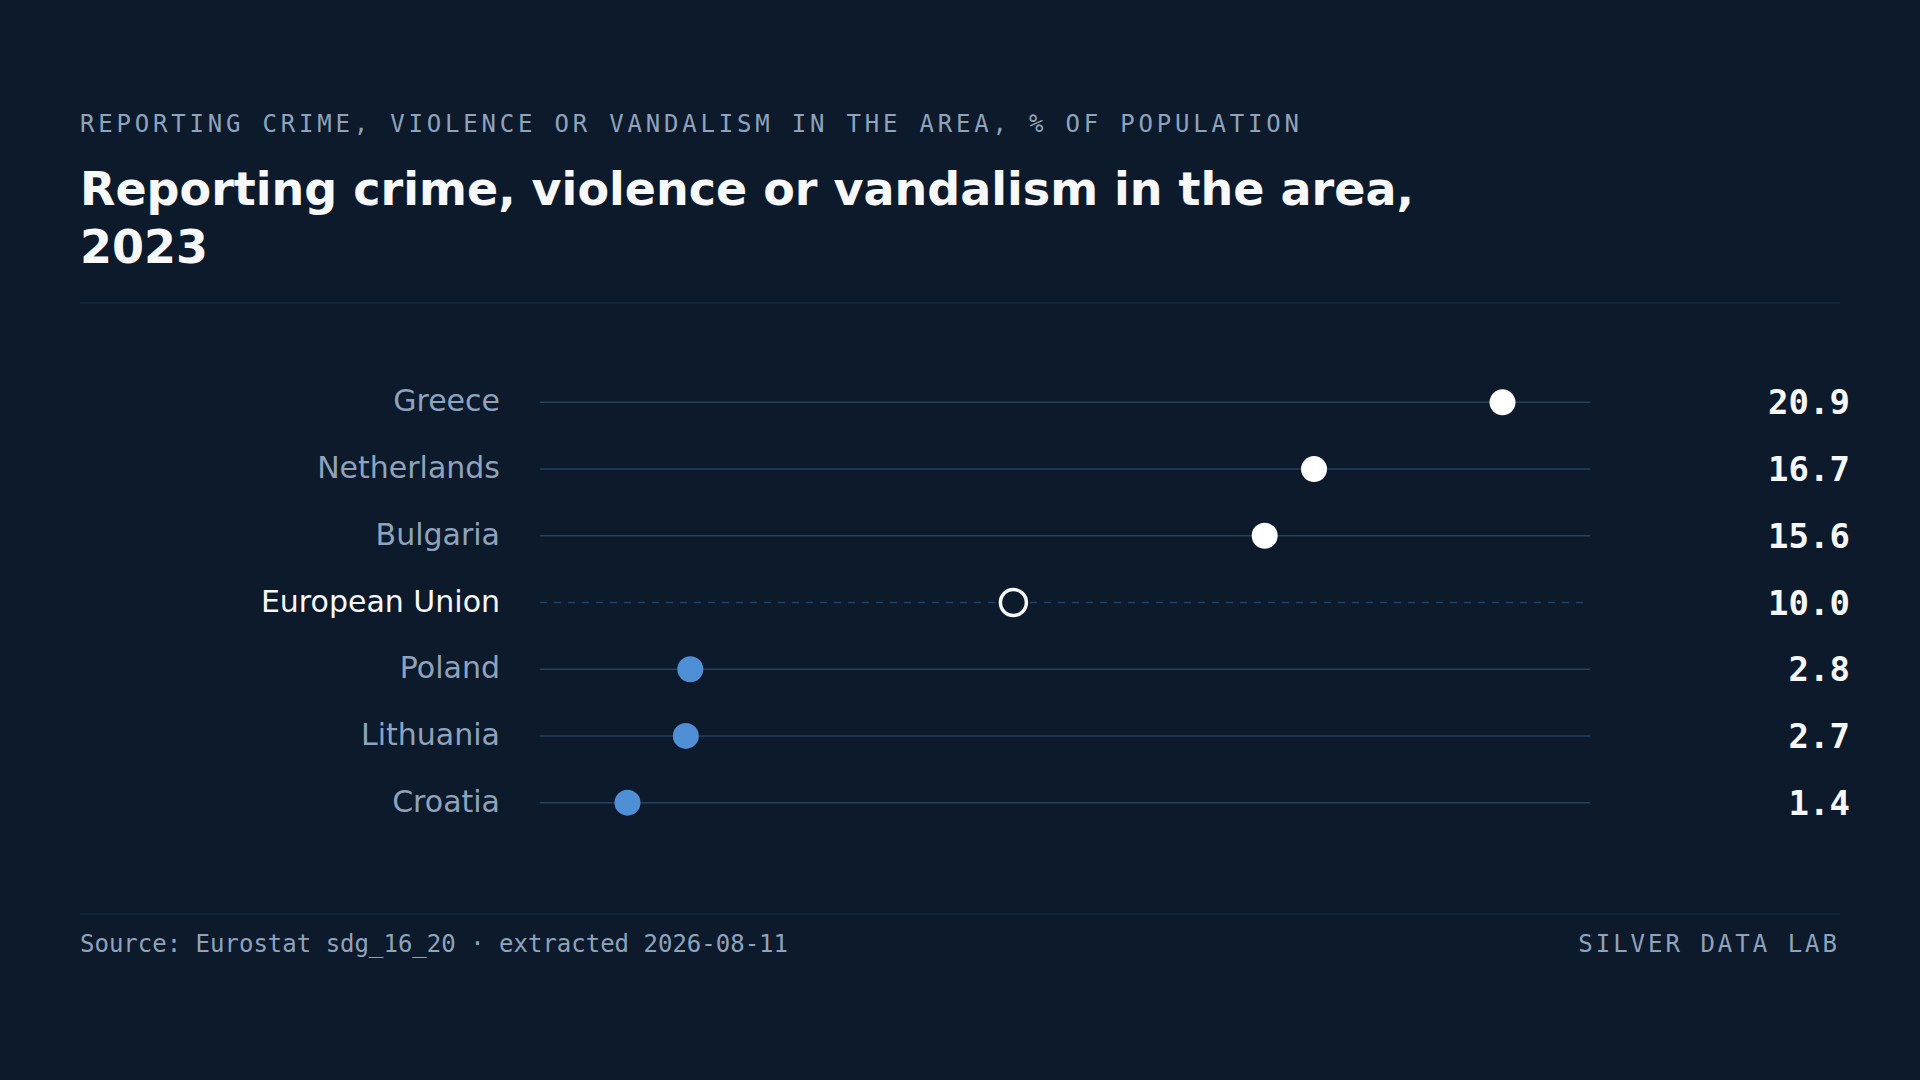
- 10.0% of the EU population reported crime, violence or vandalism in their area in 2023.
- Greece records 20.9%, the Netherlands 16.7% and Bulgaria 15.6%.
- Croatia records 1.4%, Lithuania 2.7% and Poland 2.8%.
- The Dutch rate is twelve times the Croatian one.
- This is a survey question about perception, not a count of offences, and the two do not rank countries the same way.
What people say about where they live
Households are asked whether they experience crime, violence or vandalism in their local area. The answer is a perception of the immediate environment, not a report of having been a victim and not a count of offences recorded by police.
Across the EU in 2023, 10.0% said yes.
The Netherlands
The Netherlands records 16.7%, second in the Union. That is the result that makes this indicator interesting rather than confirmatory.
It is one of the wealthiest Member States, records among the highest life satisfaction, the lowest NEET rate in the Union and near-universal digital and material provision. On this measure it sits above Bulgaria, Romania and Italy.
Several things plausibly contribute and none is established here. The Netherlands is densely populated — Dutch regions are among the most crowded in the Union outside city-states — and urban density raises the visibility of vandalism and public disorder regardless of its level. Reporting norms may also differ: a population that expects a well-maintained public environment may register deterioration a population with lower expectations would not.
The important point is narrower than any of those explanations. A perception question does not measure the same thing as a crime statistic, and the Dutch position demonstrates it clearly enough that no further argument is needed.
Greece and Bulgaria
Greece records 20.9%, the highest in the Union, and Bulgaria 15.6%.
Both are Member States where this site records poor outcomes across a range of indicators: Greece has the highest unmet medical need, the highest housing cost overburden and the lowest life satisfaction after Bulgaria, which records the lowest of all.
Where perceived neighbourhood problems coincide with poor material conditions, the perception is more likely to be tracking something real about the local environment. That is a reasonable reading for Greece and Bulgaria and a poor one for the Netherlands, and the indicator does not tell you which case you are looking at.
The low end
Croatia records 1.4%, the lowest in the Union, with Lithuania at 2.7% and Poland at 2.8%.
A figure of 1.4% means roughly one person in seventy lives where crime, violence or vandalism is reported: the question is put to the household, and the rate counts the people in it. Whether Croatian neighbourhoods are genuinely twelve times more orderly than Dutch ones, or Croatians report differently, cannot be settled from this data.
Why it is published at all
Despite everything above, the indicator has a purpose. Perceived safety affects whether people walk, use public space, let children out and remain in a neighbourhood — behaviour that recorded crime statistics do not capture and that matters for how a place functions.
It should be read as a measure of how a population experiences its environment, which is what it is, and never as a measure of crime, which it is not.
Reporting crime, violence or vandalism in the area, 2023
| Country | % of population | Gap to EU averagepercentage points, derived |
|---|---|---|
| Greece | 20.9 | +10.9 |
| Netherlands | 16.7 | +6.7 |
| Bulgaria | 15.6 | +5.6 |
| European Unionaggregate | 10.0 | — |
| Poland | 2.8 | −7.2 |
| Lithuania | 2.7 | −7.3 |
| Croatia | 1.4 | −8.6 |
This table as data: CSV · JSON
Every Member State for this indicator+
Members see every Member State for this indicator here, not only the rows the ranking prints. Become a Member
Embed this chart
Paste this code into a page. The frame carries the source and the extraction date, and links back to the study.
What these figures cannot tell you
- Perception, not incidence
- The question asks what households report about their area, not what offences occurred. Recorded crime statistics rank Member States differently, and neither series validates the other.
- Reporting norms differ between countries
- What counts as a problem worth reporting depends on expectations about public order. Populations accustomed to a well-maintained environment may register deterioration that others would not, which affects cross-country comparison directly.
- Density affects visibility
- Vandalism and public disorder are more visible where people live closer together, which is one reason a perception measure may diverge from incidence. This study cannot weigh it: it declares no population-density data, so this is a reason for caution and not a finding of the ranking.
- 2023, not 2025
- Eurostat publishes no values for this indicator for 2024 or 2025 at the extraction date, so this study uses 2023 and is not comparable with the 2025 readings elsewhere on this site.
Frequently asked questions
- How many Europeans report crime in their neighbourhood?
- 10.0% of the EU population reported crime, violence or vandalism in their area in 2023. The figure comes from a household survey question and is not a count of recorded offences.
- Which EU country reports the most neighbourhood crime?
- Greece at 20.9%, followed by the Netherlands at 16.7% and Bulgaria at 15.6%. The Dutch position is the one that shows this measure is not a crime statistic: it is among the Union's wealthiest Member States with the lowest NEET rate.
- Which reports the least?
- Croatia at 1.4%, Lithuania at 2.7% and Poland at 2.8%. A rate of 1.4% means roughly one person in seventy lives in a household reporting any problem of this kind.
- Does this measure actual crime?
- No. It measures what households say about their local area, which is affected by population density and by what people expect of public space. Recorded crime statistics rank Member States differently, and this indicator should be read as perceived environment rather than as crime.
Methodological note
Eurostat collects this indicator through EU-SILC as a household question on whether crime, violence or vandalism occurs in the local area. This study uses the total population regardless of poverty status or household composition.
Values are for 2023. Eurostat publishes no values for 2024 or 2025 at the extraction date, which is why an older reference year is used.
The ratio between the Dutch and Croatian rates is derived by Silver Data Lab. The comparisons with life satisfaction, unmet medical need, housing costs and population density draw on companion studies on this site.
Source data
The underlying series can be inspected and re-downloaded from the Eurostat data browser. The filters below are the ones applied.
Population reporting occurrence of crime, violence or vandalism in their area
sdg_16_20
- Filters applied:
- freq=A · hhcomp=TOTAL · rskpovth=TOTAL · unit=PC · time=2023
- Extracted:
- 2026-08-11
- Source last updated:
- 2026-05-21
Download the data
The data the study you have just read is built on, exactly as it was downloaded and archived.
Yours as a Member.
Data downloadable by Members
How to cite
Record the vintage as well as the study: the figures on this page are the ones extracted on the dates below.
Silver Data Lab Research Desk (2026). The Dutch Are Likelier Than Bulgarians to Say Crime Is a Problem Locally. Silver Data Lab, published 24 May 2026, last updated 25 October 2026. https://www.silverdatalab.com/studies/crime-and-safety-in-the-eu
- Data: Eurostat, Population reporting occurrence of crime, violence or vandalism in their area (sdg_16_20), filters freq=A, hhcomp=TOTAL, rskpovth=TOTAL, unit=PC, time=2023; extracted 2026-08-11; source last updated 2026-05-21. https://doi.org/10.2908/sdg_16_20
Silver Data Lab's analysis is licensed CC BY 4.0. The statistics remain their publisher's and keep its terms of reuse.
Ask the research desk
A question about this study — a definition, a filter, a break in the series, what the figures can and cannot support — answered by the desk that made the extraction.
Members can write to the research desk
Studies where the same country leads or trails
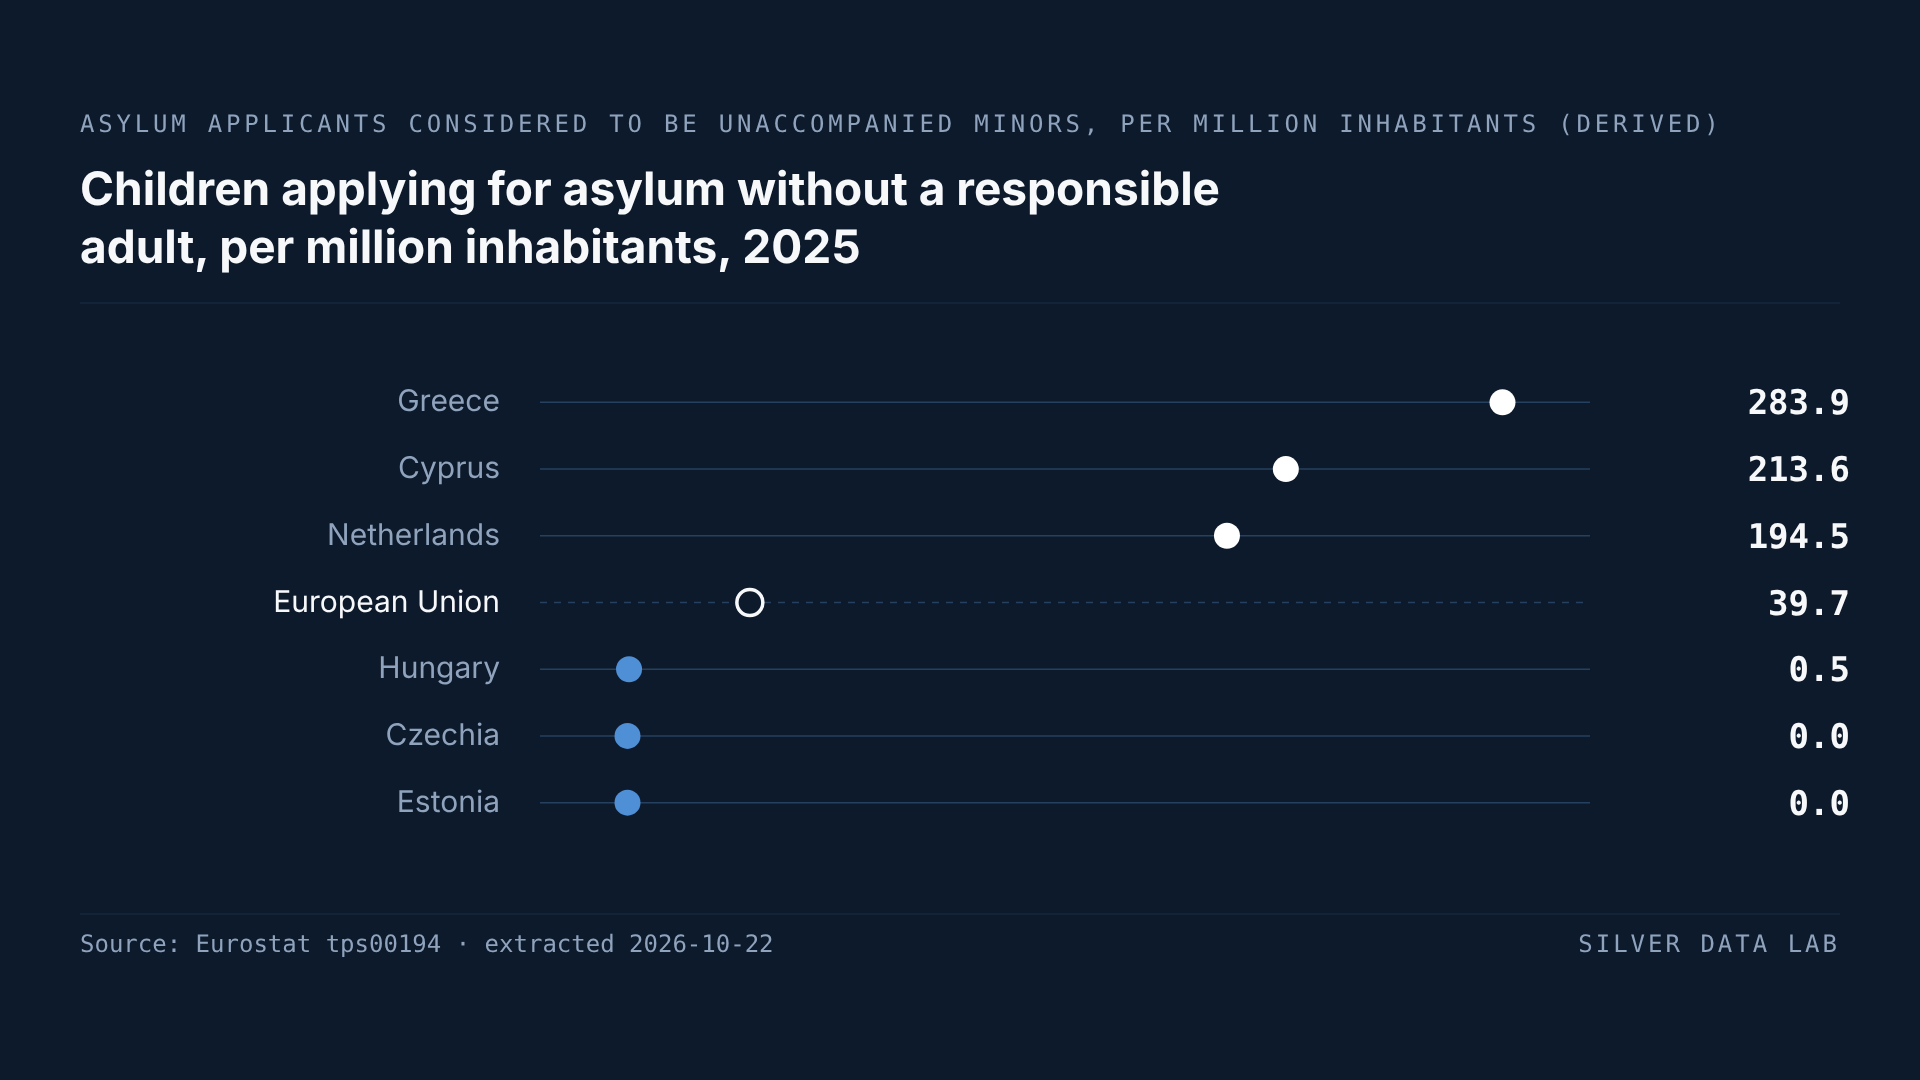
45.9% Fewer Children Sought Asylum Alone in the EU Than a Year Earlier
In 2025, 17,930 children applied for asylum in the EU without a parent or another adult responsible for them, against 33,160 in 2024: a derived fall of 45.9%, to the lowest figure since 2020.
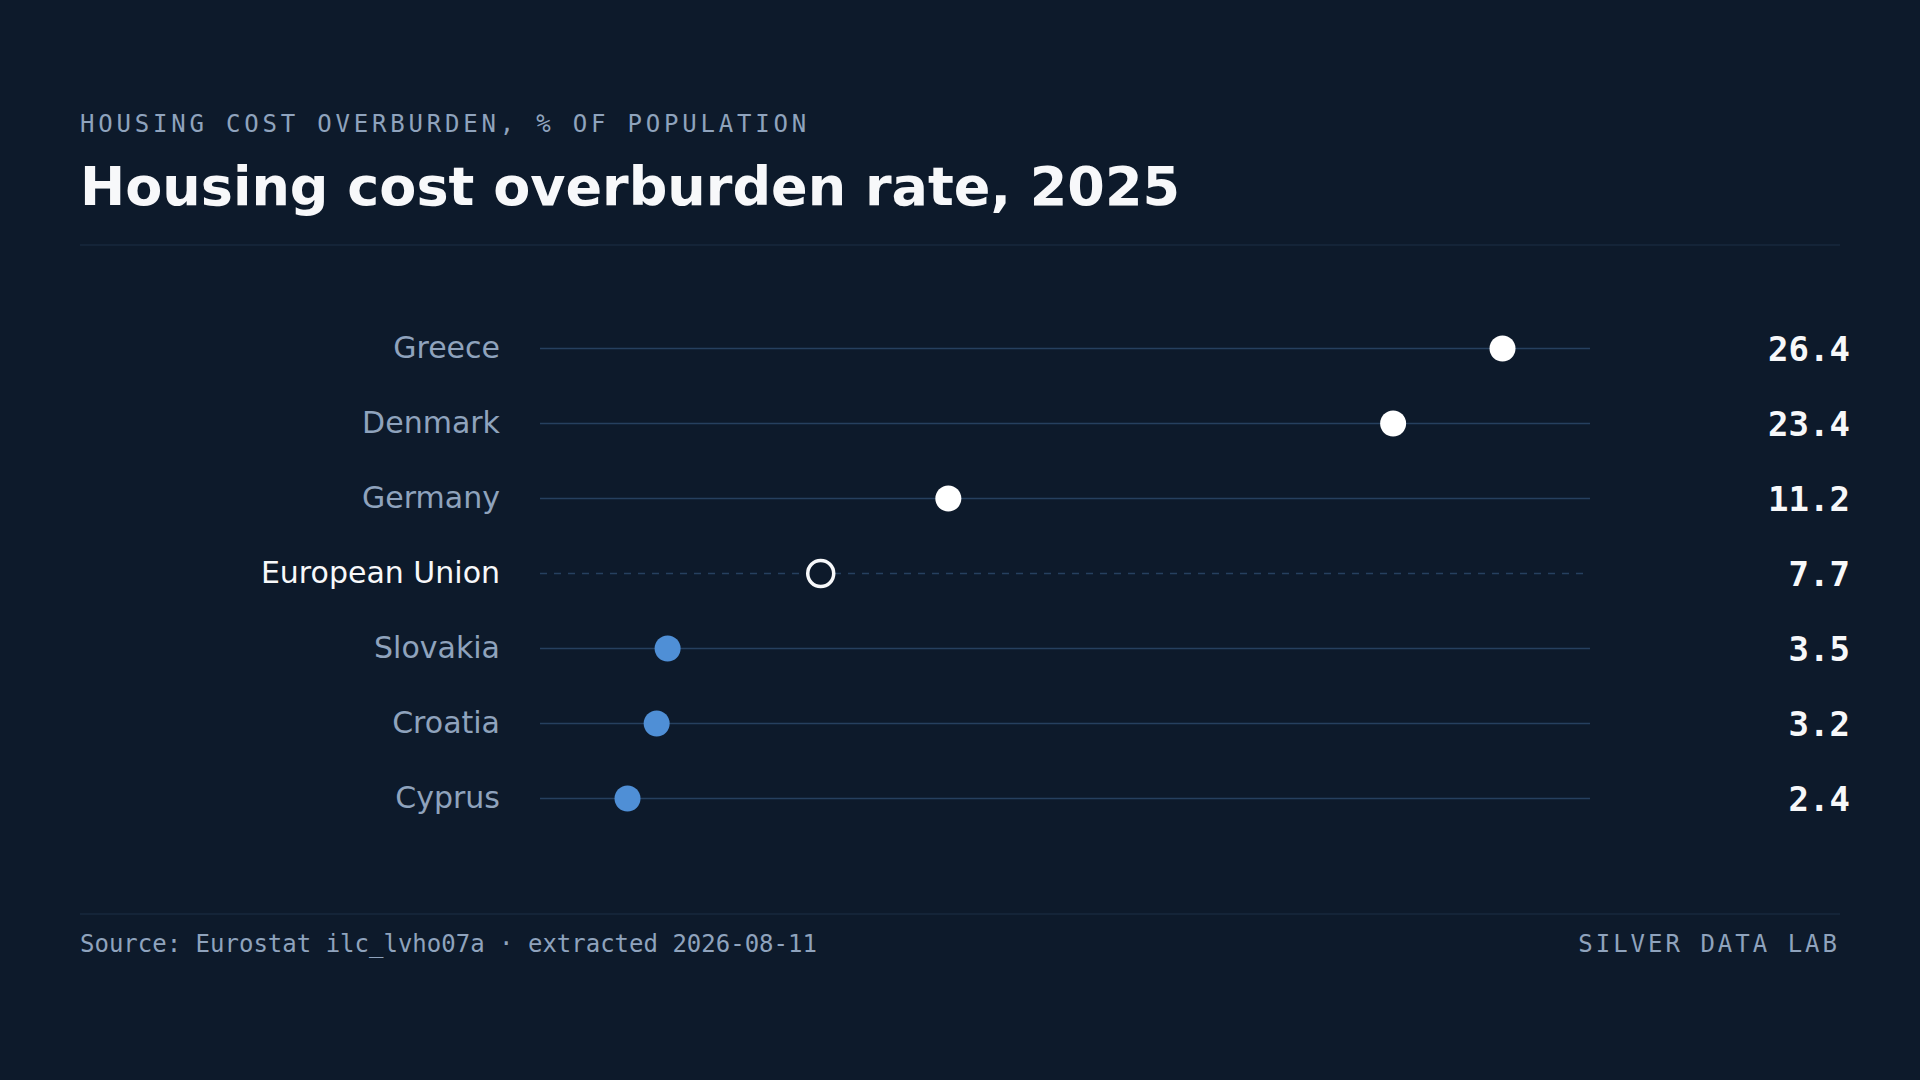
A Quarter of Greeks Spend More Than 40% of Income on Housing
7.7% of the EU population spent more than 40% of disposable income on housing in 2025.
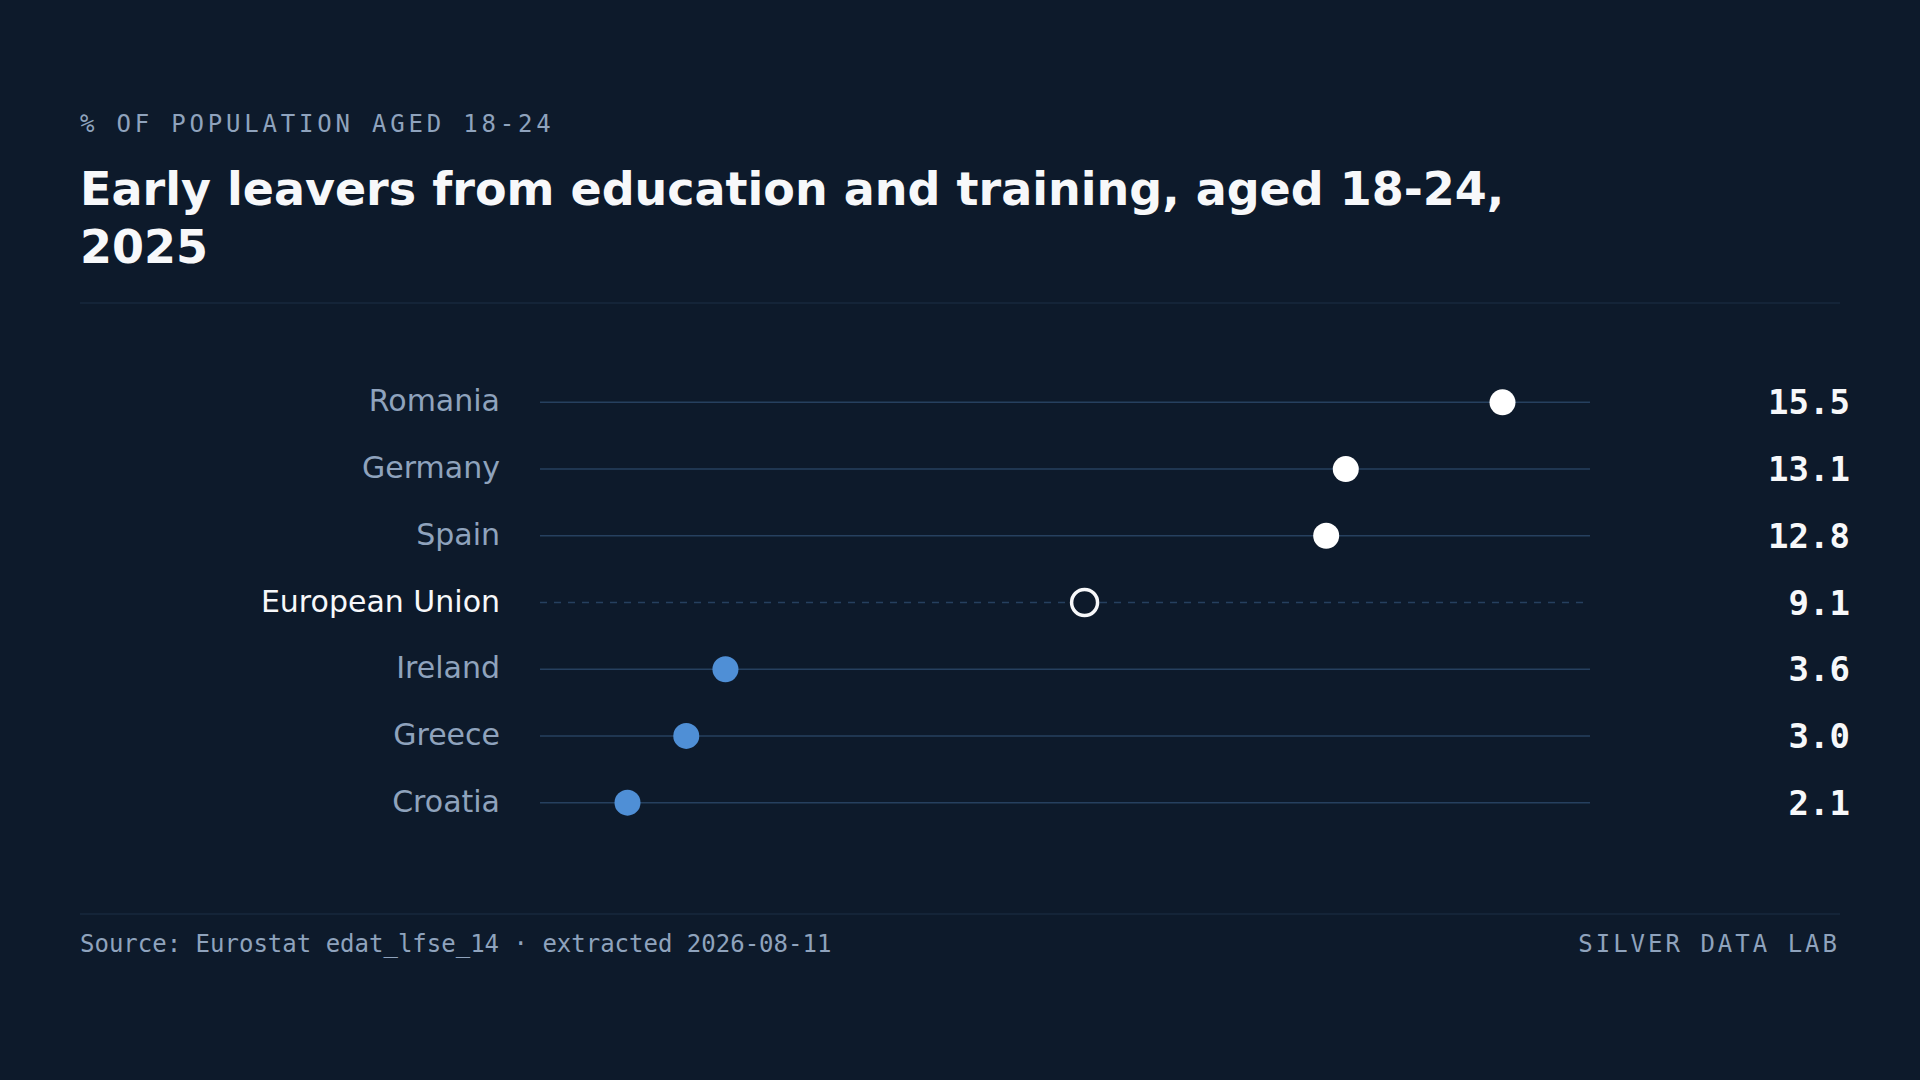
Germany Has the EU's Second-Worst School Dropout Rate
9.1% of people aged 18 to 24 in the EU had left education with at most lower secondary schooling in 2025.