A Quarter of Greeks Spend More Than 40% of Income on Housing
Silver Data Lab Research Desk · Statistical analysis · Published on 11 June 2026
- Data source
- Eurostat
- Reference period
- 2025
- Last updated
- 21 October 2026
Re-checked against the source on 23 October 2026. 41 values in its datasets moved between snapshots, 7 of them figures stated on this page. Every revision we have observed →
Key estimates
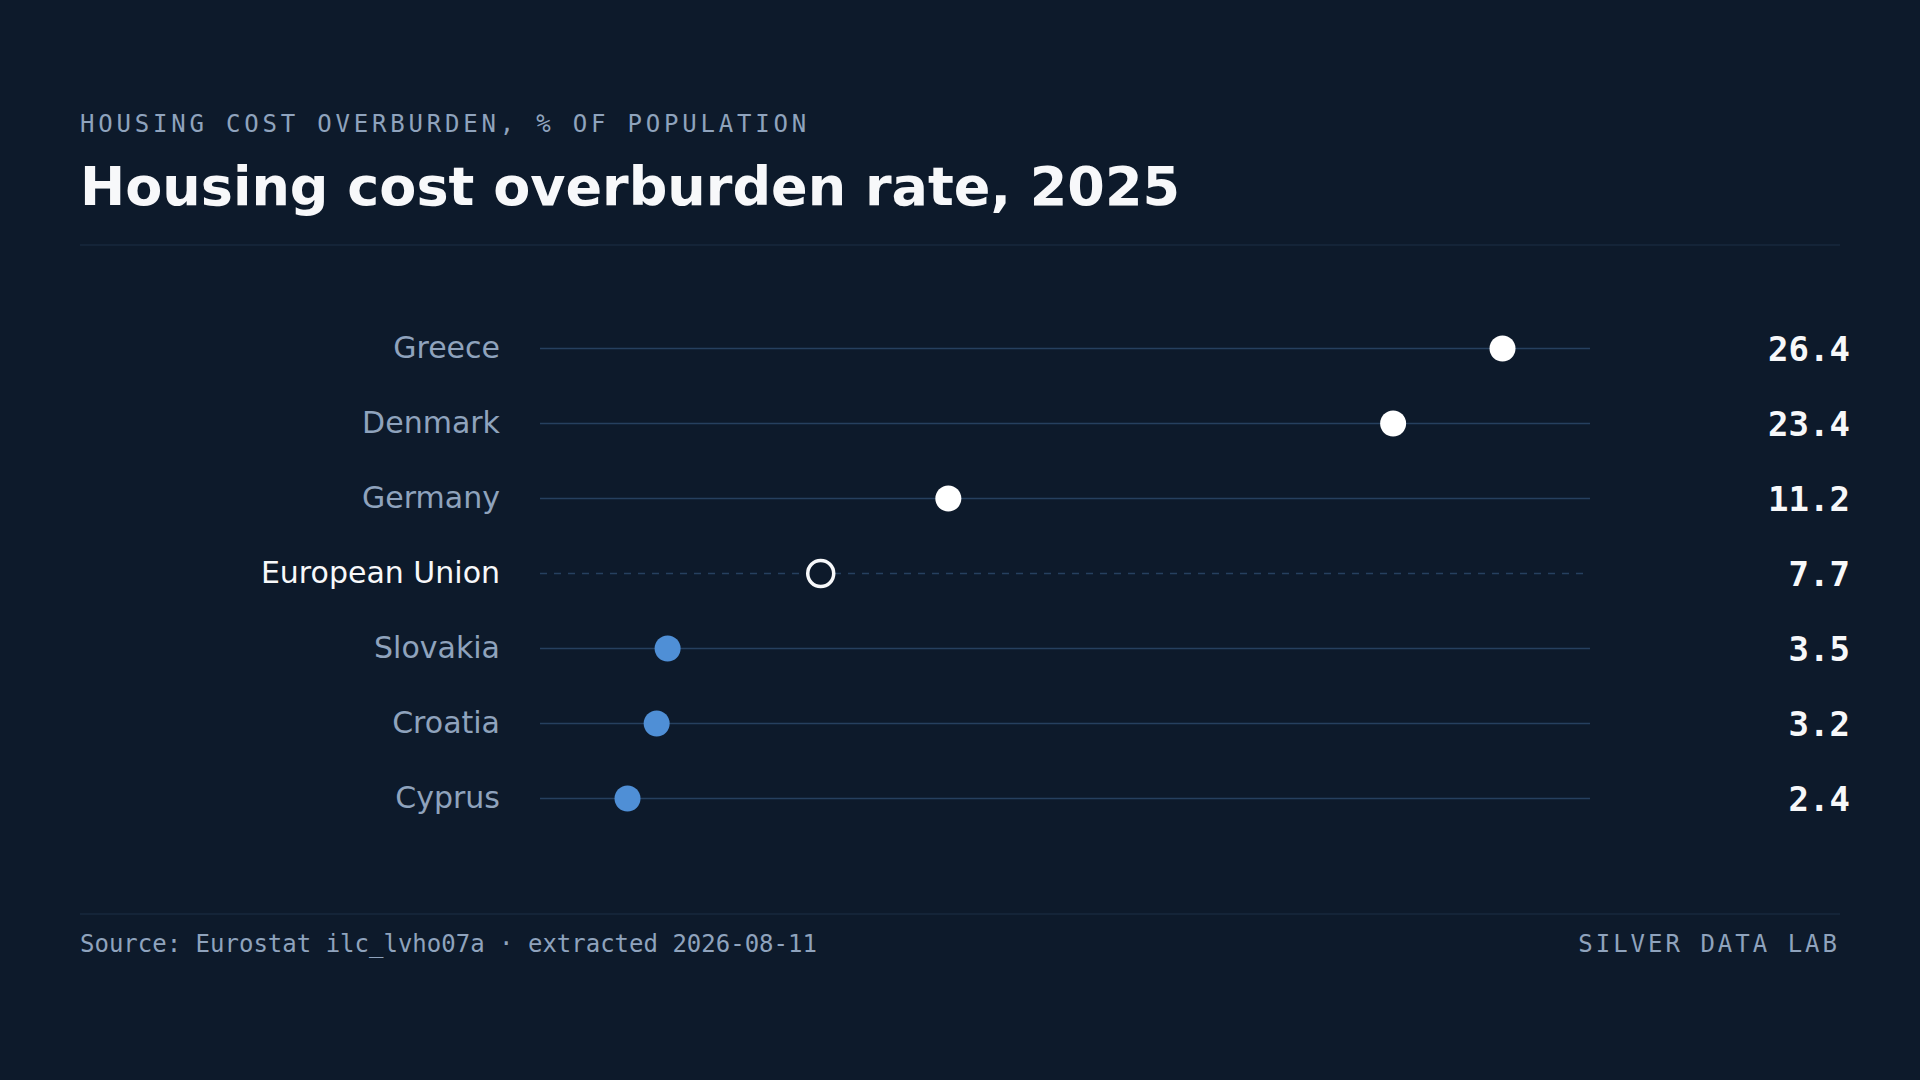
- 7.7% of the EU population spent more than 40% of disposable income on housing in 2025.
- Greece records 26.4%, more than one person in four. Denmark records 14.7%, a value Eurostat flags as a break in series.
- Cyprus records 2.4%, Croatia 3.2% and Slovakia 3.5%.
- Only seven Member States are above the EU rate, so the average sits above the great majority of them.
- Greece and Denmark, the two highest, reach those positions through opposite mechanisms: low incomes in one, high rents and a large rental sector in the other.
A threshold, not a scale
The housing cost overburden rate counts people whose housing costs exceed 40% of their disposable income, after housing allowances are deducted. It is a threshold measure: someone at 39% is not counted and someone at 41% is.
Across the EU in 2025, 7.7% of the population was above it.
Greece far ahead, Denmark second
Greece records 26.4%, far ahead of Denmark in second place at 14.7% and Germany in third at 11.2%.
Eurostat flags the Danish value as a break in series, so it is not strictly comparable with earlier years. The eleven years before it were steady: Denmark recorded between 14.1% and 15.7% in every year from 2014 to 2024, including 14.6% in 2024, and the 2025 reading falls inside that range.
Greece and Denmark reach the top by opposite routes.
Greek housing costs are not high by European standards; Greek incomes are low. The Greek at-risk-of-poverty rate is among the Union's highest, and Greek labour costs have risen more slowly than almost anywhere else in the Union — unit labour costs 10.6% above their 2020 level against an EU average of 19.1%, the second-lowest increase of the twenty-seven Member States, after Cyprus. A moderate housing cost against a low income crosses the 40% line easily.
That is a cost per unit of output and not a wage: it rises when pay outpaces productivity and falls when productivity outpaces pay, so it is evidence about Greek costs rather than a direct measurement of Greek pay. The unit labour cost study on this site sets out what it does and does not say.
Denmark is the reverse. Danish incomes are among the highest in the Union, and Danish housing costs are higher still. Denmark also has a large rental sector, and renters at market prices are the group this indicator picks up: owners with a paid-off mortgage have low housing costs by construction, so a country of owner-occupiers records a low rate almost automatically. That is why Denmark is the Union's second-highest on this measure, as it was in 2024.
The home ownership study on this site records the tenure split that sits underneath this.
An average above almost everyone
Only seven of the twenty-seven Member States are above the EU rate of 7.7%. Twenty are below it.
That distribution means the EU figure is not a typical national value. The seven above it are Greece, Denmark, Germany, Sweden at 10.8%, Estonia at 8.8%, Czechia at 8.2% and Luxembourg at 8.1%, and the weight in the average is Germany's: it has both a large population and a large rental sector.
Anyone reading 7.7% as the European norm is reading an average that three quarters of the Member States sit below.
The low end and what it conceals
Cyprus records 2.4%, Croatia 3.2%, Slovakia 3.5% and Slovenia 3.5%.
Some of them have very high home ownership, and in several cases high rates of ownership without a mortgage. A household that owns its home outright has almost no housing cost in this measure, whatever the house is worth.
That is the indicator's main blind spot. It measures the flow of housing payments, not the difficulty of acquiring housing in the first place. A country where young people cannot buy and stay with their parents instead will record an excellent overburden rate, and the overcrowding study on this site shows what that looks like from the other side.
Housing cost overburden rate, 2025
| Country | % of population | Gap to EU averagepercentage points, derived |
|---|---|---|
| Greece | 26.4 | +18.7 |
| Denmark | 14.7b | +7.0 |
| Germany | 11.2 | +3.5 |
| European Unionaggregate | 7.7 | — |
| Slovakia | 3.5b | −4.2 |
| Croatia | 3.2 | −4.5 |
| Cyprus | 2.4 | −5.3 |
Flags carried by the source on these values: b break in time series
This table as data: CSV · JSON
Every Member State for this indicator+
Members see every Member State for this indicator here, not only the rows the ranking prints. Become a Member
Embed this chart
Paste this code into a page. The frame carries the source and the extraction date, and links back to the study.
What these figures cannot tell you
- A threshold measure
- The rate counts people above 40% of disposable income and ignores how far above. Two countries with the same rate can have very different depths of housing stress, and someone just below the line is not counted at all.
- Outright owners have almost no housing cost
- Households owning without a mortgage record minimal costs by construction, so countries with high outright ownership score well regardless of how expensive housing is to acquire. This is the indicator's largest blind spot.
- It measures payments, not access
- A young adult who cannot afford to form a household and remains with their parents contributes nothing to this rate. The overcrowding and home ownership studies on this site cover that side.
- The Danish 2025 value is flagged as a break in series
- Eurostat withdrew the first Danish value it published for 2025 and has since published a new one, which it marks as a break in time series. At 14.7% it falls inside the range of 14.1% to 15.7% Denmark recorded in every year from 2014 to 2024, but the break means it is not strictly comparable with those years. Luxembourg's and Slovakia's 2025 values carry the same flag and Lithuania's is provisional.
- Net of housing allowances
- Housing costs are measured after housing benefits are deducted, so the rate reflects the generosity of national housing support as well as the cost of housing itself.
Frequently asked questions
- How many Europeans are overburdened by housing costs?
- 7.7% of the EU population spent more than 40% of disposable income on housing in 2025. Only seven of the twenty-seven Member States are above that figure, so it is not a typical national value.
- Which EU country has the worst housing cost burden?
- Greece, at 26.4% in 2025. Denmark is second at 14.7% and Germany third at 11.2%. Eurostat flags the Danish value as a break in series; Denmark was also second in 2024, at 14.6%.
- Why do Greece and Denmark both score badly?
- For opposite reasons. Greek housing costs are moderate but Greek incomes are low, so a modest cost crosses the 40% threshold. Danish incomes are among the Union's highest and Danish housing costs higher still, with a large rental sector — and renters at market prices are the group this measure picks up.
- Why do some countries score so well?
- Croatia at 3.2% and Slovakia at 3.5% have very high home ownership, much of it without a mortgage, and Cyprus at 2.4% is the lowest of all. A household owning outright has almost no housing cost in this measure, whatever the property is worth, so a low rate can coexist with housing being hard to acquire.
Methodological note
Eurostat publishes the housing cost overburden rate from EU-SILC as the share of the population living in households where total housing costs, net of housing allowances, exceed 40% of total disposable household income, also net of housing allowances.
This study uses the total population, both sexes, all ages, regardless of poverty status. Values are for 2025 and cover all 27 Member States.
The same table is extracted a second time across every year it covers, and that extraction is the source of the Danish figures for 2014 to 2024. Eurostat's own observation flags are read from the 2025 extraction: the Danish, Luxembourgish and Slovak values are marked as breaks in series and the Lithuanian one as provisional.
The count of Member States above and below the EU rate and the list of the seven above it are derived by Silver Data Lab. The unit labour cost figures are cited from the companion study's own extraction, declared below. The comparisons with income levels, home ownership and overcrowding draw on other studies on this site, each with its own extraction.
Source data
This study draws on 3 datasets from Eurostat. Each can be inspected and re-downloaded from its catalogue, and the filters below are the ones applied.
Housing cost overburden rate
ilc_lvho07a
- Filters applied:
- freq=A · unit=PC · rskpovth=TOTAL · age=TOTAL · sex=T · time=2025
- Extracted:
- 2026-10-21
- Source last updated:
- 2026-10-20
Housing cost overburden rate
ilc_lvho07a
- Filters applied:
- freq=A · unit=PC · rskpovth=TOTAL · age=TOTAL · sex=T
- Extracted:
- 2026-10-21
- Source last updated:
- 2026-10-20
Nominal unit labour cost
nama_10_lp_ulc
- Filters applied:
- freq=A · unit=I20 · na_item=NULC_PER · time=2025
- Extracted:
- 2026-10-23
- Source last updated:
- 2026-10-22
Download the data
The data the study you have just read is built on, exactly as it was downloaded and archived.
Yours as a Member.
Data downloadable by Members
How to cite
Record the vintage as well as the study: the figures on this page are the ones extracted on the dates below.
Silver Data Lab Research Desk (2026). A Quarter of Greeks Spend More Than 40% of Income on Housing. Silver Data Lab, published 11 June 2026, last updated 21 October 2026. https://www.silverdatalab.com/studies/housing-cost-overburden-in-the-eu
- Data: Eurostat, Housing cost overburden rate (ilc_lvho07a), filters freq=A, unit=PC, rskpovth=TOTAL, age=TOTAL, sex=T, time=2025; extracted 2026-10-21; source last updated 2026-10-20. https://doi.org/10.2908/ilc_lvho07a
- Data: Eurostat, Housing cost overburden rate (ilc_lvho07a), filters freq=A, unit=PC, rskpovth=TOTAL, age=TOTAL, sex=T; extracted 2026-10-21; source last updated 2026-10-20. https://doi.org/10.2908/ilc_lvho07a
- Data: Eurostat, Nominal unit labour cost (nama_10_lp_ulc), filters freq=A, unit=I20, na_item=NULC_PER, time=2025; extracted 2026-10-23; source last updated 2026-10-22. https://doi.org/10.2908/nama_10_lp_ulc
Silver Data Lab's analysis is licensed CC BY 4.0. The statistics remain their publisher's and keep its terms of reuse.
Ask the research desk
A question about this study — a definition, a filter, a break in the series, what the figures can and cannot support — answered by the desk that made the extraction.
Members can write to the research desk
Other studies on the same dataset
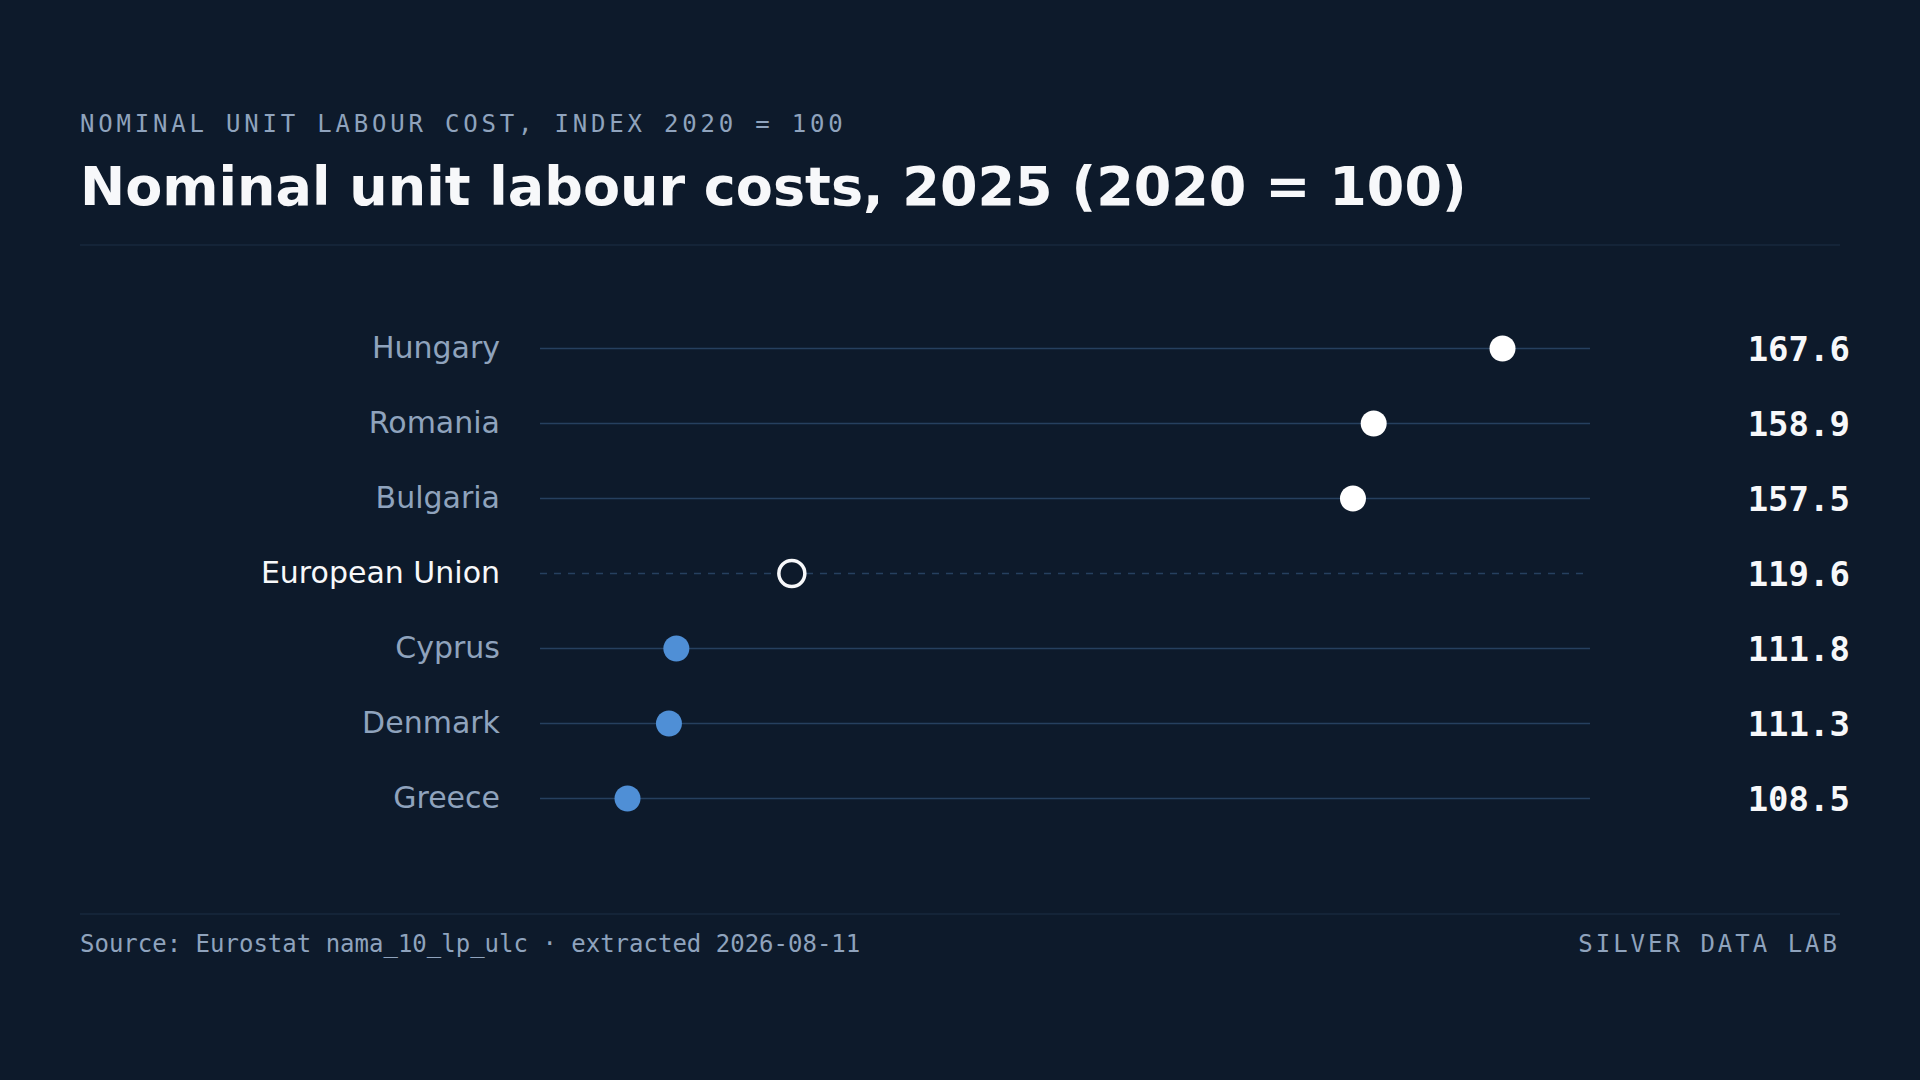
Hungary's Labour Cost per Unit of Output Rose by Over Half in Five Years
EU unit labour costs in 2025 stood at 119.1 against a 2020 base of 100 — 19.1% higher in five years.
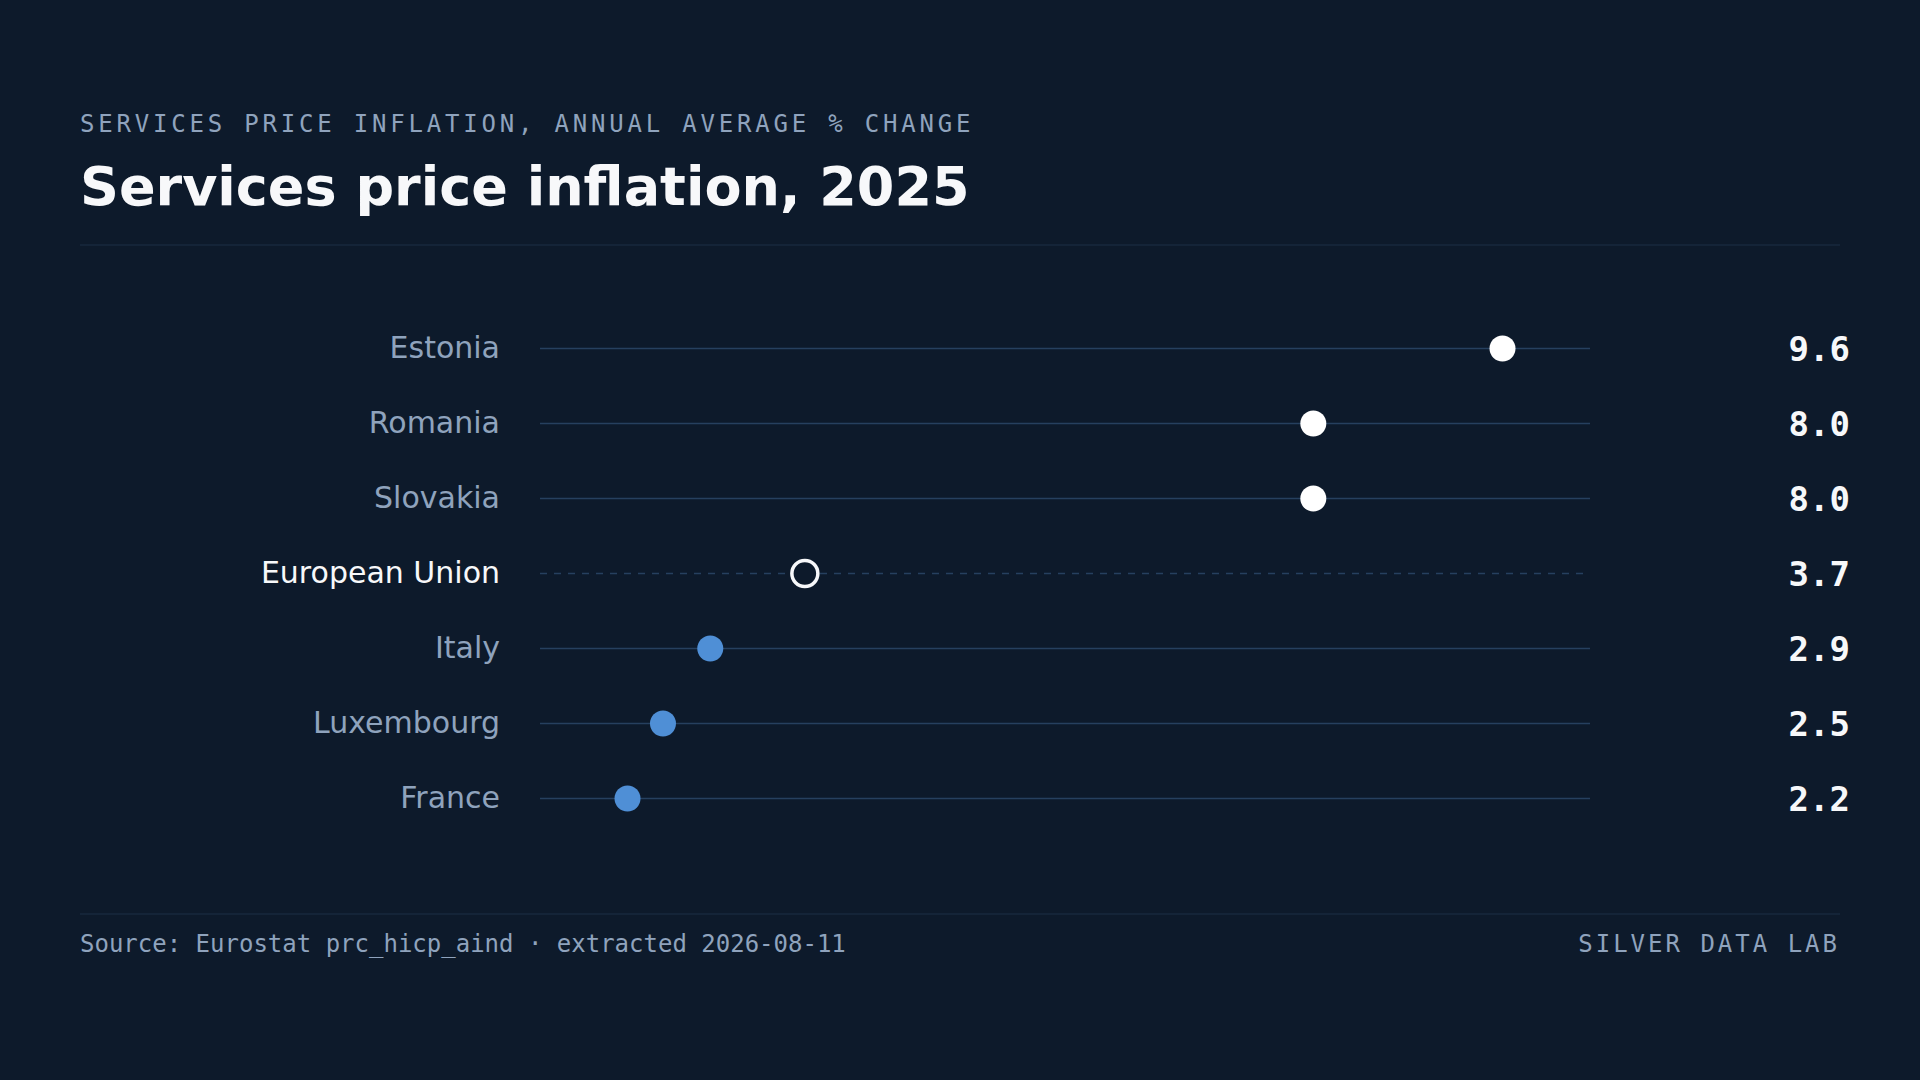
In One Year, EU Services Prices Rose While Energy Prices Fell
Services prices in the EU rose 3.7% in 2025, against 2.8% for food and -0.6% for energy.
Studies where the same country leads or trails
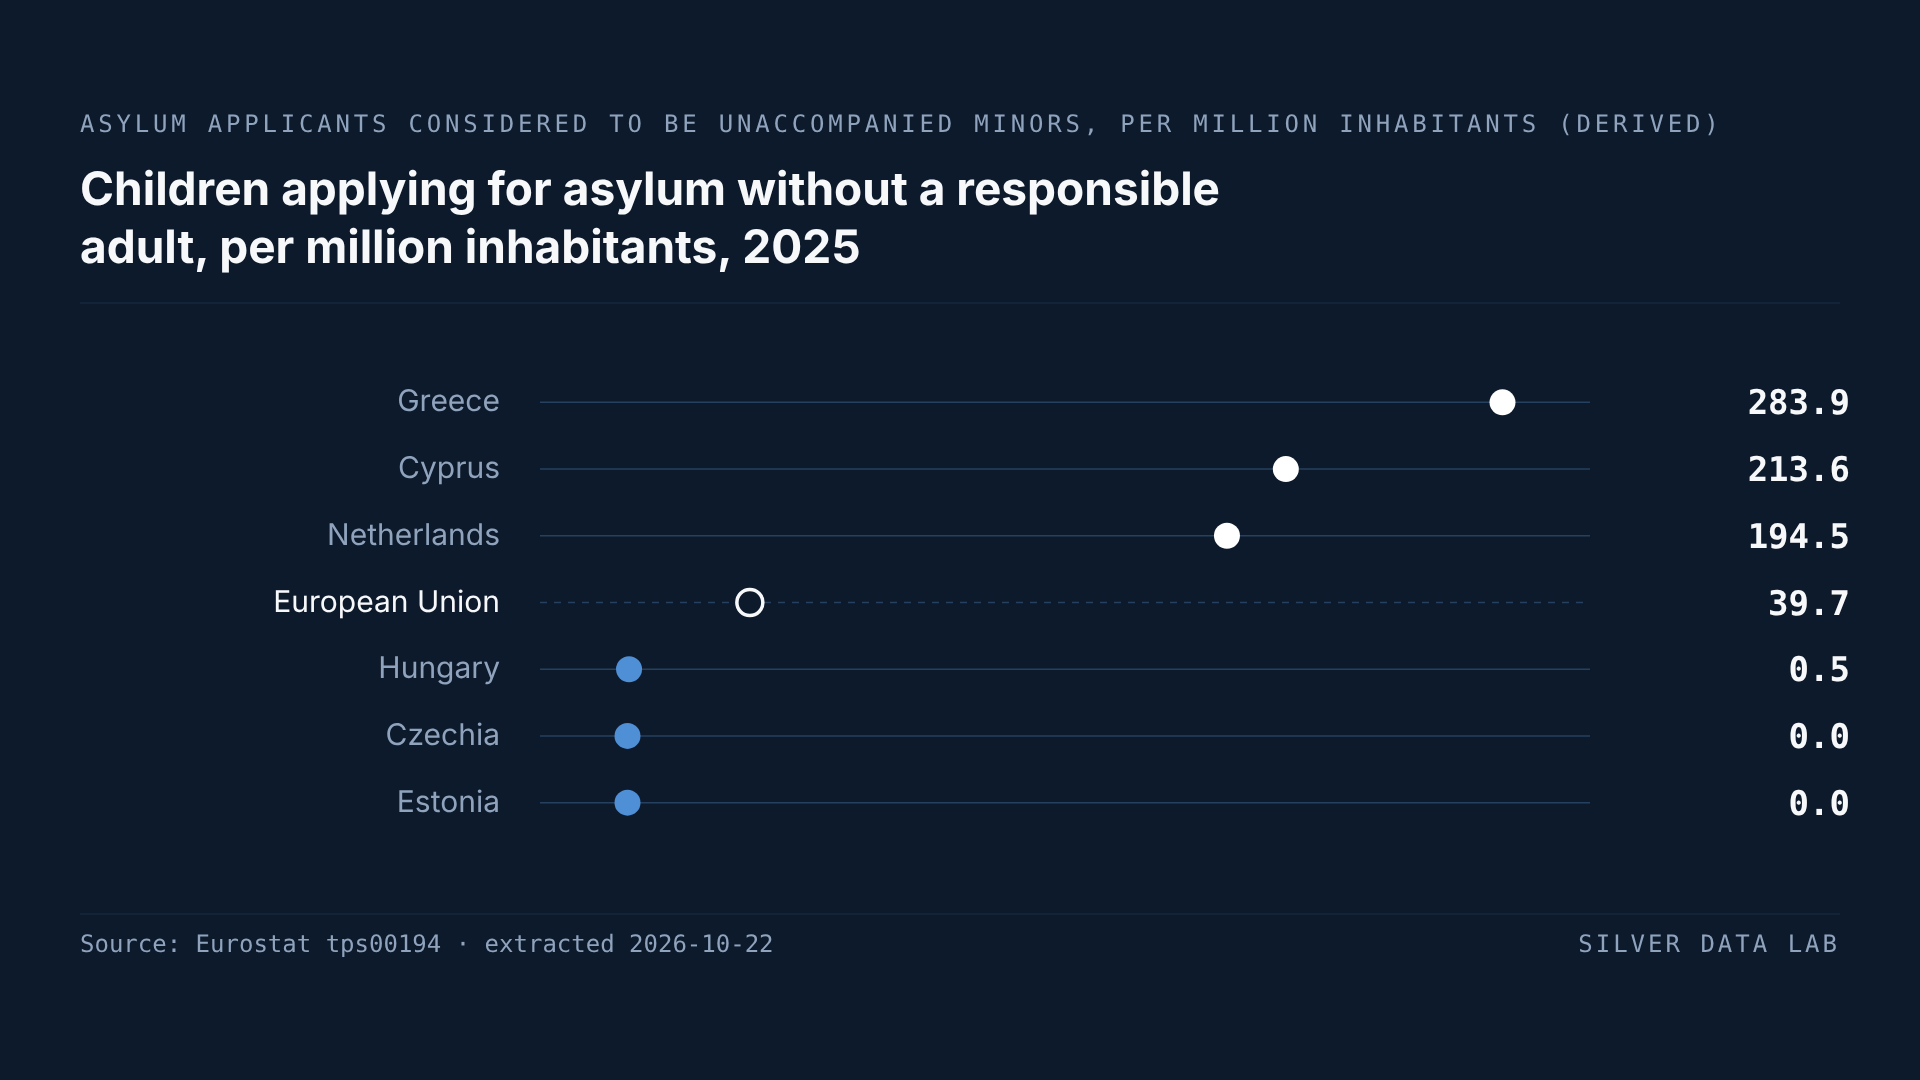
45.9% Fewer Children Sought Asylum Alone in the EU Than a Year Earlier
In 2025, 17,930 children applied for asylum in the EU without a parent or another adult responsible for them, against 33,160 in 2024: a derived fall of 45.9%, to the lowest figure since 2020.
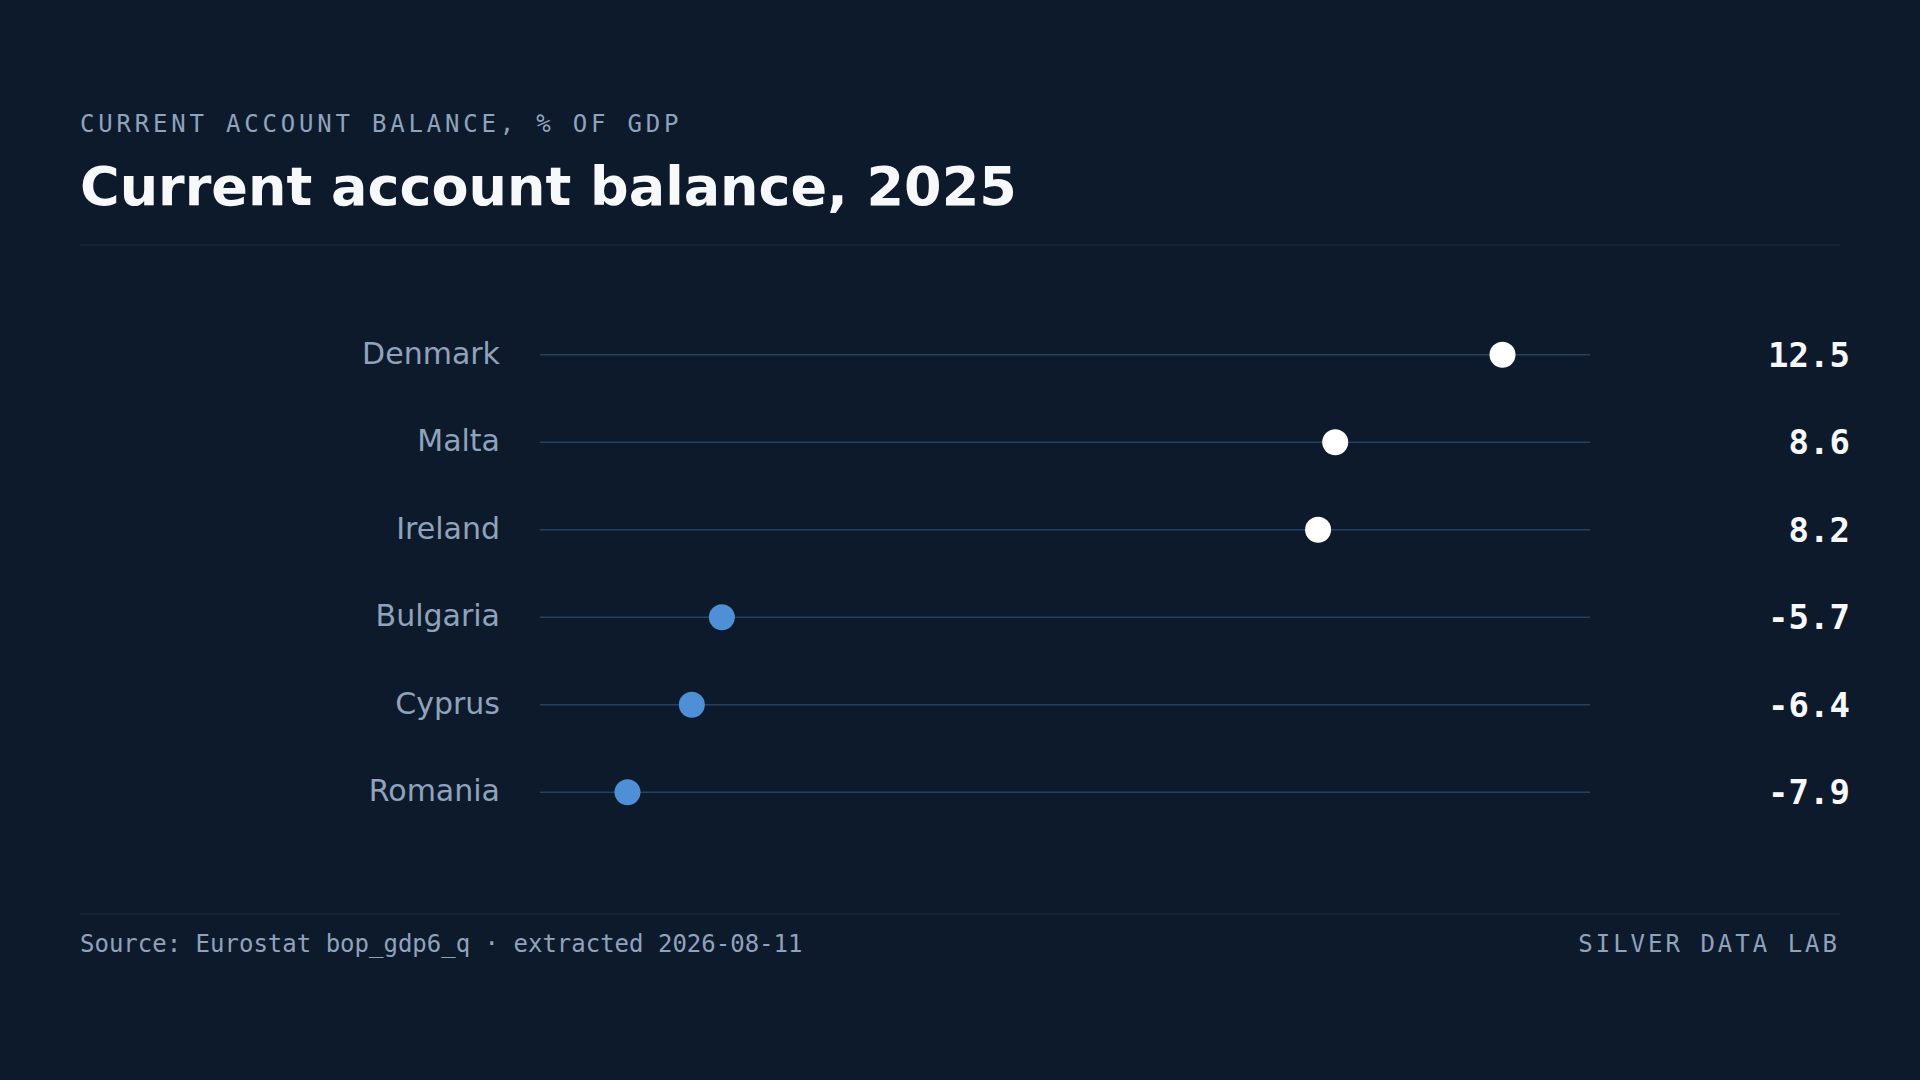
Denmark Has the EU's Biggest Surplus With the World, at 12.3% of GDP
Denmark ran a current account surplus worth 12.3% of GDP in 2025, the largest in the Union.
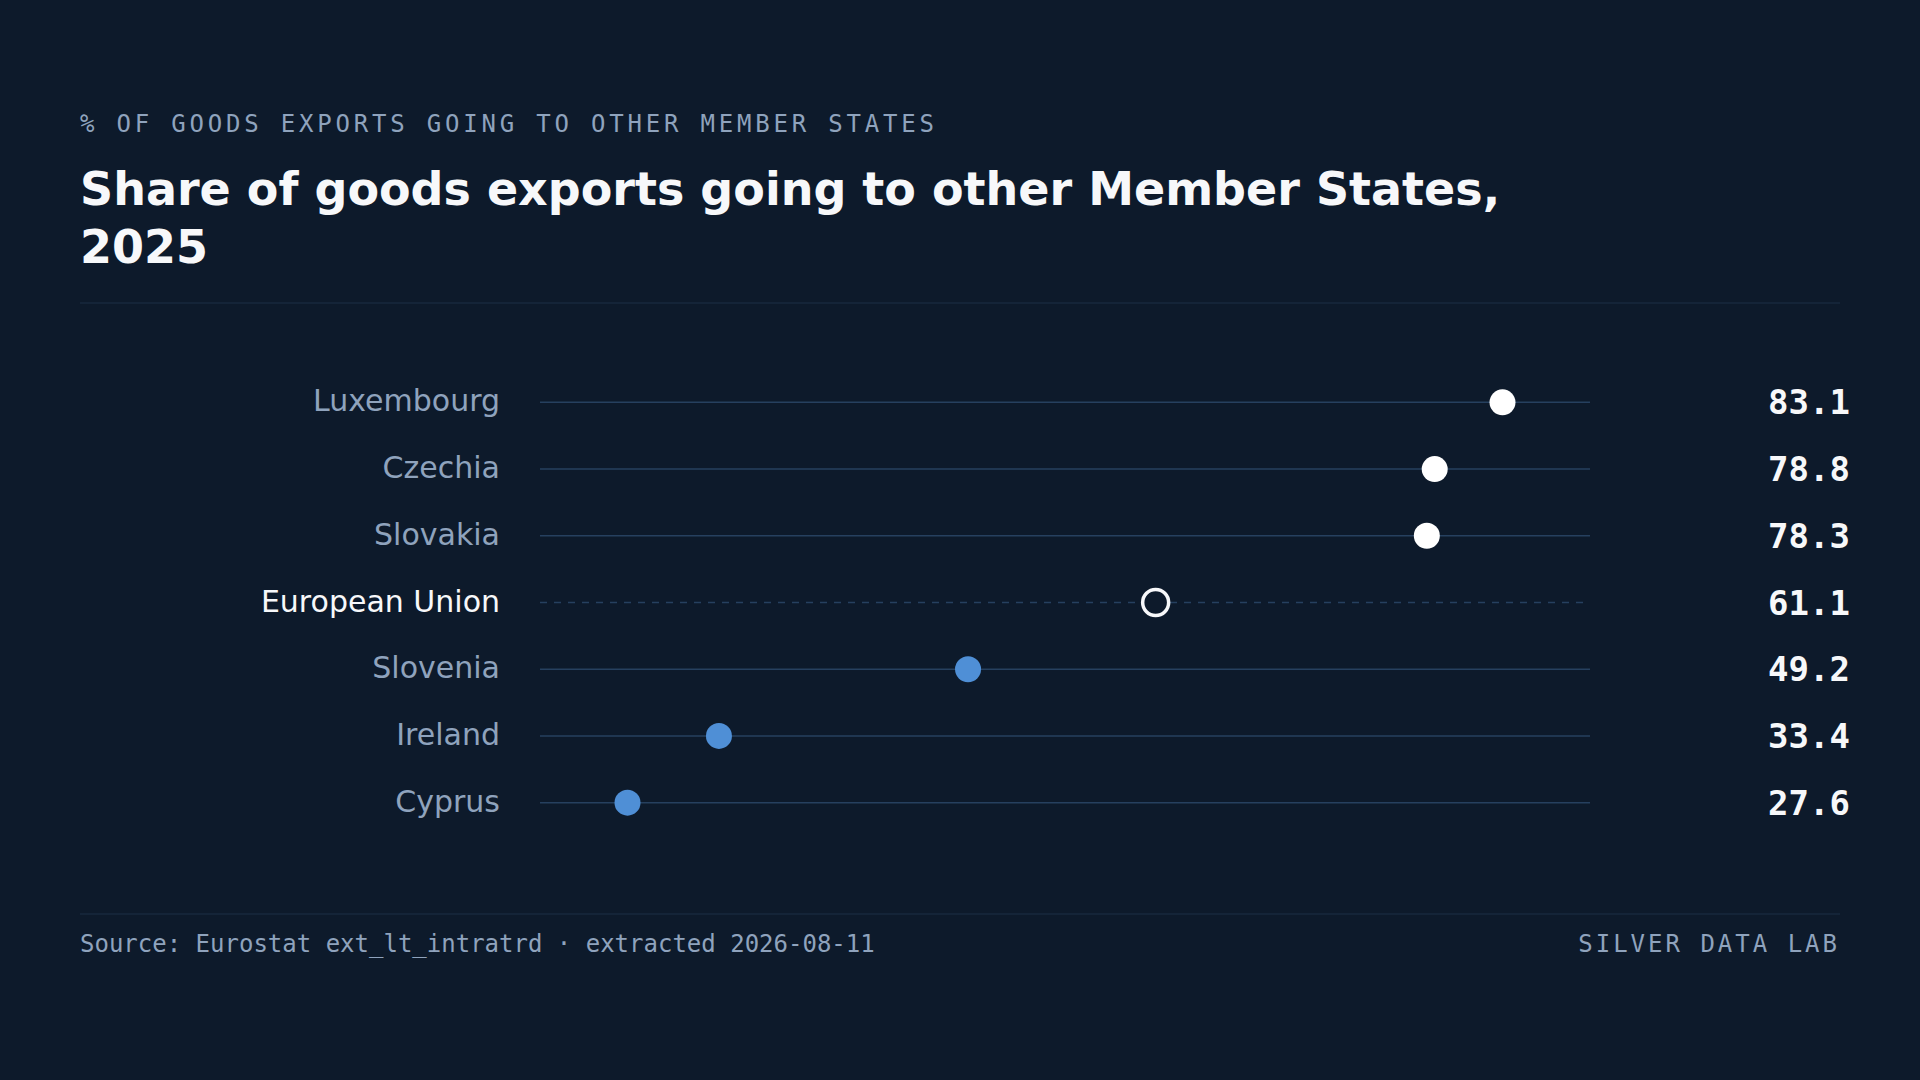
EU Countries Sell 61.1% of Their Goods Exports to Each Other
61.1% of the goods exported by EU Member States in 2025 went to other Member States.