Hungary's Labour Cost per Unit of Output Rose by Over Half in Five Years
Silver Data Lab Research Desk · Statistical analysis · Published on 07 August 2026
- Data source
- Eurostat
- Reference period
- 2025
- Last updated
- 21 October 2026
Re-checked against the source on 23 October 2026. 41 values in its datasets moved between snapshots, 8 of them figures stated on this page. Every revision we have observed →
Key estimates
- EU unit labour costs in 2025 stood at 119.1 against a 2020 base of 100 — 19.1% higher in five years.
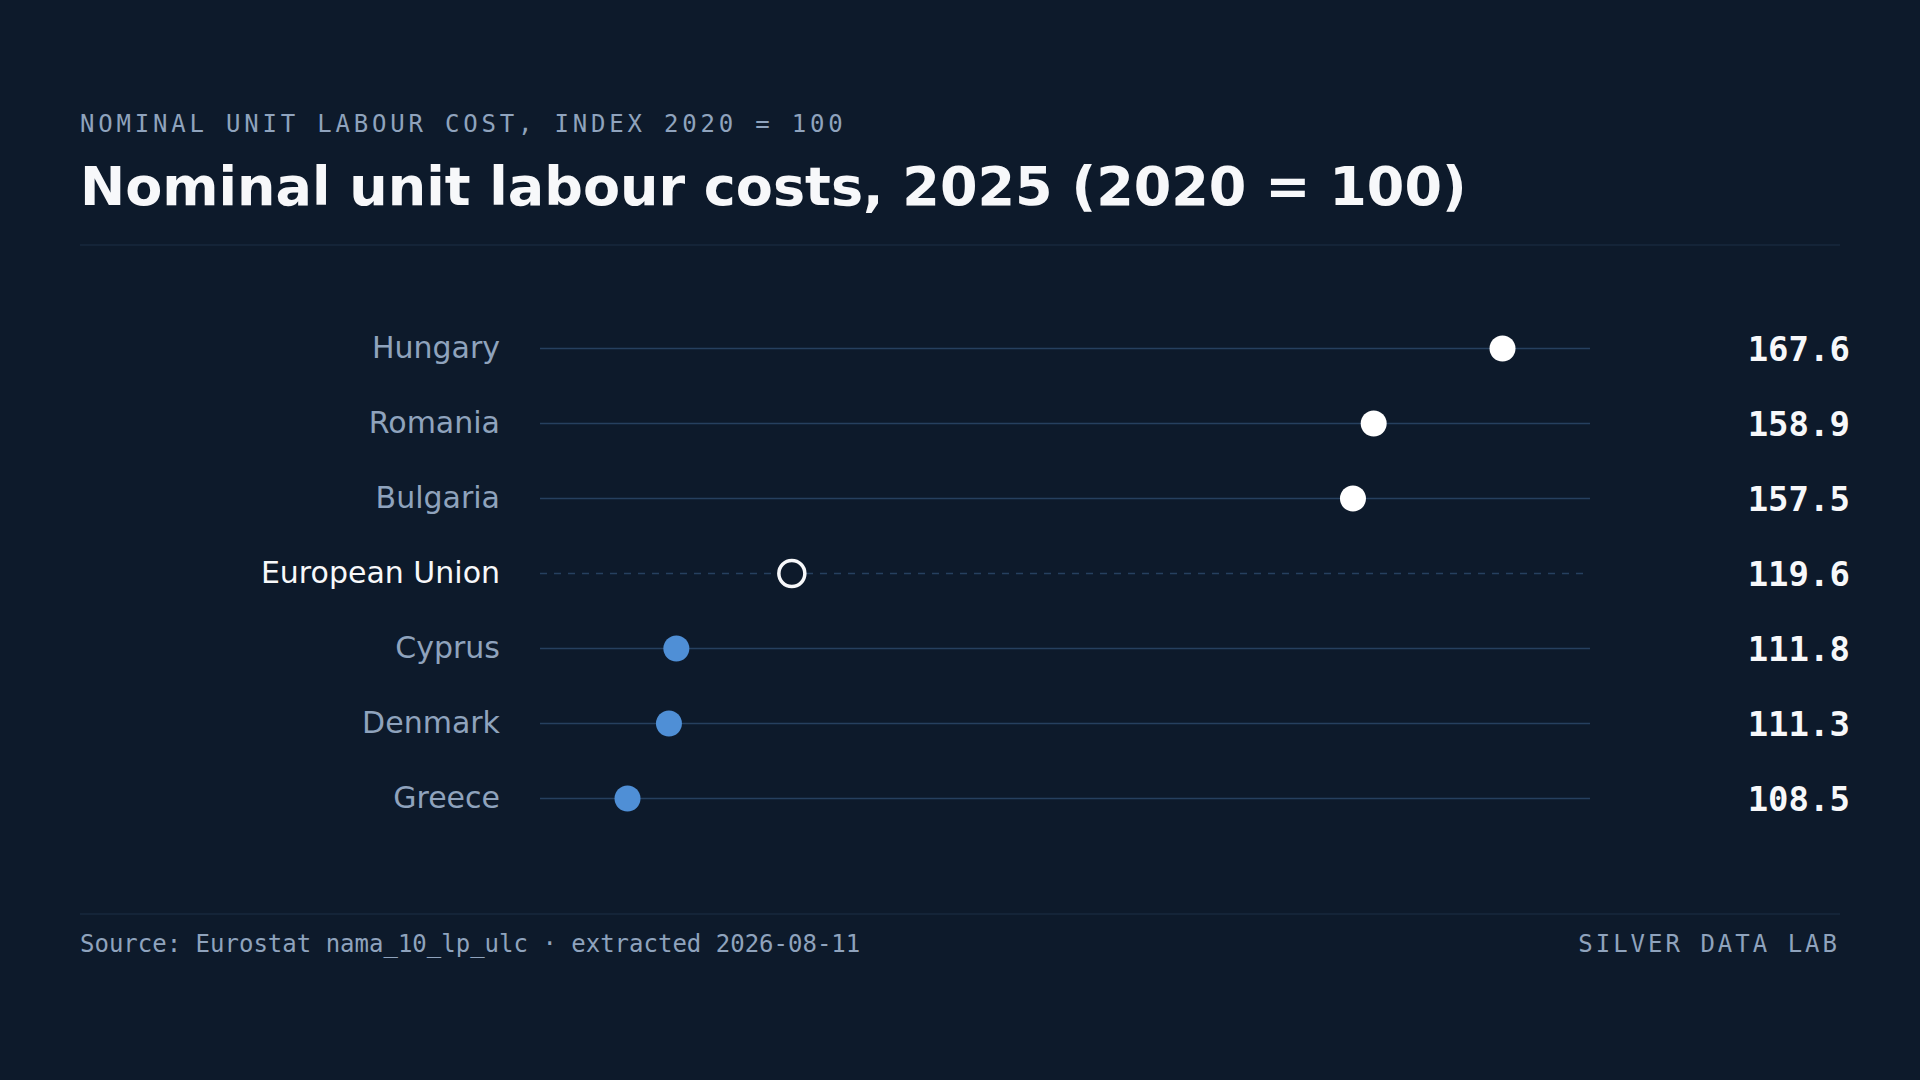
- Hungary records 166.2, Lithuania 155.0 and Bulgaria 154.5; Romania follows at 145.0.
- Cyprus records 109.1, Greece 110.6 and Italy 111.0.
- The gap between Hungary and Cyprus is 57 index points over the same five years.
- Rapid cost growth is concentrated in the Member States that were catching up fastest on wages.
Cost per unit of output, not cost per hour
Unit labour cost is what an employer pays in labour for each unit of output produced. It rises when pay grows faster than productivity and falls when productivity grows faster than pay.
That construction is what makes it the standard measure of cost competitiveness. A country whose wages double while output per worker also doubles has unchanged unit labour costs and is no less competitive than before.
Across the EU, unit labour costs in 2025 stood at 119.1 against a 2020 base of 100.
The catching-up group
Hungary records 166.2, Lithuania 155.0 and Bulgaria 154.5: three Member States more than half again above their 2020 level. Romania follows at 145.0, after Eurostat revised its index down in the release of 9 October.
These are among the Union's lower-wage economies, and part of what the index is capturing is convergence: wages rising from a low base towards western European levels. That is the intended outcome of economic integration and not in itself a problem.
It becomes a problem when it outpaces productivity, which is what the index measures. A cost increase of more than half over five years requires productivity growth that few economies achieve, and where it has not been matched, the country's exports become more expensive relative to its competitors.
Within a currency union this cannot be corrected by devaluation, which is why the measure sits in the imbalance framework. Hungary and Romania are outside the euro area and retain that option. Bulgaria gave it up on 1 January 2026, when it adopted the euro, and Lithuania, Slovakia and the other euro members among the fast risers no longer have it either.
Greece at the other end
Greece records 110.6, the second-lowest in the Union after Cyprus — a 10.6% increase over five years against an EU average of 19.1%.
That is the continuation of the internal devaluation Greece went through after 2010, when wages were cut directly because the exchange rate could not be. Greek unit labour costs fell sharply in that period and have grown slowly since.
Read as competitiveness, this is a good result. Read alongside the rest of what this site records about Greece — the Union's second-lowest life satisfaction, its highest migrant over-qualification, a current account deficit of 5.6% of GDP and the most negative investment position in the Union — it is a reminder that cost competitiveness is one variable among many and does not by itself produce a strong economy.
Denmark and the productivity route
Denmark records 111.3, fourth-lowest, and it arrived there differently. Danish wages are among the highest in the Union and rose substantially over the period; Danish productivity rose with them.
That is the only route to low unit labour cost growth that does not involve suppressing pay, and Denmark is the clearest European example of it. Its current account surplus of 12.3% of GDP and creditor position of 97.8% are consistent with the same picture.
Italy is the newcomer at this end
Italy records 111.0, between Greece and Denmark, and it is there because the figure was revised. Every extraction this study archived between 11 August and 22 September put Italy fourth-lowest at 112.0; the release of 29 September puts it at 111.0, a full index point down, while Cyprus and Denmark did not move at all. That revision took Italy into the three lowest and Cyprus out of them. The release of 20 October then revised Cyprus's provisional figure down from 111.8 to 109.1, which puts it below Greece as the lowest in the Union and leaves Denmark fourth-lowest.
Which of the two routes Italy took is not readable from the index. A single number for cost per unit of output says that pay and productivity moved close to one another over the five years; it does not say whether both grew slowly or both grew quickly, and this extraction carries the index alone.
Why the base year matters
A 2020 base is not neutral. 2020 was the pandemic year, in which output collapsed while employment was held in place by short-time work schemes across the Union.
That mechanically raised unit labour costs in 2020 — the denominator fell faster than the numerator — so an index built on that base starts from an inflated level and understates subsequent growth. The comparison between Member States remains sound, because the effect applied to all of them, but the level of the index should not be read as a clean five-year change.
Nominal unit labour costs, 2025 (2020 = 100)
| Country | index, 2020 = 100 | Gap to EU averagederived |
|---|---|---|
| Hungary | 166.2p | +47.1 |
| Lithuania | 155.0 | +35.9 |
| Bulgaria | 154.5 | +35.4 |
| European Unionaggregate | 119.1 | — |
| Italy | 111.0 | −8.1 |
| Greece | 110.6p | −8.5 |
| Cyprus | 109.1p | −10.0 |
Flags carried by the source on these values: p provisional
This table as data: CSV · JSON
Every Member State for this indicator+
Members see every Member State for this indicator here, not only the rows the ranking prints. Become a Member
Embed this chart
Paste this code into a page. The frame carries the source and the extraction date, and links back to the study.
What these figures cannot tell you
- The 2020 base is distorted
- 2020 combined collapsing output with employment held in place by short-time work schemes, which raised unit labour costs that year across the Union. An index on that base understates growth since. Comparisons between Member States remain valid; the absolute level does not.
- Nominal, not adjusted for exchange rates
- This is the nominal index in national terms. For Member States outside the euro area, competitiveness against the rest of the Union also depends on the exchange rate, which this measure does not include.
- A whole-economy average
- The index covers all activities together. A country can have rising costs in sheltered services and flat costs in tradable manufacturing, and the aggregate would show neither.
- Cost is not the whole of competitiveness
- Unit labour cost measures price competitiveness only. Product quality, specialisation and non-price factors determine export performance as much as cost, and none of them appear here.
Frequently asked questions
- What are unit labour costs?
- The labour cost of producing one unit of output. The measure rises when pay grows faster than productivity and falls when productivity grows faster than pay, which makes it the standard indicator of cost competitiveness.
- Which EU country has seen the fastest cost growth?
- Hungary, where unit labour costs stood at 166.2 in 2025 against a 2020 base of 100 — 66% higher in five years. Lithuania at 155.0 and Bulgaria at 154.5 follow. All three are lower-wage economies where wages are converging upwards.
- Which EU country has the slowest cost growth?
- Cyprus, at 109.1, followed by Greece at 110.6 and Italy at 111.0, with Denmark fourth at 111.3. Greece arrived there through the internal devaluation that followed 2010; Denmark through productivity growth that matched high wage growth, which is the only route that does not involve suppressing pay. Italy entered the three lowest with the release of 29 September 2026, which revised its index down by a full point, and Cyprus became the lowest with the release of 20 October 2026, which revised its provisional index down from 111.8.
- Is rapid wage convergence a problem?
- Not in itself — it is what economic integration is meant to produce. It becomes an imbalance when pay outpaces productivity, because exports then become more expensive relative to competitors, and inside the euro area that cannot be corrected by devaluation.
Methodological note
Eurostat publishes nominal unit labour costs in the national accounts framework as compensation per employee divided by real output per person employed. This study uses the index on a 2020 = 100 base for the whole economy.
Values are for 2025 and cover all 27 Member States: Eurostat's releases from 7 October carried no value for Croatia, and the release of 19 October publishes one again.
The gap between the highest and lowest Member State is derived by Silver Data Lab. The comparisons with current account balances and net investment positions draw on the companion studies in this category, each with its own extraction.
Source data
The underlying series can be inspected and re-downloaded from the Eurostat data browser. The filters below are the ones applied.
Labour productivity and unit labour costs
nama_10_lp_ulc
- Filters applied:
- freq=A · unit=I20 · na_item=NULC_PER · time=2025
- Extracted:
- 2026-10-23
- Source last updated:
- 2026-10-22
Download the data
The data the study you have just read is built on, exactly as it was downloaded and archived.
Yours as a Member.
Data downloadable by Members
How to cite
Record the vintage as well as the study: the figures on this page are the ones extracted on the dates below.
Silver Data Lab Research Desk (2026). Hungary's Labour Cost per Unit of Output Rose by Over Half in Five Years. Silver Data Lab, published 07 August 2026, last updated 21 October 2026. https://www.silverdatalab.com/studies/unit-labour-costs-in-the-eu
- Data: Eurostat, Labour productivity and unit labour costs (nama_10_lp_ulc), filters freq=A, unit=I20, na_item=NULC_PER, time=2025; extracted 2026-10-23; source last updated 2026-10-22. https://doi.org/10.2908/nama_10_lp_ulc
Silver Data Lab's analysis is licensed CC BY 4.0. The statistics remain their publisher's and keep its terms of reuse.
Ask the research desk
A question about this study — a definition, a filter, a break in the series, what the figures can and cannot support — answered by the desk that made the extraction.
Members can write to the research desk
Other studies on the same dataset
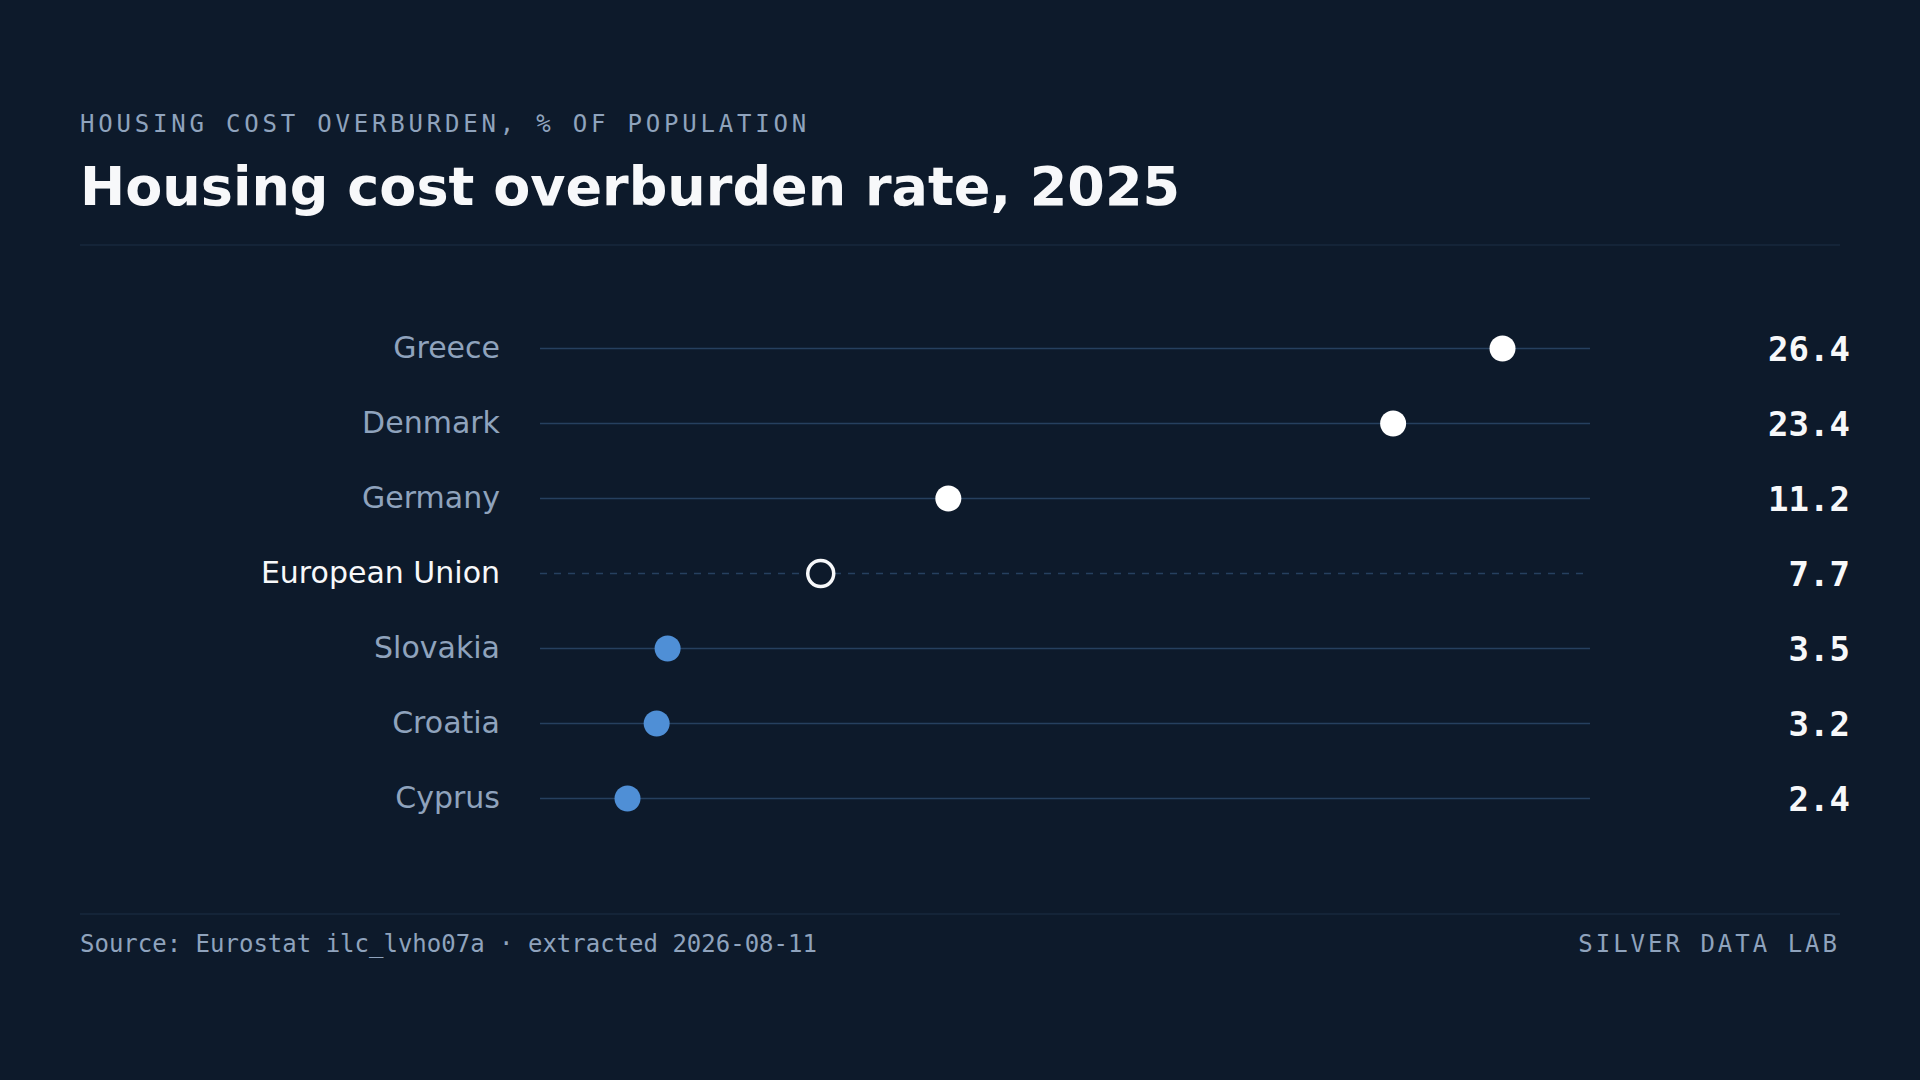
A Quarter of Greeks Spend More Than 40% of Income on Housing
7.7% of the EU population spent more than 40% of disposable income on housing in 2025.
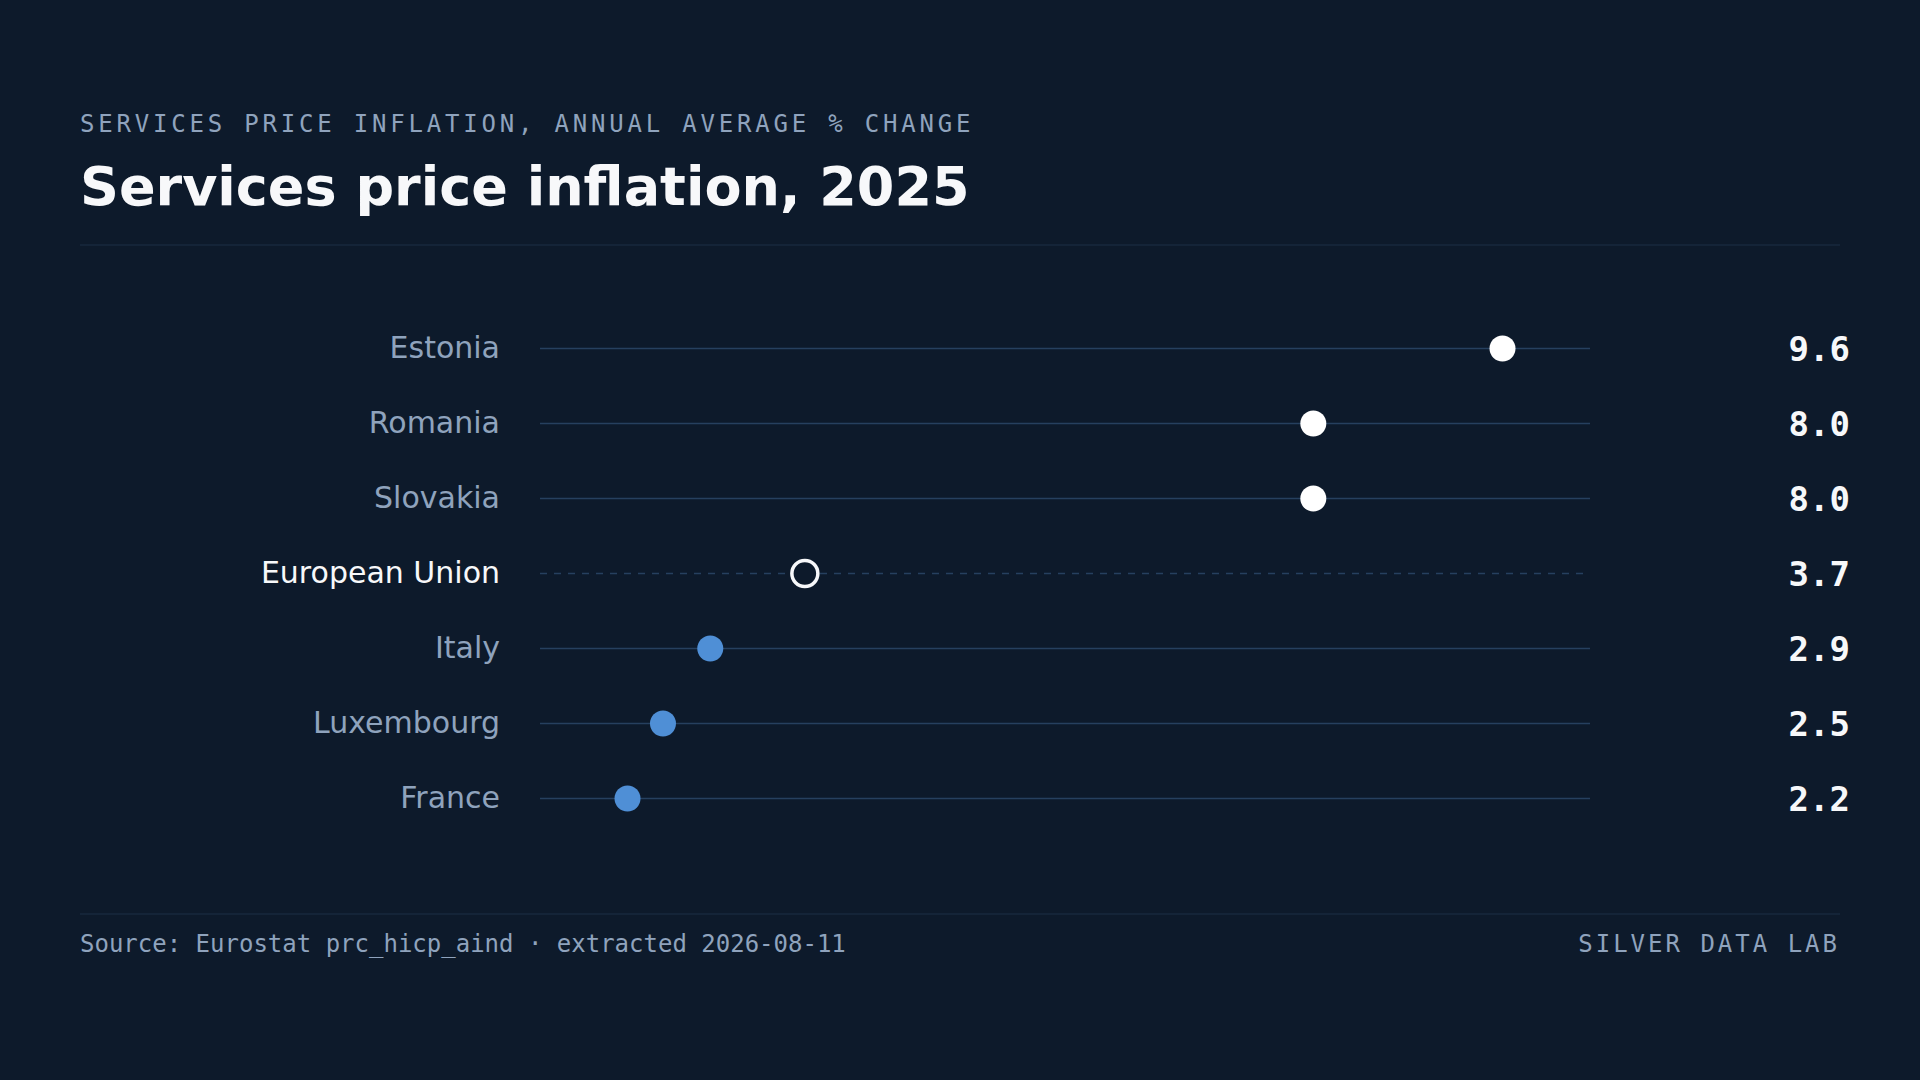
In One Year, EU Services Prices Rose While Energy Prices Fell
Services prices in the EU rose 3.7% in 2025, against 2.8% for food and -0.6% for energy.
Studies where the same country leads or trails
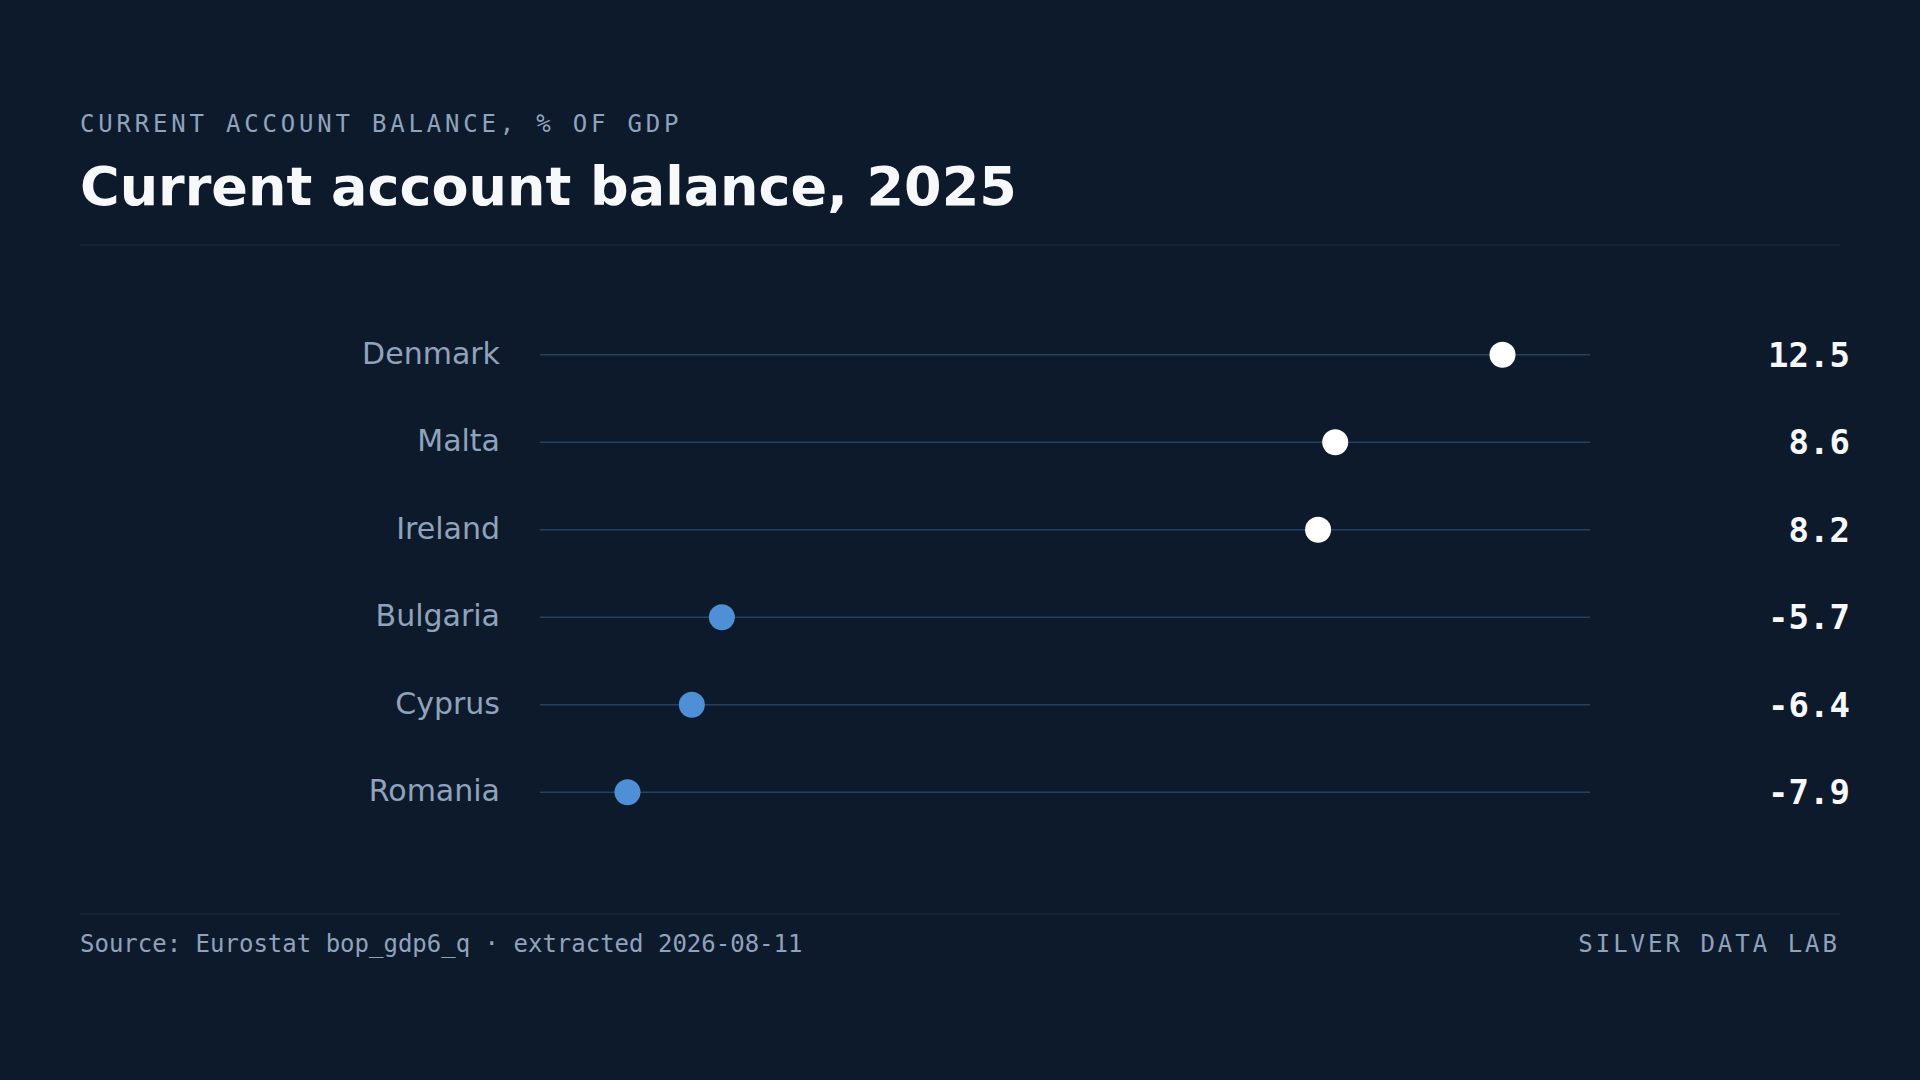
Denmark Has the EU's Biggest Surplus With the World, at 12.3% of GDP
Denmark ran a current account surplus worth 12.3% of GDP in 2025, the largest in the Union.
EU Countries Sell 61.1% of Their Goods Exports to Each Other
61.1% of the goods exported by EU Member States in 2025 went to other Member States.
Food Prices Rose 6.7% in Romania and Not at All in Cyprus
Food prices in the EU rose 2.8% on average in 2025.