In One Year, EU Services Prices Rose While Energy Prices Fell
Silver Data Lab Research Desk · Statistical analysis · Published on 09 February 2026
This study is open to members only
Its sources, filters and extraction date are declared above, as they are for every study. Sign in to read the analysis in full.
- Data source
- Eurostat
- Reference period
- 2025
- Last updated
- 21 October 2026
Re-checked against the source on 23 October 2026. 41 values in its datasets moved between snapshots, 7 of them figures stated on this page. Every revision we have observed →
Key estimates
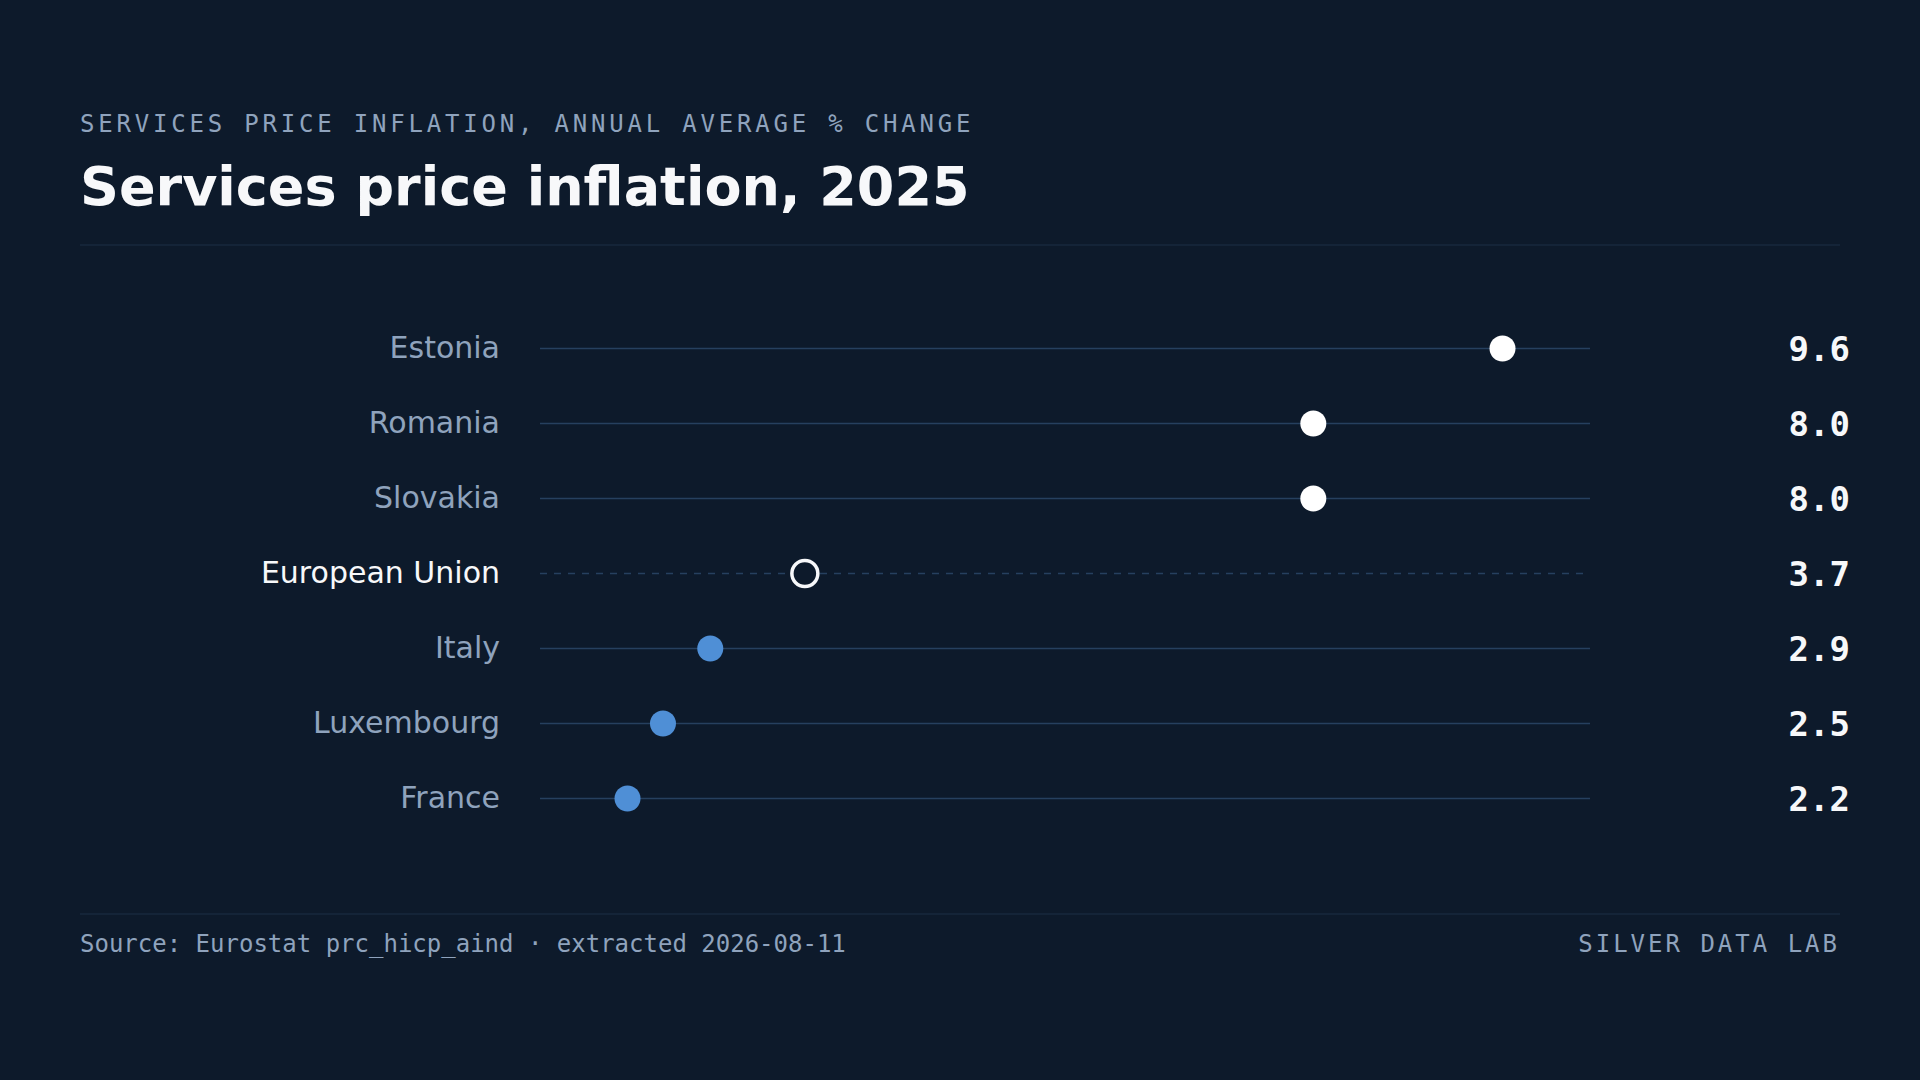
- Services prices in the EU rose 3.7% in 2025, against 2.8% for food and -0.6% for energy.
- Estonia records 9.6%, Romania 8.0% and Slovakia 8.0%.
- France records 2.2%, Luxembourg 2.5% and Italy 2.9%.
- Services rose faster than the headline rate of 2.5%, and by a wider margin than food, the other component measured here.
- Because services are labour-intensive, their prices follow wages, which is why this component moves last.
The component that lags
Consumer prices divide into goods and services, and the two behave differently. Goods prices follow commodity costs, exchange rates and shipping, all of which move quickly. Services prices follow wages, which move slowly and infrequently.
In 2025 that difference produced a clear result. Energy fell 0.6% across the Union, food rose 2.8%, and services rose 3.7% — faster than either, and faster than the headline rate.
Why services move last
A restaurant meal, a haircut, an insurance policy and a plumber's visit are mostly labour. When labour costs rise, service prices follow, but only once contracts are renegotiated and price lists reprinted.
The wage increases that followed the 2022 energy shock were agreed through 2023 and 2024, and they reach service prices afterwards. That lag is why services inflation is still elevated in a year when the shock that caused it has reversed.
The unit labour cost study on this site records the underlying movement: EU unit labour costs rose 19.1% over five years, and considerably more in several Member States.
Where it is fastest
Estonia records 9.6%, Romania 8.0%, Slovakia 8.0% and Hungary 7.5%, with Croatia at 7.4% just behind. Three of the four leaders here are also among the five highest on the unit labour cost ranking: Hungary at 166.2, Romania at 145.0 and Estonia at 143.9. Croatia sits seventh on that ranking, at 135.2.
Estonia's 9.6% is more than four times the French rate in the same year, inside the same currency union.
Where it is slowest
France records 2.2%, Luxembourg 2.5% and Italy 2.9%, with Denmark level with Italy at 2.9%.
Italy at 2.9% and France at 2.2% are the two large economies whose labour costs per unit of output rose least over the same five years, and their services inflation follows. Cyprus and Greece are the cases that do not follow: their unit labour costs rose less than anywhere else in the Union, and their services prices still rose 4.3% and 4.8% respectively, both above the EU rate.
What this implies for monetary policy
A central bank looking at a headline rate close to target in 2025 was looking at a number held down by falling energy and held up by services.
Energy will not fall indefinitely. If services inflation persists at 3.7% while the energy contribution returns to zero, the headline rate rises without anything new happening. That is the reason services inflation is watched more closely than its share of the basket would suggest, and why the dispersion across Member States — 7.4 percentage points, derived here as Estonia's 9.6% less France's 2.2% — matters for the single monetary policy the twenty Member States of the euro area shared in 2025.
Services price inflation, 2025
| Country | annual average % change | Gap to EU averagepercentage points, derived |
|---|---|---|
| Estonia | 9.6 | +5.9 |
| Romania | 8.0 | +4.3 |
| Slovakia | 8.0 | +4.3 |
| European Unionaggregate | 3.7 | — |
| Italy | 2.9 | −0.8 |
| Luxembourg | 2.5 | −1.2 |
| France | 2.2 | −1.5 |
This table as data: CSV · JSON
Every Member State for this indicator+
Members see every Member State for this indicator here, not only the rows the ranking prints. Become a Member
What these figures cannot tell you
- An annual average rate
- The figure compares average 2025 prices with average 2024 prices and does not show the path within the year or the position at its end.
- Services is a broad and uneven category
- It combines housing-related services, transport, communication, recreation, education, restaurants and insurance. National baskets weight these differently, and a country's rate can be driven by one large component.
- Administered prices sit inside it
- Public transport fares, education fees and some health services are set or regulated by governments in several Member States. Where they are adjusted infrequently, the index moves in steps rather than continuously.
- The wage link is an explanation, not a measurement
- The account offered here — that services prices follow wages with a lag — is consistent with the unit labour cost data on this site but is not established by this extraction, which contains prices only.
Frequently asked questions
- How fast are service prices rising in the EU?
- 3.7% in 2025, against 2.8% for food and -0.6% for energy. Both services and food outran the headline rate of 2.5%, services by much the wider margin.
- Why is services inflation higher than goods inflation?
- Because services are mostly labour, and their prices follow wages. Wage increases agreed after the 2022 energy shock reach service prices only once contracts are renegotiated, so this component moves last and falls last.
- Which EU country has the highest services inflation?
- Estonia, at 9.6% in 2025, with Romania and Slovakia both at 8.0%. Estonia and Romania are also among the five Member States where labour costs per unit of output have risen most since 2020.
- Why does services inflation matter for interest rates?
- Because a headline rate near target in 2025 was held down by falling energy and held up by services. If energy stops falling while services inflation persists, the headline rate rises with nothing new having happened.
Methodological note
This study uses the services special aggregate of the harmonised index of consumer prices, as the annual average rate of change for 2025.
Values cover all 27 Member States and the EU aggregate as published. The food and energy figures quoted for comparison come from the same extraction with different category filters, archived together, and the all-items rate of 2.5% comes from a second extraction of the same table, declared below. The 7.4-point dispersion is derived by Silver Data Lab as the difference between the highest and lowest Member State.
The correspondence between services inflation and unit labour cost growth is an observation by Silver Data Lab across two separate studies on this site and is not a statistical relationship estimated here. Unit labour cost is compensation of employees per unit of output, not a wage: the extraction behind those figures is declared below beside this study's own.
Source data
This study draws on 3 datasets from Eurostat. Each can be inspected and re-downloaded from its catalogue, and the filters below are the ones applied.
HICP - annual data (average index and rate of change)
prc_hicp_aind
- Filters applied:
- freq=A · unit=RCH_A_AVG · coicop=SERV, CP011, NRG · time=2025
- Extracted:
- 2026-08-11
- Source last updated:
- 2026-02-06
HICP - annual data (average index and rate of change)
prc_hicp_aind
- Filters applied:
- freq=A · unit=RCH_A_AVG · coicop=CP00 · time=2025
- Extracted:
- 2026-08-11
- Source last updated:
- 2026-02-06
Labour productivity and unit labour costs
nama_10_lp_ulc
- Filters applied:
- freq=A · unit=I20 · na_item=NULC_PER · time=2025
- Extracted:
- 2026-10-23
- Source last updated:
- 2026-10-22
Download the data
The data the study you have just read is built on, exactly as it was downloaded and archived.
Yours as a Member.
Data downloadable by Members
How to cite
Record the vintage as well as the study: the figures on this page are the ones extracted on the dates below.
Silver Data Lab Research Desk (2026). In One Year, EU Services Prices Rose While Energy Prices Fell. Silver Data Lab, published 09 February 2026, last updated 21 October 2026. https://www.silverdatalab.com/studies/services-inflation-in-the-eu
- Data: Eurostat, HICP - annual data (average index and rate of change) (prc_hicp_aind), filters freq=A, unit=RCH_A_AVG, coicop=SERV, CP011, NRG, time=2025; extracted 2026-08-11; source last updated 2026-02-06. https://doi.org/10.2908/prc_hicp_aind
- Data: Eurostat, HICP - annual data (average index and rate of change) (prc_hicp_aind), filters freq=A, unit=RCH_A_AVG, coicop=CP00, time=2025; extracted 2026-08-11; source last updated 2026-02-06. https://doi.org/10.2908/prc_hicp_aind
- Data: Eurostat, Labour productivity and unit labour costs (nama_10_lp_ulc), filters freq=A, unit=I20, na_item=NULC_PER, time=2025; extracted 2026-10-23; source last updated 2026-10-22. https://doi.org/10.2908/nama_10_lp_ulc
Silver Data Lab's analysis is licensed CC BY 4.0. The statistics remain their publisher's and keep its terms of reuse.
Ask the research desk
A question about this study — a definition, a filter, a break in the series, what the figures can and cannot support — answered by the desk that made the extraction.
Members can write to the research desk
Other studies on the same dataset
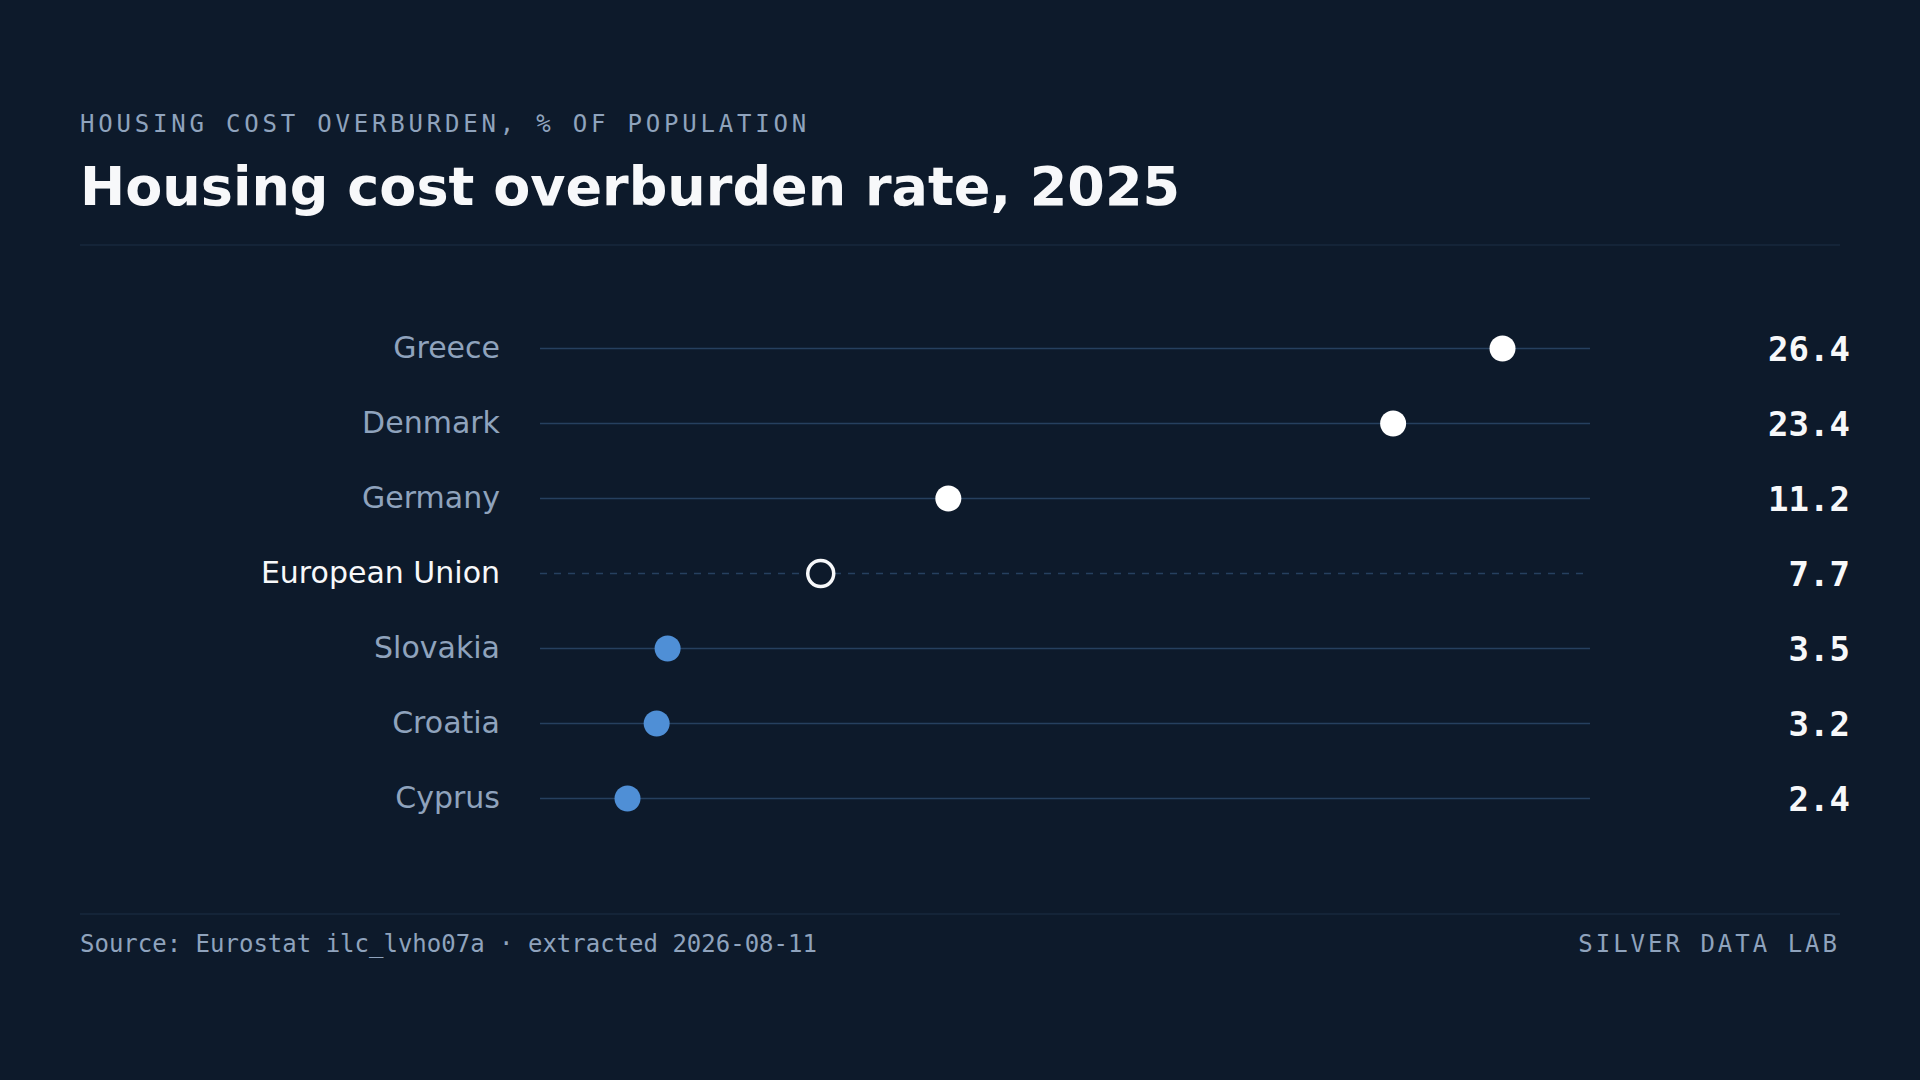
A Quarter of Greeks Spend More Than 40% of Income on Housing
7.7% of the EU population spent more than 40% of disposable income on housing in 2025.
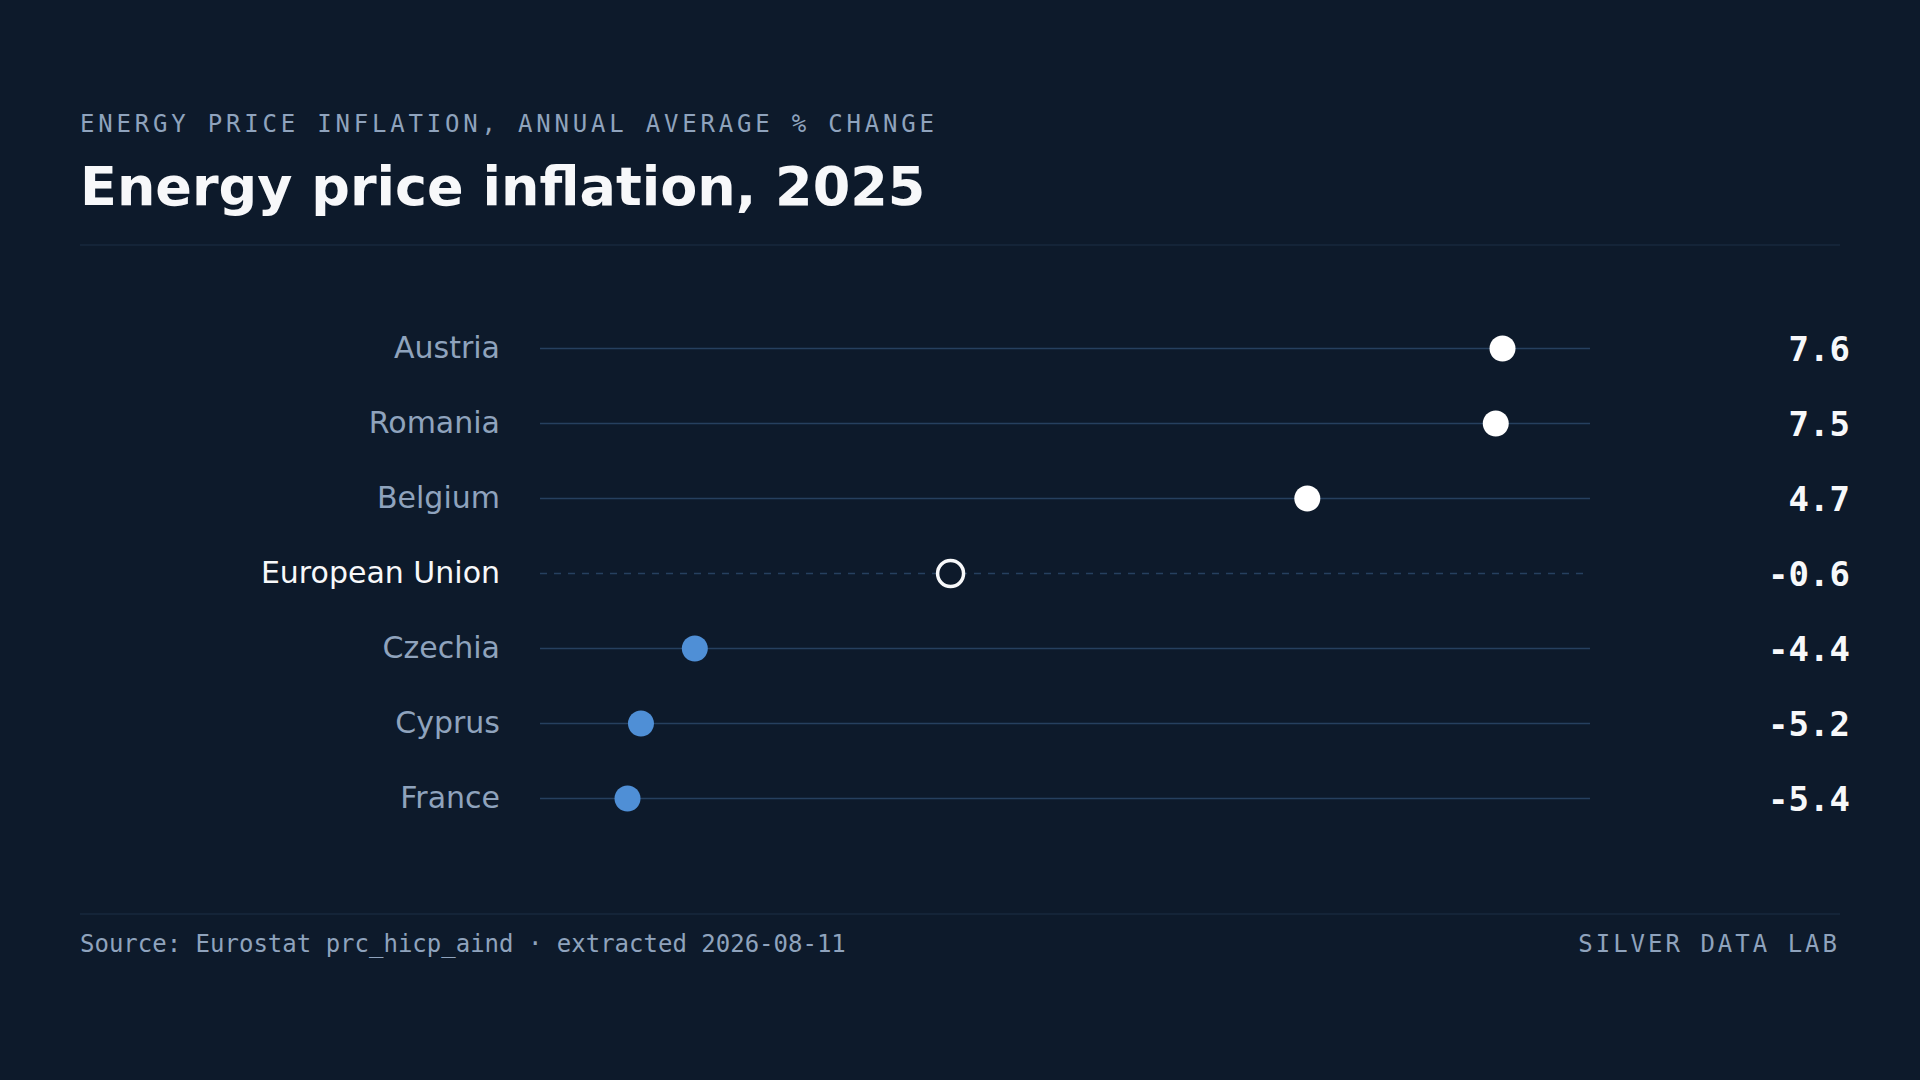
Energy Prices Fell on Average in the EU but Rose 7.6% in Austria
Energy prices in the EU fell 0.6% on average in 2025.
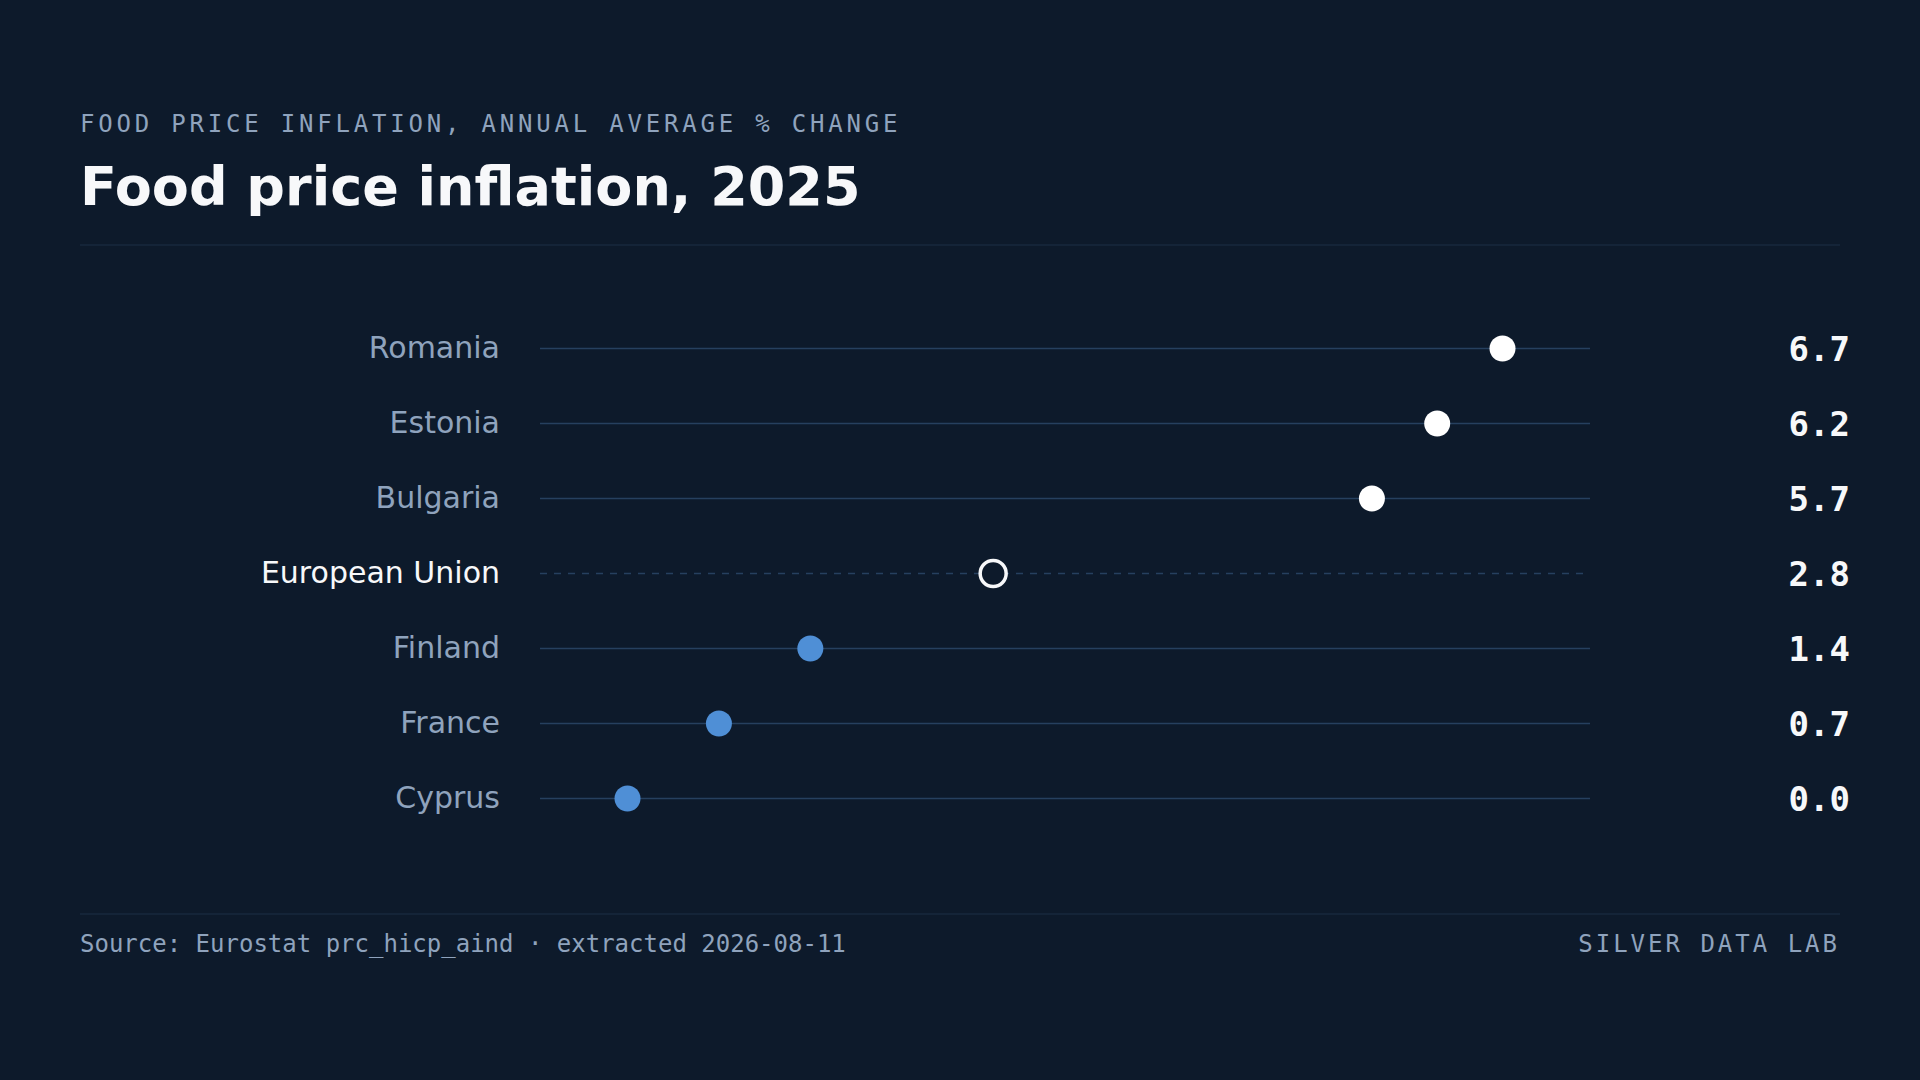
Food Prices Rose 6.7% in Romania and Not at All in Cyprus
Food prices in the EU rose 2.8% on average in 2025.
Studies where the same country leads or trails
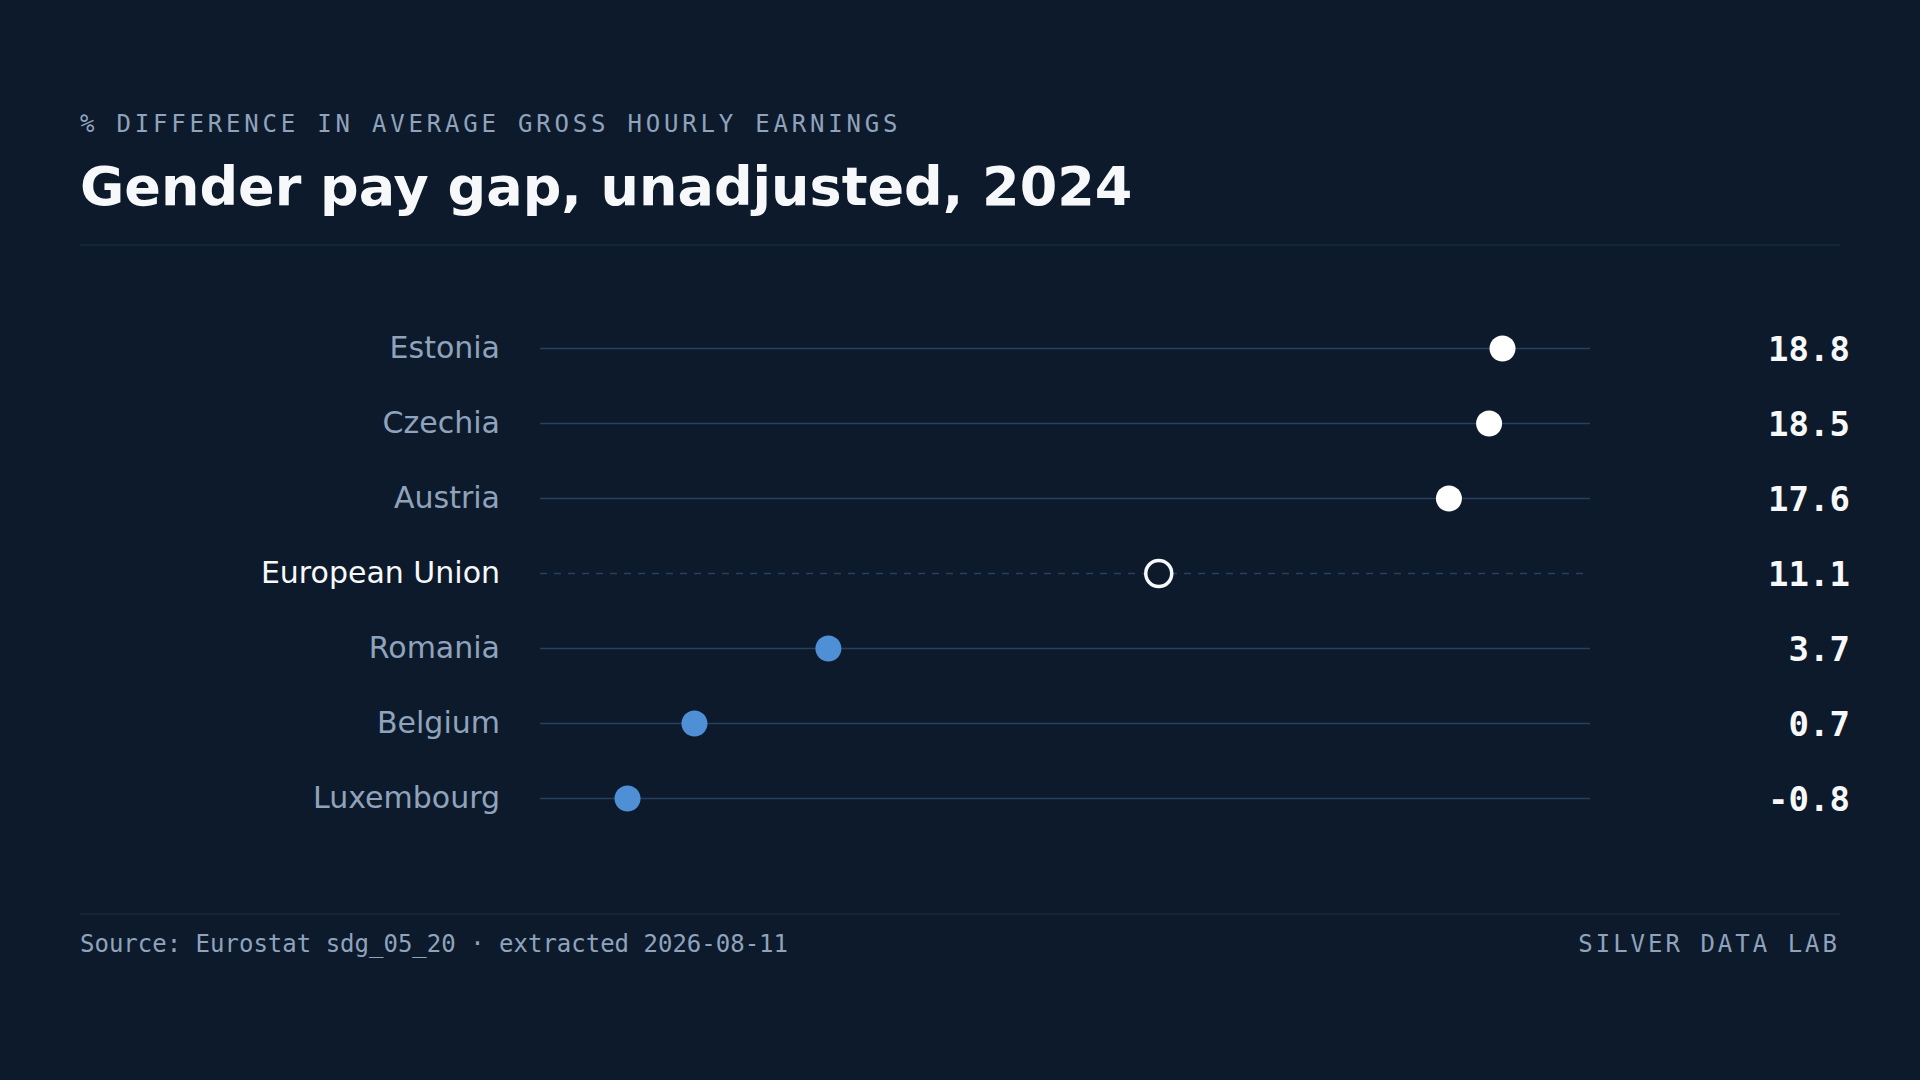
In Luxembourg, Women Are Paid More Than Men
Women in the EU earned 11.1% less per hour than men in 2024, before any adjustment for occupation or hours.
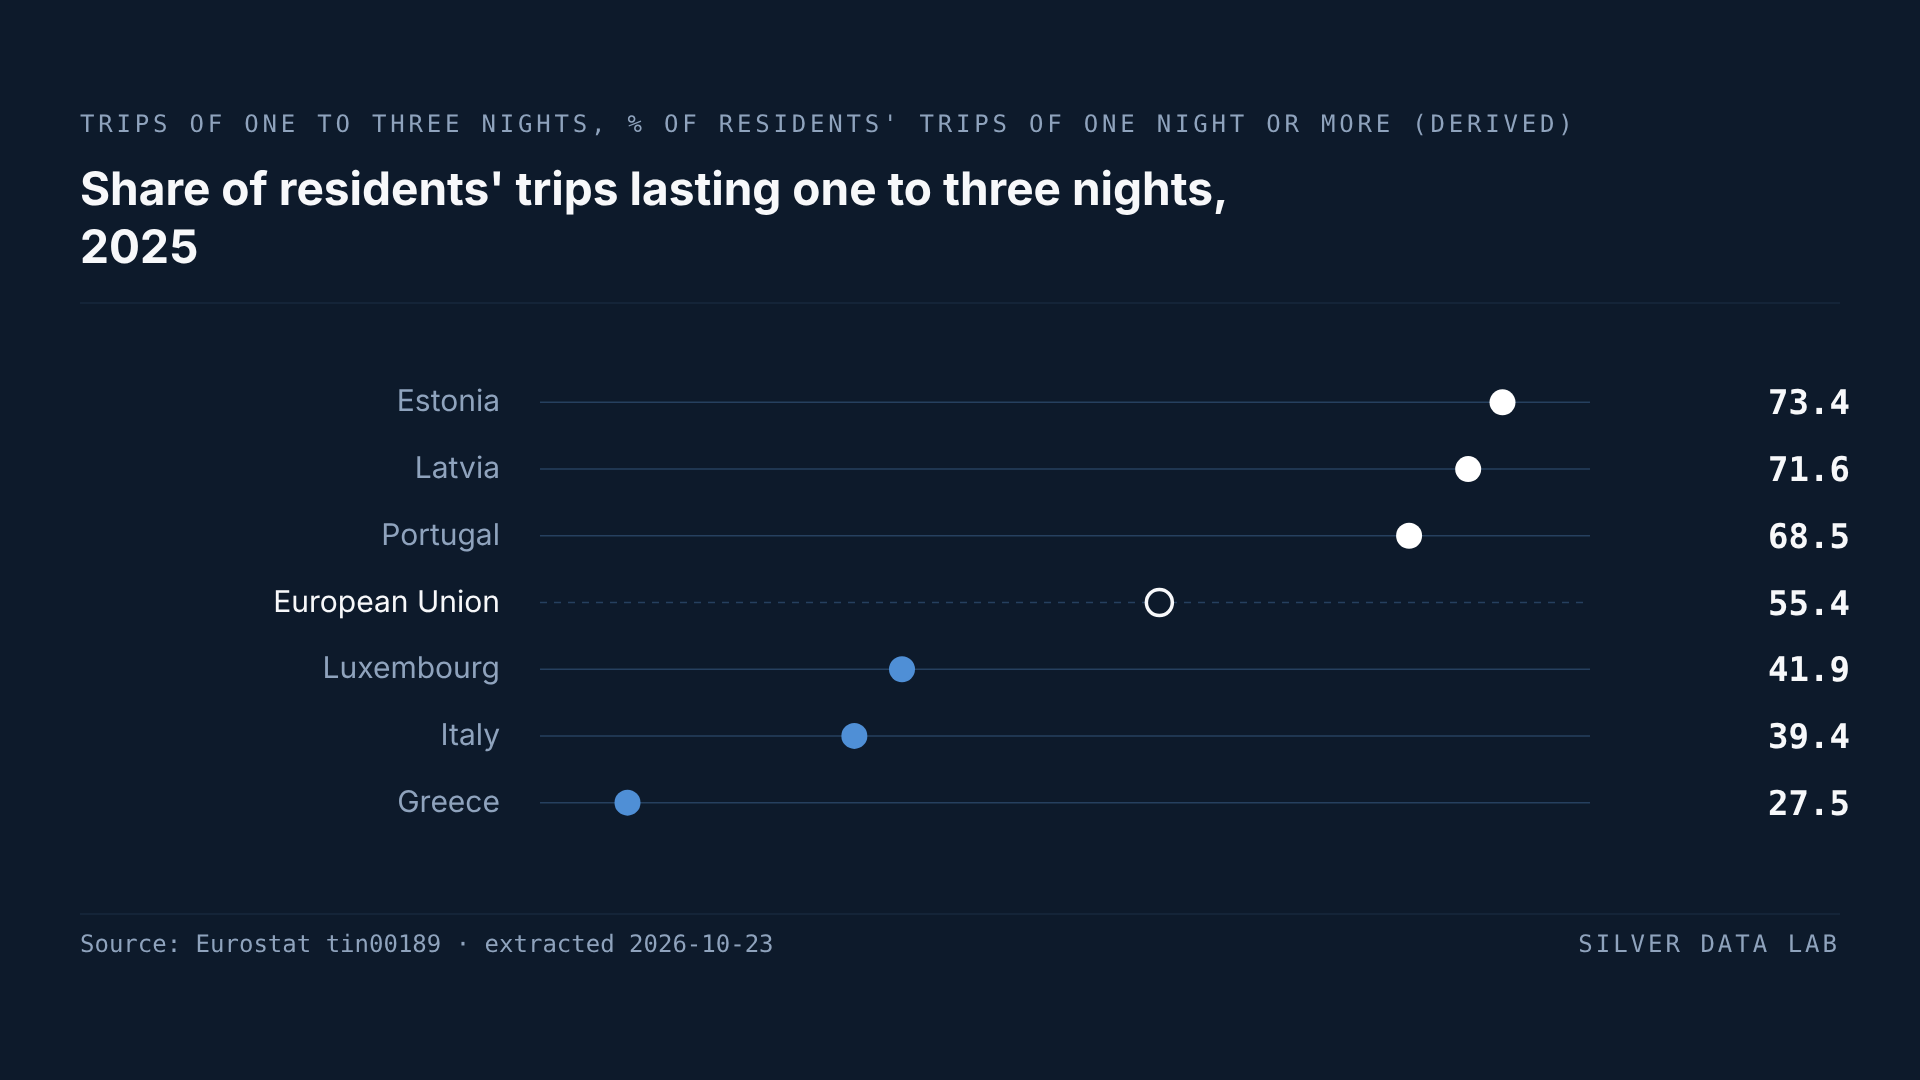
Trips by Greeks Are the EU's Least Likely to Last Three Nights or Fewer
In 2025, 27.5% of the trips of at least one night made by people living in Greece lasted one to three nights: 2.25 million of 8.17 million. No other Member State's residents recorded a share as low; the share is derived by Silver Data Lab from Eurostat's counts, as is every share on this page.