EU Countries Sell 61.1% of Their Goods Exports to Each Other
Silver Data Lab Research Desk · Statistical analysis · Published on 19 July 2026
- Data source
- Eurostat
- Reference period
- 2025
- Last updated
- 17 October 2026
Re-checked against the source on 17 October 2026. 38 values in its datasets moved between snapshots, 16 of them figures stated on this page. Every revision we have observed →
Key estimates
- 61.1% of the goods exported by EU Member States in 2025 went to other Member States.
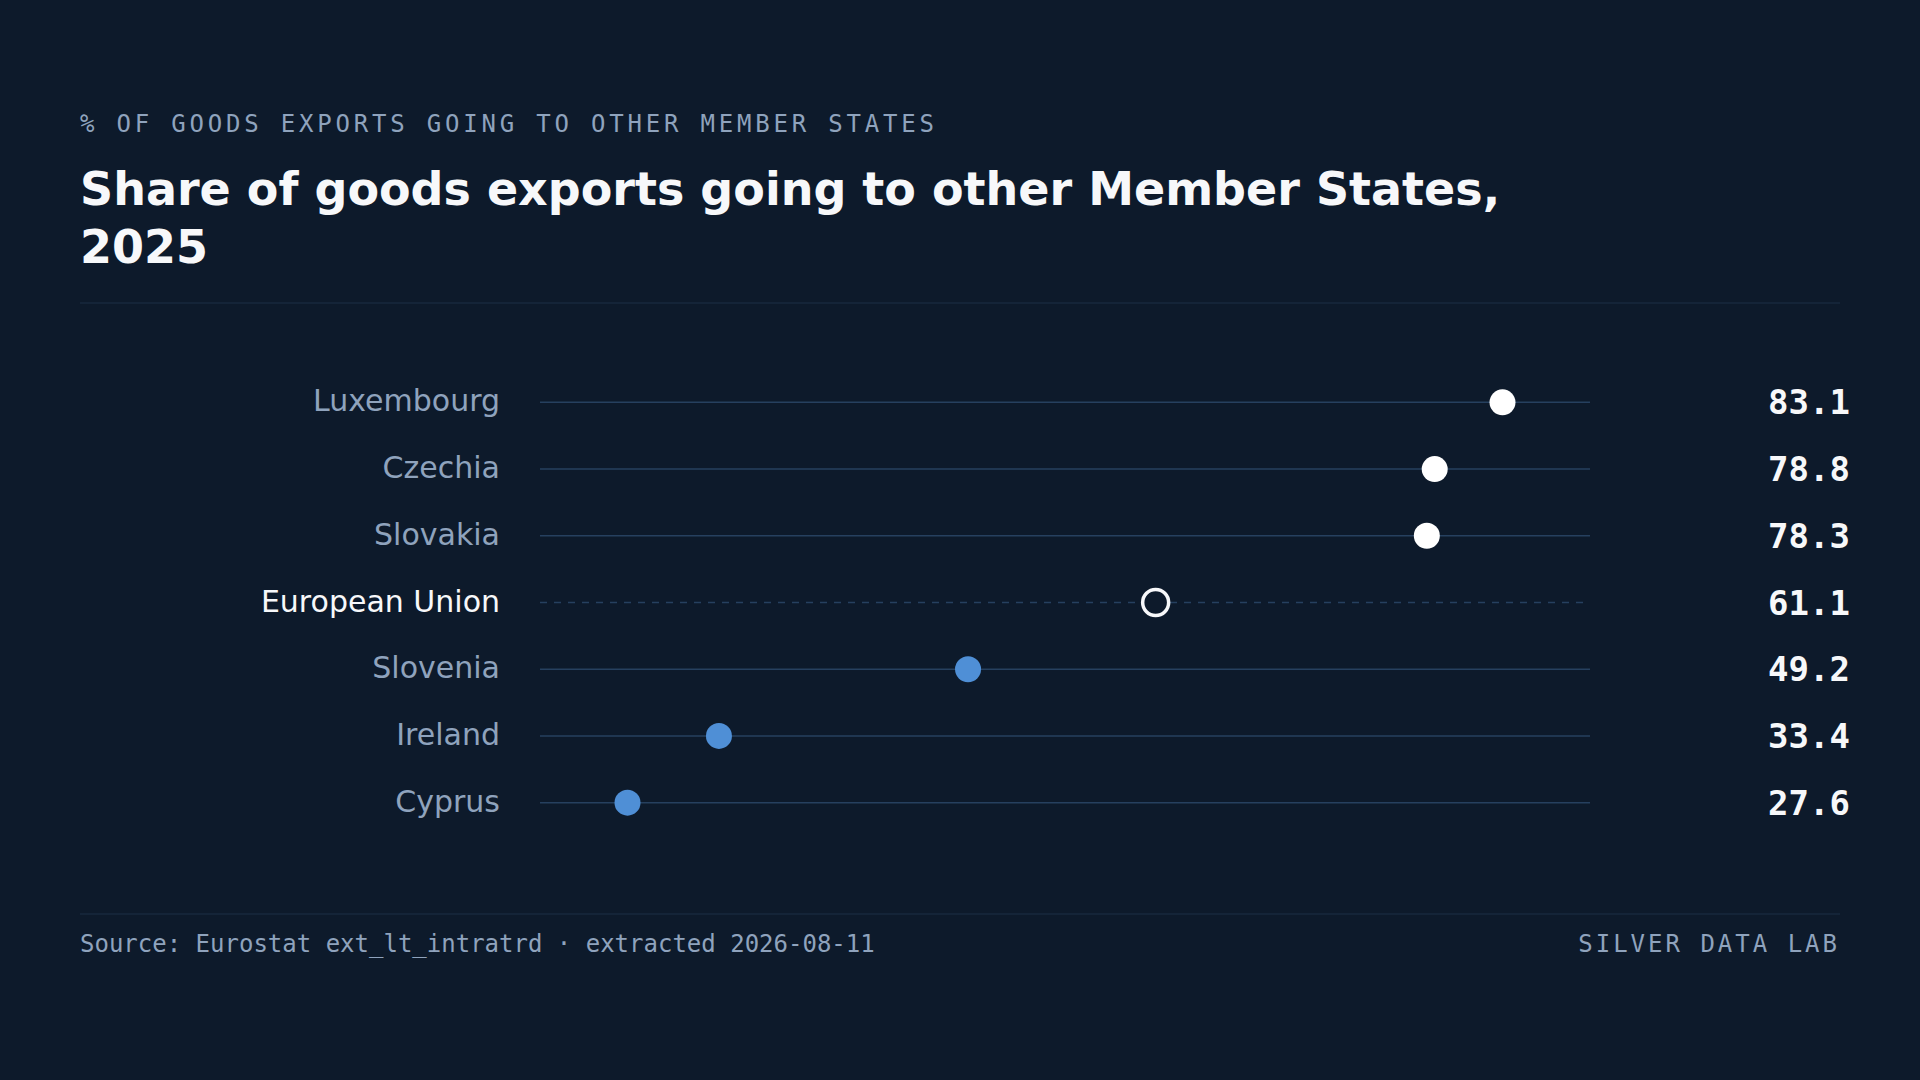
- Czechia sends 78.8% of its goods exports to other Member States and Slovakia 78.3%.
- Cyprus sends 27.6% and Ireland 33.5% — the only two Member States below 40%.
- Only three Member States send less than half their goods exports inside the Union.
- Germany, France and Italy all sit between 51% and 56%, close to the point where the two markets are equal.
What the single market absorbs
When a Member State reports its exports, most of what it counts is sold to another Member State. Across the Union in 2025 that share was 61.1% of goods exports by value.
The single market is therefore not one destination among several for European producers. For most of them it is the destination, and the rest of the world is the smaller half of their business.
Where the dependence is deepest
Czechia sends 78.8% of its goods exports to other Member States, Slovakia 78.3%, Hungary 75.2% and Poland 74.8%. Luxembourg records the highest share of all at 83.1%.
The central European group is the clearest pattern in the ranking. These are economies built into the manufacturing supply chains of their western neighbours — a Slovak component becomes part of a German product — and the share reflects that integration rather than a preference for nearby markets.
Estonia at 74.9% and Portugal at 72.1% sit in the same band for different reasons, which is a reminder that the ranking has more than one cause.
The two economies that face outward
Cyprus records 27.6% and Ireland 33.5%. They are the only Member States below 40%, and the distance between Ireland and the next lowest is substantial: Slovenia, third from bottom, records 49.2%.
Ireland's position follows from what it exports. Its goods trade is dominated by pharmaceutical and medical products manufactured by firms whose principal market is the United States, so its export destinations look unlike those of an economy of similar size and location.
Only three Member States — Cyprus, Ireland and Slovenia — send less than half their goods exports inside the single market.
Germany, France and Italy sit near the middle
Germany records 55.9%, France 53.7% and Italy 51.3%.
All three sit close to the line where the internal and external markets are of equal size, and all three are below the EU figure of 61.1%.
Size is not what decides the share, though. The Netherlands records 69.1% and Belgium 69.0%, and by value they are the second and fifth largest goods exporters in the Union — both well above the EU figure, not below it. What separates them from Germany, France and Italy is the kind of trade they do: much of what leaves Rotterdam and Antwerp is destined for the European hinterland behind them.
What the ranking does separate is exposure. A Czech or Slovak manufacturer has four fifths of its export business inside the single market; a German one has slightly more than half. That is a difference in how a disruption to the single market would be felt, and it does not line up with how large the economy is.
Share of goods exports going to other Member States, 2025
| Country | % of goods exports | Gap to EU averagepercentage points, derived |
|---|---|---|
| Luxembourg | 83.1 | +22.0 |
| Czechia | 78.8 | +17.7 |
| Slovakia | 78.3 | +17.2 |
| European Unionaggregate | 61.1 | — |
| Slovenia | 49.2 | −11.9 |
| Ireland | 33.5 | −27.6 |
| Cyprus | 27.6 | −33.5 |
This table as data: CSV · JSON
Every Member State for this indicator+
Members see every Member State for this indicator here, not only the rows the ranking prints. Become a Member
Embed this chart
Paste this code into a page. The frame carries the source and the extraction date, and links back to the study.
What these figures cannot tell you
- Goods only, not services
- This dataset covers trade in goods. Services exports, which for several Member States are larger than goods exports, follow a different geography and are not included here.
- Destination is where goods are shipped
- Trade statistics record the country a shipment is sent to, which need not be where the product is finally consumed. Goods entering the Union through one Member State and moving on are attributed differently from goods sold directly, which affects the figures for the large port economies in particular.
- Exports are counted at gross value
- A product assembled from imported components counts at its full value on export. In closely integrated supply chains the same value can be recorded several times as it crosses borders, which inflates intra-EU flows relative to extra-EU ones.
- A single year
- Trade patterns shift with exchange rates, energy prices and demand in individual partner markets. A 2025 reading describes that year rather than a fixed structure.
Frequently asked questions
- How much EU trade is with other EU countries?
- 61.1% of the goods EU Member States exported in 2025 went to other Member States. The single market absorbs roughly three fifths of the Union's goods exports by value.
- Which EU country trades most within the single market?
- Luxembourg at 83.1% of goods exports, followed by Czechia at 78.8% and Slovakia at 78.3%. The central European manufacturing economies are the most integrated into the internal market.
- Which EU country trades least within the single market?
- Cyprus at 27.6% and Ireland at 33.5%, the only two Member States below 40%. Ireland's exports are concentrated in pharmaceutical and medical products whose principal market is outside the Union.
- Do the largest EU economies depend most on the single market?
- Not in any simple way. Germany at 55.9%, France at 53.7% and Italy at 51.3% all send a smaller share of their goods exports to other Member States than the EU average of 61.1% — but the Netherlands at 69.1% and Belgium at 69.0% are also among the Union's largest exporters and sit well above it. Size does not decide the share. The smaller manufacturing economies are the most exposed ones.
Methodological note
Eurostat publishes trade in goods by Member State split between partners inside and outside the Union. This study uses total goods exports by value for 2025, with the partner dimension taken at both EU27 and extra-EU27.
The share reported here is intra-EU exports divided by the sum of intra-EU and extra-EU exports, computed by Silver Data Lab for each Member State and for the EU aggregate. The counts of Member States below 50% and below 40%, and the ranking of Member States by total goods exports used to place the Netherlands and Belgium among the largest exporters, are derived from the same extraction.
Values are for 2025, the most recent year with complete coverage of the 27 Member States at the extraction date.
Source data
The underlying series can be inspected and re-downloaded from the Eurostat data browser. The filters below are the ones applied.
Intra and Extra-EU trade by Member State and by product group
ext_lt_intratrd
- Filters applied:
- freq=A · indic_et=MIO_EXP_VAL · sitc06=TOTAL · partner=EU27_2020, EXT_EU27_2020 · time=2025
- Extracted:
- 2026-10-17
- Source last updated:
- 2026-10-16
Download the data
The data the study you have just read is built on, exactly as it was downloaded and archived.
Yours as a Member.
Data downloadable by Members
How to cite
Record the vintage as well as the study: the figures on this page are the ones extracted on the dates below.
Silver Data Lab Research Desk (2026). EU Countries Sell 61.1% of Their Goods Exports to Each Other. Silver Data Lab, published 19 July 2026, last updated 17 October 2026. https://www.silverdatalab.com/studies/intra-eu-trade-in-the-eu
- Data: Eurostat, Intra and Extra-EU trade by Member State and by product group (ext_lt_intratrd), filters freq=A, indic_et=MIO_EXP_VAL, sitc06=TOTAL, partner=EU27_2020, EXT_EU27_2020, time=2025; extracted 2026-10-17; source last updated 2026-10-16. https://doi.org/10.2908/ext_lt_intratrd
Silver Data Lab's analysis is licensed CC BY 4.0. The statistics remain their publisher's and keep its terms of reuse.
Ask the research desk
A question about this study — a definition, a filter, a break in the series, what the figures can and cannot support — answered by the desk that made the extraction.
Members can write to the research desk
Other studies on the same dataset
Studies where the same country leads or trails
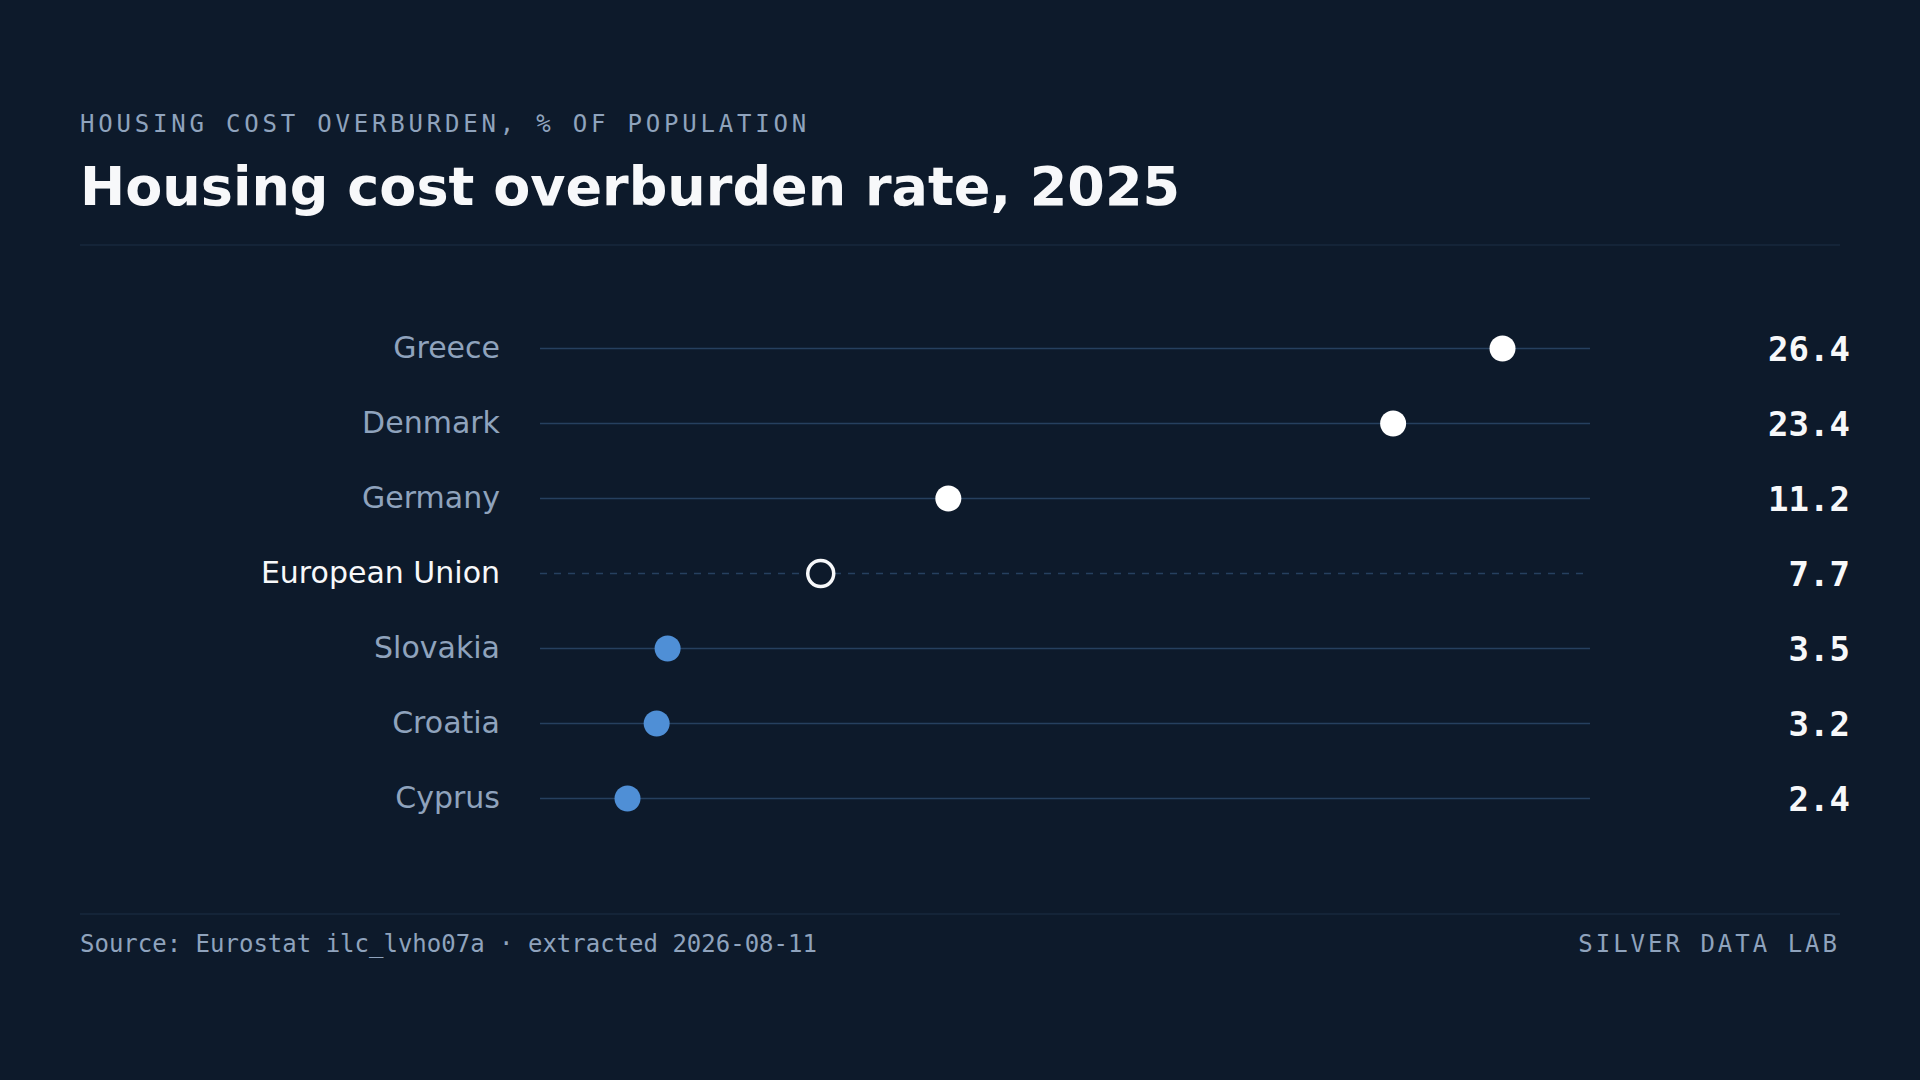
A Quarter of Greeks Spend More Than 40% of Income on Housing
7.7% of the EU population spent more than 40% of disposable income on housing in 2025.
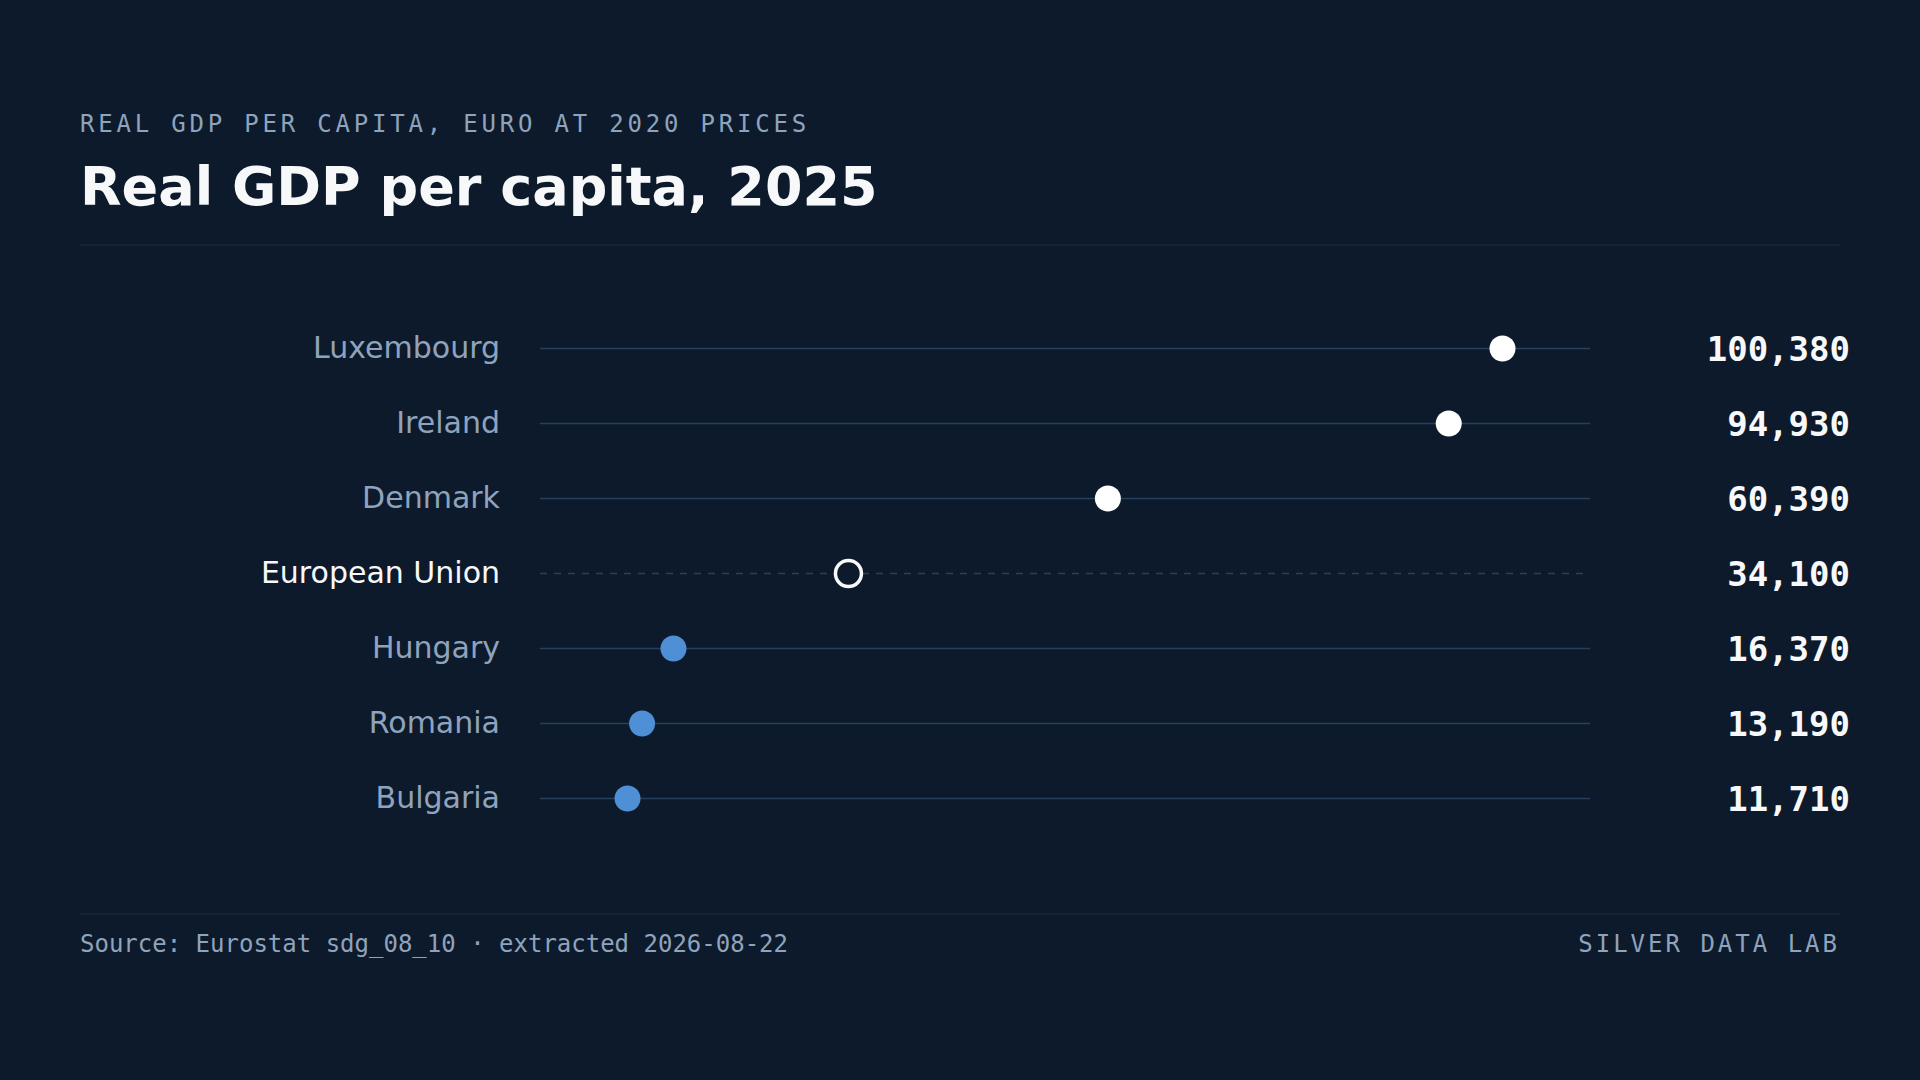
Bulgaria's GDP per Person Is About a Third of the EU Average
EU real GDP per capita was 34,250 euro in 2025, at 2020 prices.
Denmark Has the EU's Biggest Surplus With the World, at 12.3% of GDP
Denmark ran a current account surplus worth 12.3% of GDP in 2025, the largest in the Union.