Germany's Goods Surplus With the Rest of the World Is Larger Than the Whole EU's
Silver Data Lab Research Desk · Statistical analysis · Published on 17 September 2026
- Data source
- Eurostat
- Reference period
- 2025
- Last updated
- 17 September 2026
Re-checked against the source on 17 September 2026. No value in its datasets has moved between the snapshots we hold. Every revision we have observed →
Key estimates
- EU Member States together ran a goods trade surplus of 114.1 billion euro with countries outside the Union in 2025.
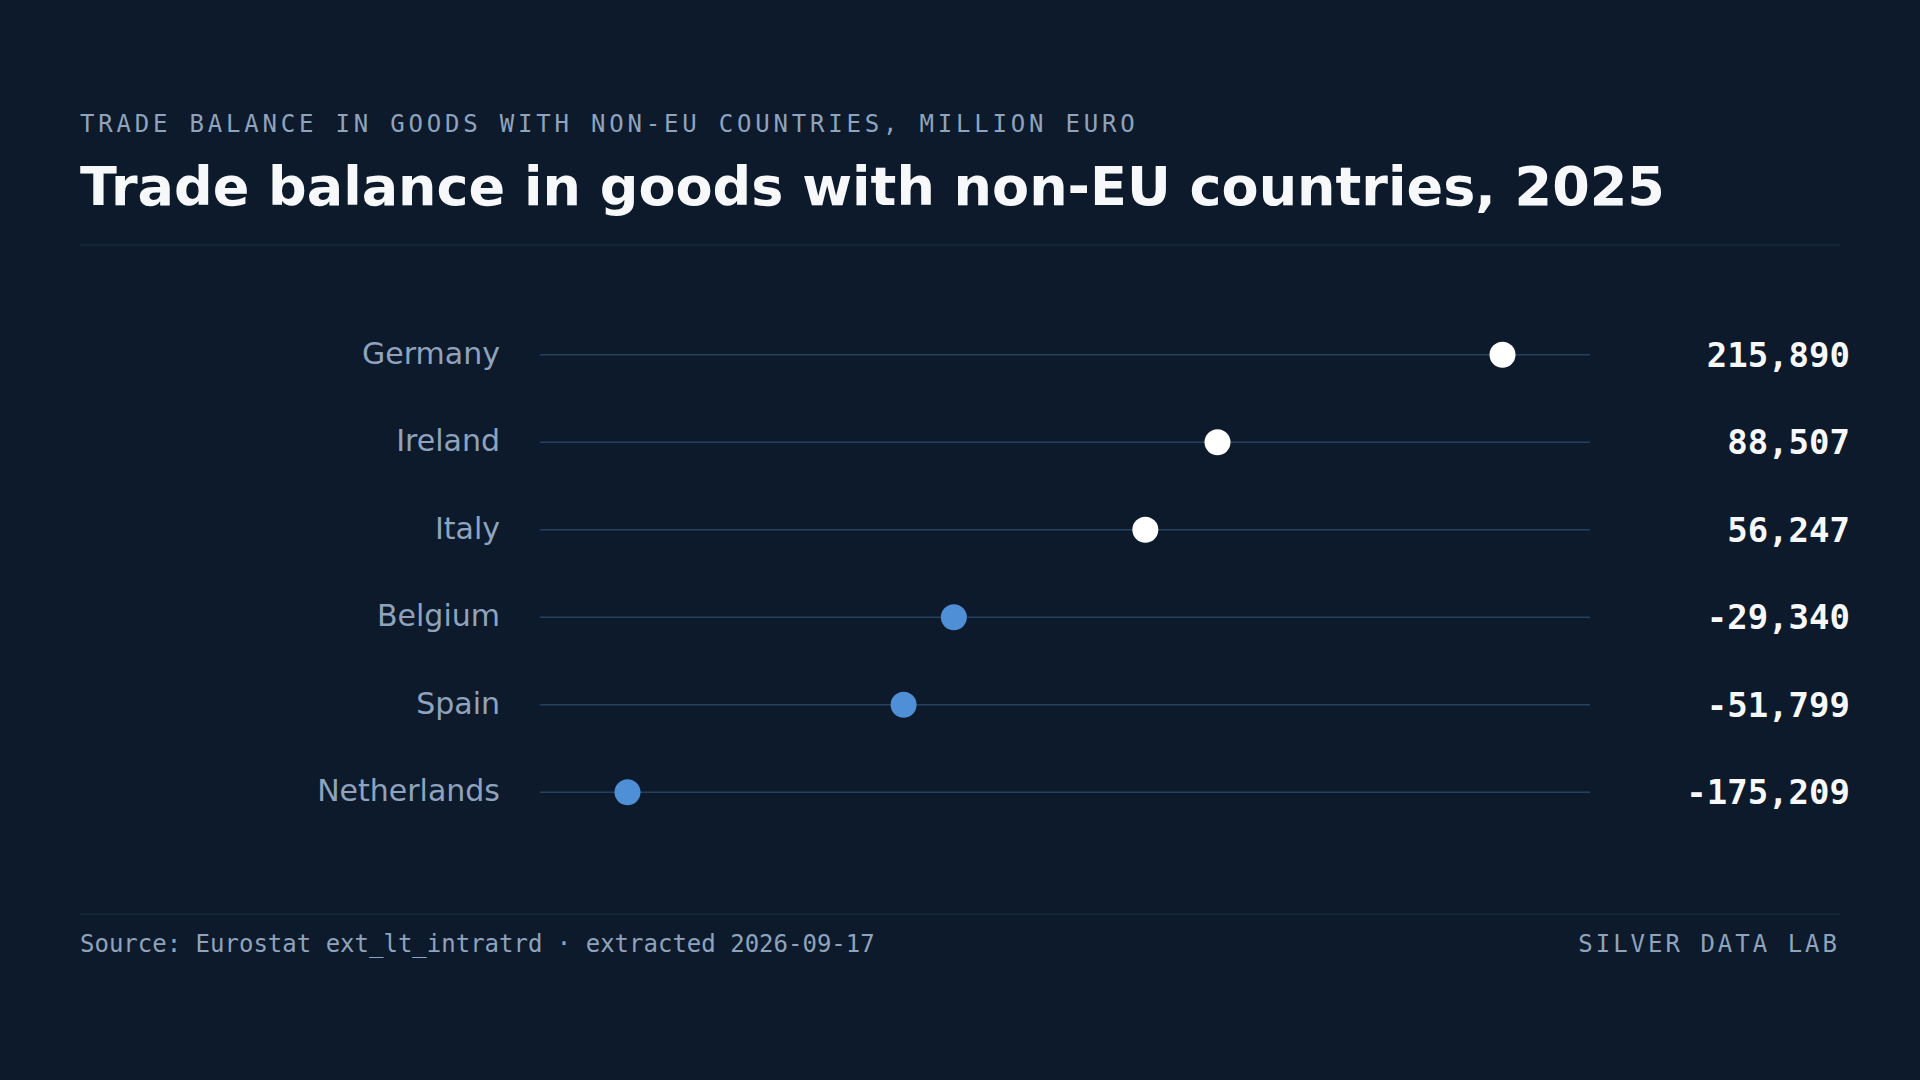
- Germany's surplus with non-EU countries was 215.9 billion euro, 1.9 times the EU total; Ireland followed at 88.5 billion and Italy at 56.2 billion.
- The Netherlands recorded a deficit of 175.2 billion euro, Spain 51.8 billion and Belgium 29.3 billion. Sixteen Member States were in deficit and eleven in surplus.
- By product, the EU's surplus is in chemicals at 255.9 billion euro and in machinery and transport equipment at 173.2 billion, against a deficit of 298.0 billion in mineral fuels.
- The Dutch and Belgian deficits are partly a recording effect: goods entering the Union through Rotterdam and Antwerp are counted as their imports even when they are bound for other Member States.
A surplus made in one country
In 2025 the 27 Member States exported 114.1 billion euro more in goods to the rest of the world than they imported from it. That is the Union's goods surplus, and it is a modest figure next to the balances of the countries that make it up.
Germany alone recorded a surplus of 215.9 billion euro with non-EU countries. That is 1.9 times the EU total: the other twenty-six Member States together ran a deficit of 101.8 billion euro with the rest of the world, and Germany's surplus paid for it with room to spare. Both figures are derived here from the published balances.
Ireland follows at 88.5 billion euro and Italy at 56.2 billion. Those three surpluses sum to 360.6 billion, more than three times the Union's net position. Sweden at 25.3 billion, Denmark at 20.2 billion, France at 19.4 billion, Austria at 16.8 billion and Finland at 11.0 billion complete the list of substantial surpluses; Slovakia at 3.2 billion, Latvia at 2.3 billion and Estonia at 0.7 billion are the remaining three. Eleven Member States were in surplus with the rest of the world.
Sixteen in deficit
The Netherlands recorded a deficit of 175.2 billion euro, by far the largest in the Union, and Spain 51.8 billion. Belgium at 29.3 billion, Poland at 27.4 billion and Greece at 15.7 billion follow. Czechia, Romania and Bulgaria are each between 7 and 10 billion in deficit, and the remaining eight deficits are below 5 billion euro each.
Summed, the eleven surpluses come to 459.4 billion euro and the sixteen deficits to 345.3 billion. The Union's headline figure is the difference between two much larger numbers.
The port effect
The Dutch and Belgian figures need reading with care, and Eurostat's own methodology explains why. Extra-EU trade is recorded by the Member State where goods clear customs. A container from Shanghai unloaded at Rotterdam and driven on to a warehouse in Germany counts as a Dutch import from China, and then as an intra-EU shipment from the Netherlands to Germany. The goods never belonged to a Dutch buyer, but the extra-EU deficit lands in the Dutch accounts.
The Netherlands and Belgium hold the Union's two largest seaports, and together they record a deficit of 204.5 billion euro with the rest of the world. Some part of that is Dutch and Belgian consumption; some part is Europe's imports passing through. The statistics do not separate the two, and neither does this study.
The mirror of that effect is that Germany's own surplus is understated, since some of its imports from outside the Union arrive in the accounts as intra-EU purchases from the Netherlands. The country-by-country balances are exact as records of where goods were declared; as records of who consumes what, they are approximations.
What the Union sells and what it buys
The composition of the surplus is a different story from its geography. Across all 27 Member States, the EU ran a surplus of 255.9 billion euro in chemicals and related products, which includes pharmaceuticals, and of 173.2 billion in machinery and transport equipment. Food, drink and tobacco added 39.9 billion and unclassified commodities 21.3 billion.
Against that stand deficits of 298.0 billion euro in mineral fuels, 49.3 billion in other manufactured goods and 28.9 billion in raw materials. The fuel deficit alone absorbs 69.4% of the combined chemicals and machinery surplus, a share derived here from the published figures.
Read together, the two rankings say the same thing twice. The Union earns its surplus by selling medicines, machines and vehicles, most of them from a few Member States, and spends most of it on the fuel it does not produce.
Trade balance in goods with non-EU countries, 2025
| Country | million euro |
|---|---|
| Germany | 215,890 |
| Ireland | 88,507 |
| Italy | 56,247 |
| Belgium | -29,340 |
| Spain | -51,799 |
| Netherlands | -175,209 |
This table as data: CSV · JSON
Every Member State for this indicator+
Members see every Member State for this indicator here, not only the rows the ranking prints. Become a Member
Embed this chart
Paste this code into a page. The frame carries the source and the extraction date, and links back to the study.
EU trade balance in goods with non-EU countries by product group, 2025
| Country | million euro |
|---|---|
| Chemicals and related products | 255,915 |
| Machinery and transport equipment | 173,238 |
| Food, drink and tobacco | 39,873 |
| Commodities not classified elsewhere | 21,295 |
| Raw materials | -28,914 |
| Other manufactured goods | -49,311 |
| Mineral fuels and lubricants | -297,958 |
This table as data: CSV · JSON
Every Member State for this indicator+
Members see every Member State for this indicator here, not only the rows the ranking prints. Become a Member
Embed this chart
Paste this code into a page. The frame carries the source and the extraction date, and links back to the study.
What these figures cannot tell you
- Goods cross borders where they are declared
- Extra-EU imports are recorded by the Member State where they clear customs, not where they are consumed. Goods arriving at Rotterdam or Antwerp for onward sale elsewhere in the Union inflate the Dutch and Belgian deficits and understate those of the destination countries. Eurostat documents this as quasi-transit; it is a property of the method rather than an error in the data.
- Goods only
- This is trade in goods. Services are outside it and are the subject of a separate study on this site, where Ireland's position in particular looks very different. A country's surplus in goods can coexist with a deficit in services and vice versa.
- Ireland's surplus is a multinational surplus
- Ireland's 88.5 billion euro surplus is dominated by pharmaceutical and chemical exports from foreign-owned plants. The goods leave Ireland and the export is real, but the income it generates largely accrues to non-resident owners, which is why Ireland's national accounts figures are treated as outliers elsewhere on this site.
- A balance is not a volume
- A small balance can result from large exports and large imports that nearly cancel. The ranking says nothing about how much a Member State trades with the rest of the world, only about the difference between the two directions.
Frequently asked questions
- Does the EU have a trade surplus with the rest of the world?
- In goods, yes: 114.1 billion euro in 2025. Chemicals at 255.9 billion and machinery and transport equipment at 173.2 billion are in surplus; mineral fuels at 298.0 billion are the largest deficit. Services are a separate account and are not included here.
- Which EU country has the largest surplus with non-EU countries?
- Germany, at 215.9 billion euro in 2025, followed by Ireland at 88.5 billion and Italy at 56.2 billion. Germany's surplus alone is 1.9 times the Union's total, so the other twenty-six Member States together were in deficit with the rest of the world.
- Why does the Netherlands have such a large deficit?
- Its 175.2 billion euro deficit is partly a recording effect. Goods unloaded at Rotterdam and bound for other Member States are counted as Dutch imports from outside the EU, then as intra-EU shipments onwards. Eurostat calls this quasi-transit; the statistics do not separate it from Dutch consumption, and neither does this study.
- How many EU countries are in deficit with the rest of the world?
- Sixteen of the 27 in 2025, against eleven in surplus. The sixteen deficits sum to 345.3 billion euro and the eleven surpluses to 459.4 billion; the difference is the Union's surplus of 114.1 billion.
Methodological note
Eurostat publishes the trade balance in goods of each Member State with partners outside the EU, in million euro, from the international trade in goods statistics. This study uses the annual figures for 2025 with the partner set to countries outside the EU-27 and all products, for the 27 Member States and for the EU aggregate; the extraction is archived.
A second extraction from the same dataset, for the EU aggregate only, gives the balance by product group of the Standard International Trade Classification: food, drink and tobacco; raw materials; mineral fuels; chemicals; other manufactured goods; machinery and transport equipment; and commodities not classified elsewhere. The seven groups sum to the total.
The rankings show the published values in million euro, rounded to the nearest million. In the text, values are expressed in billion euro rounded to one decimal place. The ratio of Germany's surplus to the EU total, the combined balance of the other twenty-six Member States, the sums of surpluses and deficits, the combined Dutch and Belgian deficit and the share of the fuel deficit in the chemicals and machinery surplus are computed by Silver Data Lab from the published balances and labelled as derived.
Source data
This study draws on 2 datasets from Eurostat. Each can be inspected and re-downloaded from its catalogue, and the filters below are the ones applied.
Intra and extra-EU trade by Member State and by product group
ext_lt_intratrd
- Filters applied:
- freq=A · indic_et=MIO_BAL_VAL · partner=EXT_EU27_2020 · sitc06=TOTAL · time=2025
- Extracted:
- 2026-09-17
- Source last updated:
- 2026-09-15
Intra and extra-EU trade by Member State and by product group
ext_lt_intratrd
- Filters applied:
- freq=A · indic_et=MIO_BAL_VAL · partner=EXT_EU27_2020 · geo=EU27_2020 · sitc06=TOTAL, SITC0_1, SITC2_4, SITC3, SITC5, SITC6_8, SITC7, SITC9 · time=2025
- Extracted:
- 2026-09-17
- Source last updated:
- 2026-09-15
Download the data
The data the study you have just read is built on, exactly as it was downloaded and archived.
Yours as a Member.
Data downloadable by Members
How to cite
Record the vintage as well as the study: the figures on this page are the ones extracted on the dates below.
Silver Data Lab Research Desk (2026). Germany's Goods Surplus With the Rest of the World Is Larger Than the Whole EU's. Silver Data Lab, published 17 September 2026, last updated 17 September 2026. https://www.silverdatalab.com/studies/extra-eu-trade-balance-in-the-eu
- Data: Eurostat, Intra and extra-EU trade by Member State and by product group (ext_lt_intratrd), filters freq=A, indic_et=MIO_BAL_VAL, partner=EXT_EU27_2020, sitc06=TOTAL, time=2025; extracted 2026-09-17; source last updated 2026-09-15. https://doi.org/10.2908/ext_lt_intratrd
- Data: Eurostat, Intra and extra-EU trade by Member State and by product group (ext_lt_intratrd), filters freq=A, indic_et=MIO_BAL_VAL, partner=EXT_EU27_2020, geo=EU27_2020, sitc06=TOTAL, SITC0_1, SITC2_4, SITC3, SITC5, SITC6_8, SITC7, SITC9, time=2025; extracted 2026-09-17; source last updated 2026-09-15. https://doi.org/10.2908/ext_lt_intratrd
Silver Data Lab's analysis is licensed CC BY 4.0. The statistics remain their publisher's and keep its terms of reuse.
Ask the research desk
A question about this study — a definition, a filter, a break in the series, what the figures can and cannot support — answered by the desk that made the extraction.
Members can write to the research desk
Other studies on the same dataset
Studies where the same country leads or trails
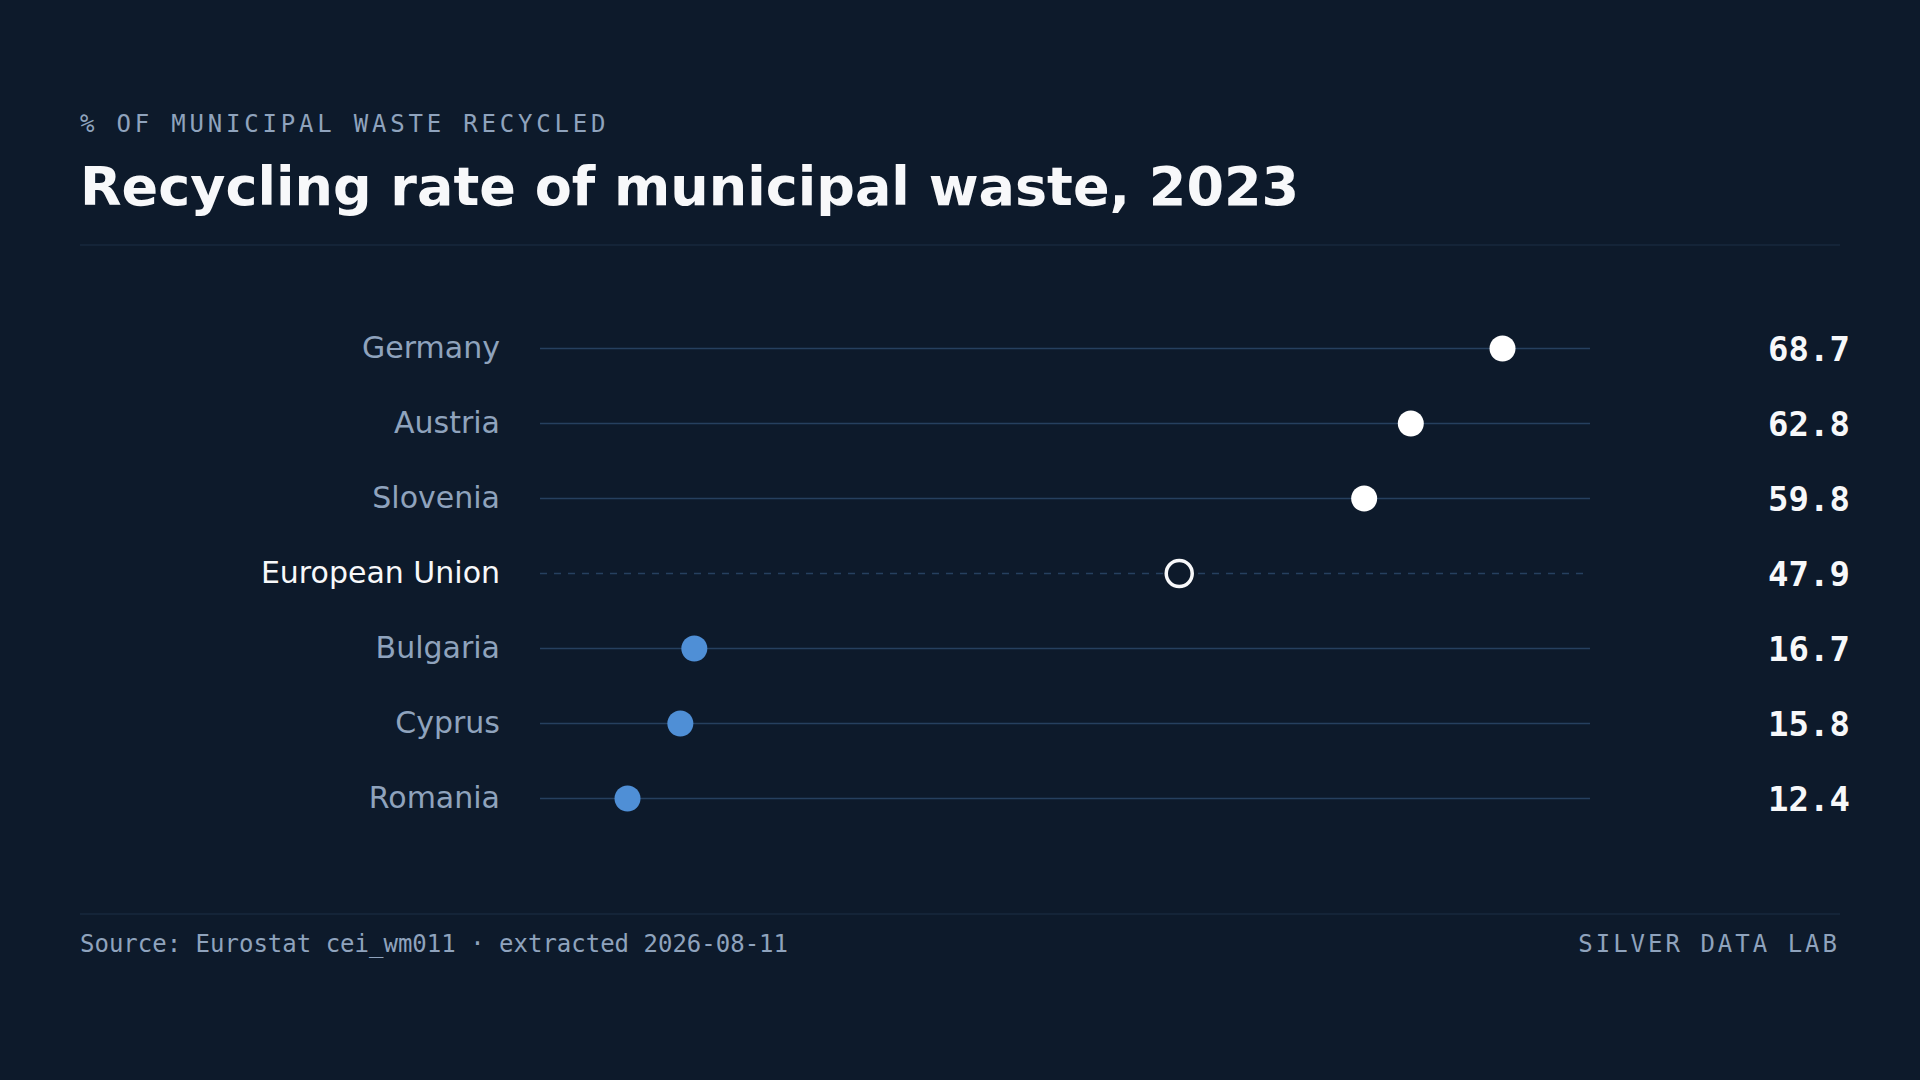
Germany Recycles Five Times as Much of Its Rubbish as Romania
The EU recycled 47.9% of its municipal waste in 2023, slightly under half.
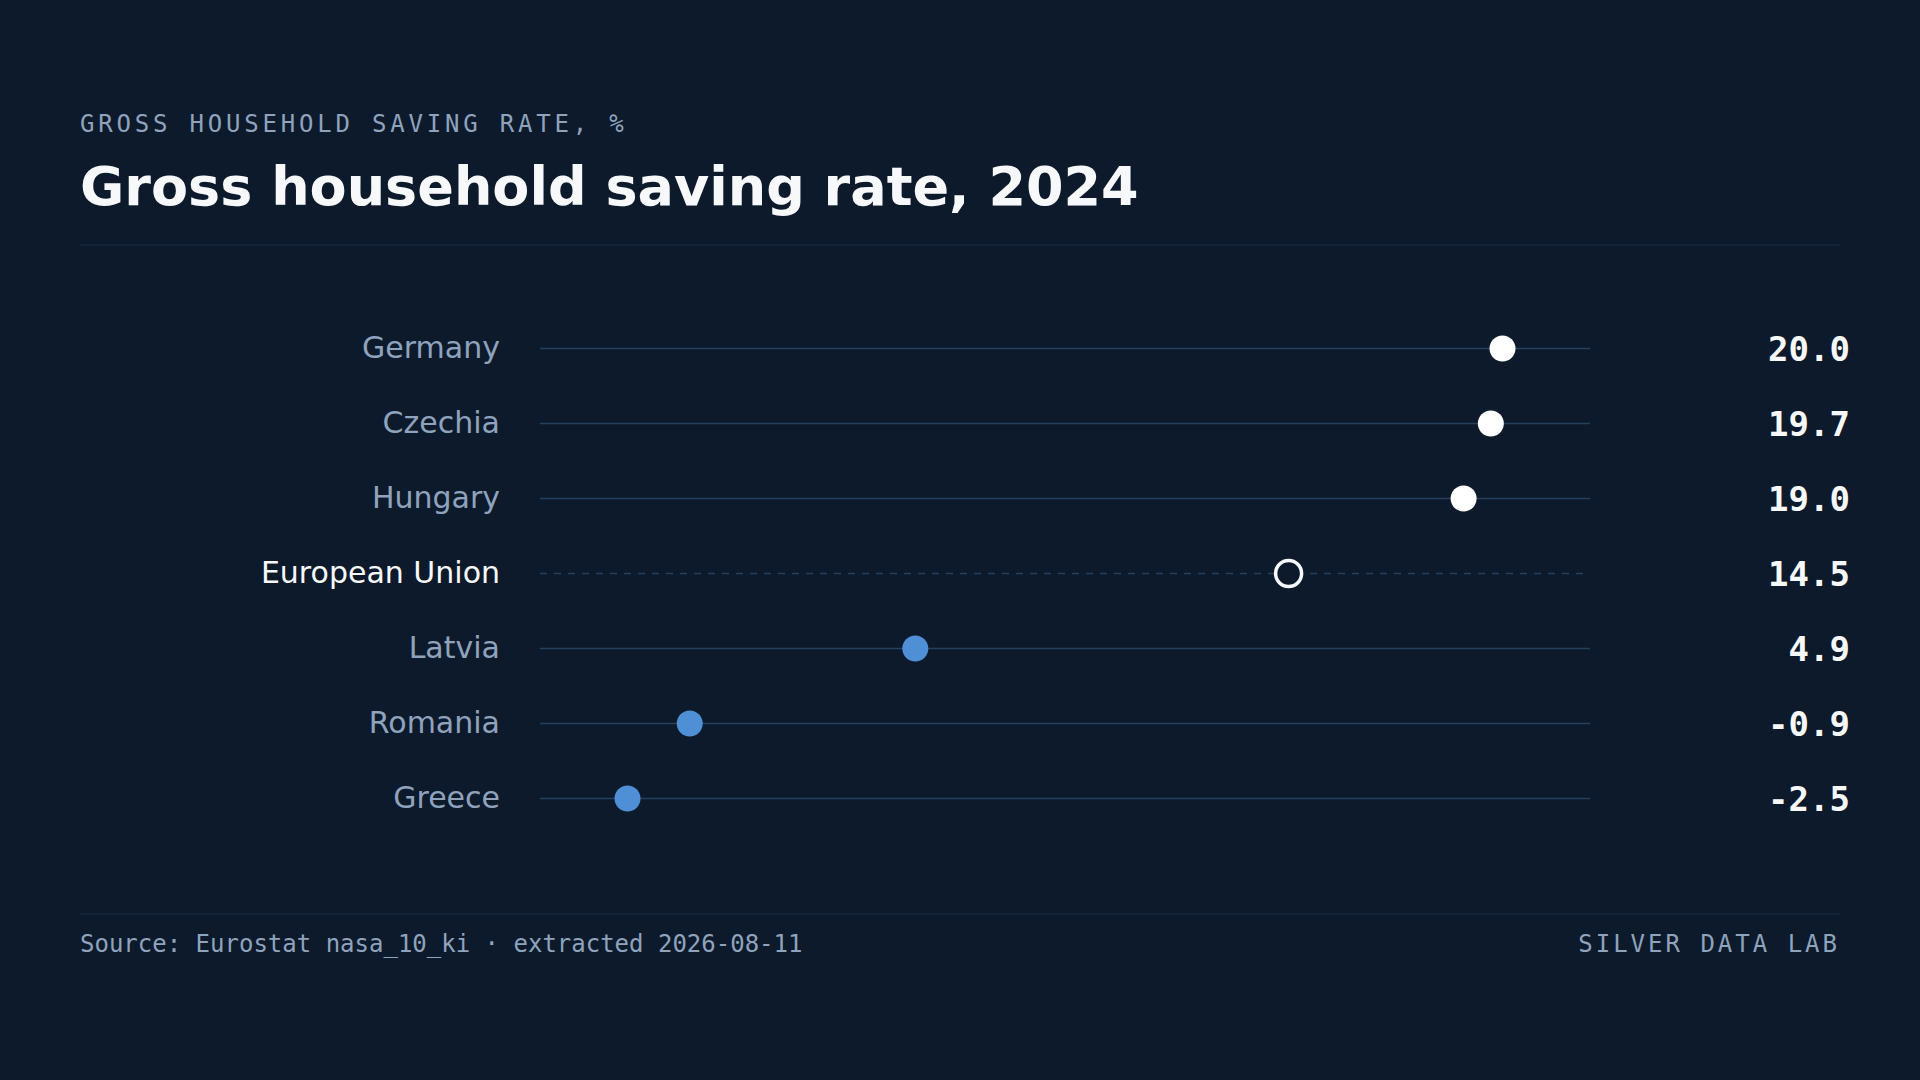
In Two EU Countries, Households Spend More Than They Earn
EU households saved 14.5% of their gross disposable income in 2024.
The Same Unemployment Rate Can Mean Two Different Things
33.2% of unemployed people aged 20 to 64 in the EU had been out of work for twelve months or more in 2025 — 4.0 million people.