In Two EU Countries, Households Spend More Than They Earn
Silver Data Lab Research Desk · Statistical analysis · Published on 30 July 2026
- Data source
- Eurostat
- Reference period
- 2024
- Last updated
- 15 October 2026
Re-checked against the source on 15 October 2026. 73 values in its datasets moved between snapshots, 2 of them figures stated on this page. Every revision we have observed →
Key estimates
- EU households saved 14.5% of their gross disposable income in 2024.
- In Greece the rate was −2.5% and in Romania −0.9%: households in both spent more than they received.
- Hungary recorded the highest rate at 19.8%, ahead of Czechia at 19.7% and Germany at 19.6%.
- The distance between Hungary and Greece is 22.3 percentage points of household income.
- Data cover 26 of 27 Member States: Bulgaria's series stops at 2022.
A rate that can fall below zero
Many of the ratios used to compare European economies cannot go below zero at all: a share of the population — in work, at risk of poverty, in overcrowded housing — has no negative value available to it. The household saving rate does have one, and two Member States recorded it in 2024.
The rate measures what is left of household income after consumption, expressed as a share of gross disposable income. A negative value is not a statistical artefact. It means households in aggregate spent more than they received over the year, funding the difference by drawing down savings, borrowing, or selling assets.
The Union's average, and the two countries below zero
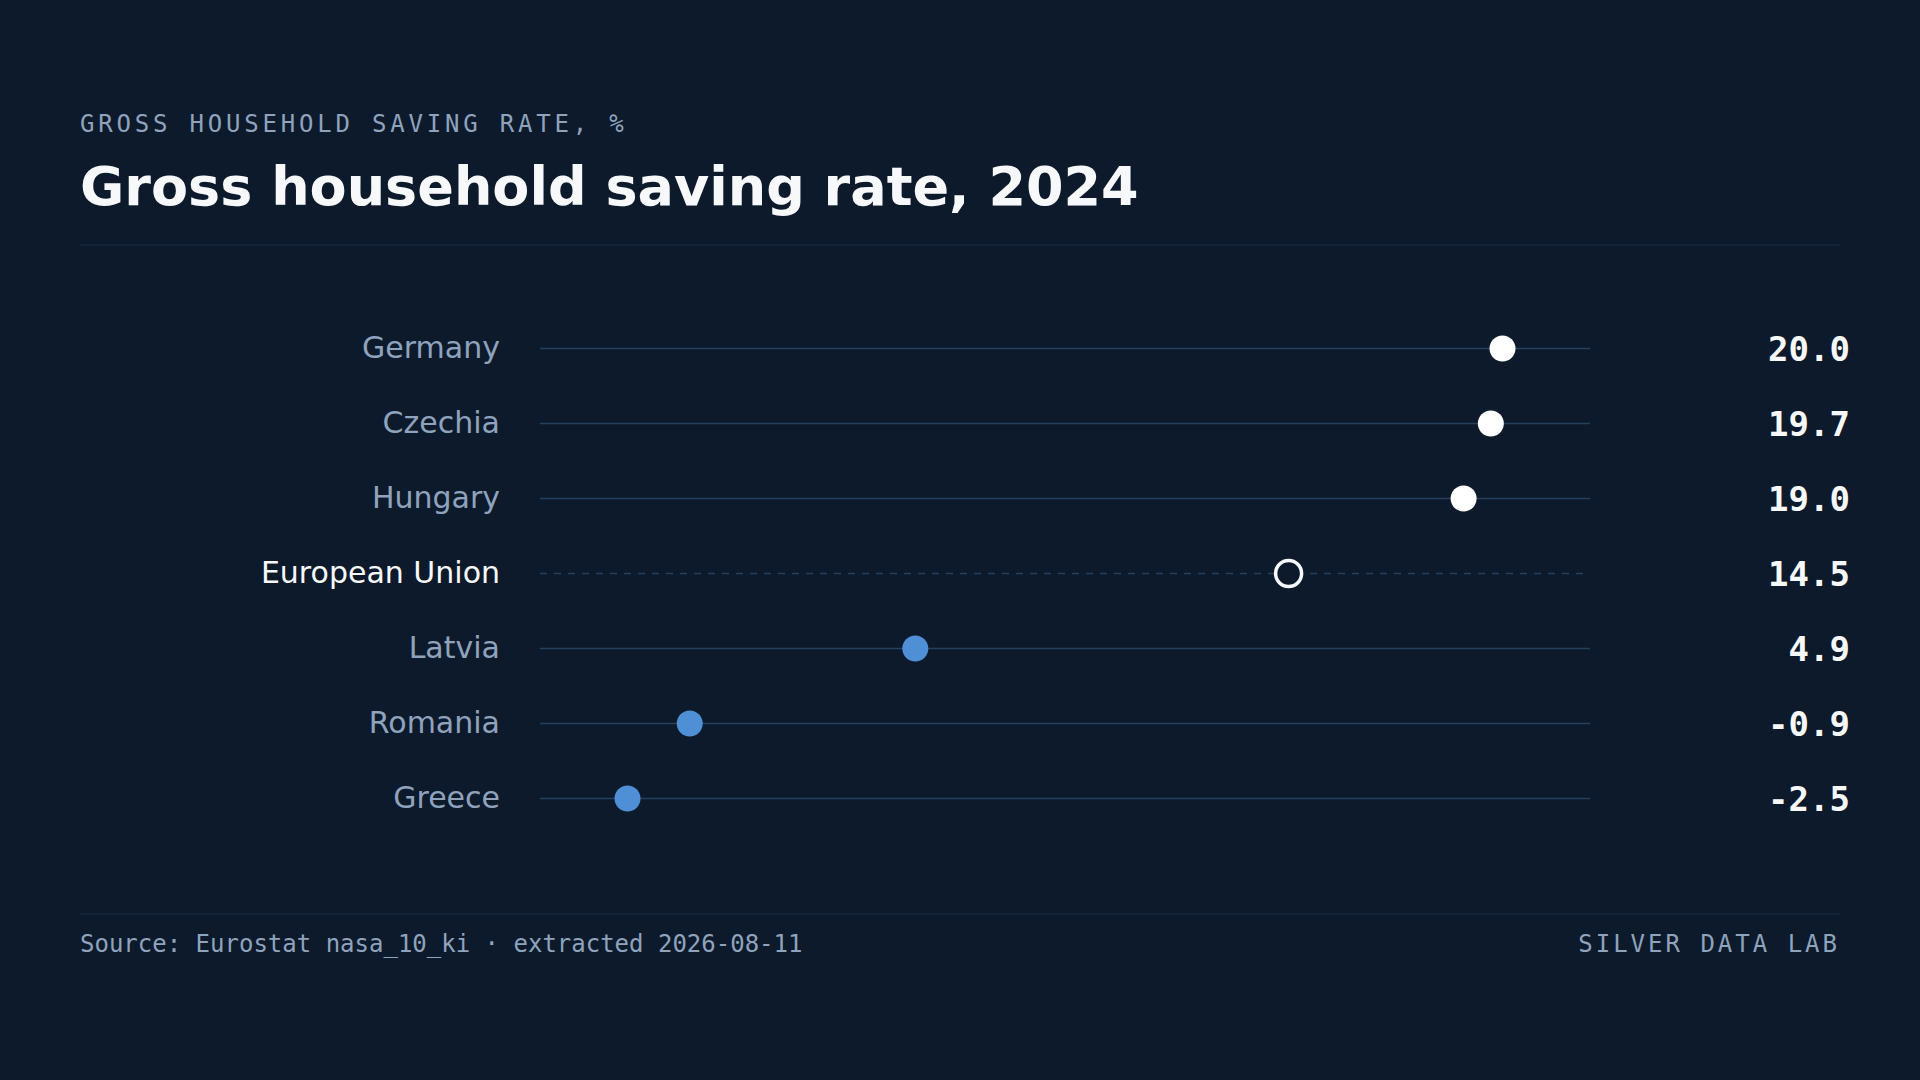
EU households saved 14.5% of gross disposable income in 2024. Greece recorded −2.5% and Romania −0.9%.
The distinction matters because these two countries are otherwise very differently placed. Greece runs a budget surplus and carries the Union's highest public debt; Romania runs the Union's largest deficit with modest public debt. Household behaviour is not tracking the public finances in either case, which is a useful reminder that the household sector is a separate balance sheet with its own pressures.
Latvia at 4.9% and Cyprus at 5.6% sit closest to them, so the bottom of this ranking is a group of four rather than an isolated pair.
Where saving is highest
Hungary records the highest rate at 19.8%, followed by Czechia at 19.7% and Germany at 19.6%. Malta at 18.8% and Sweden at 18.7% follow, then France at 17.9% and Austria at 17.3%.
The gap between the top and bottom of the ranking is 22.3 percentage points of household income, and the two ends differ in kind rather than in degree: Hungarian households kept close to a fifth of what they received, Greek households spent everything they received and more.
What a saving rate is not
A high saving rate is not straightforwardly good news, and a low one is not straightforwardly bad. Saving rises when households are uncertain about the future and postpone spending, which is a symptom rather than an achievement; it falls when consumption is strong, which can reflect confidence as easily as strain.
What a negative rate does establish is narrower and firmer: over the year in question, the household sector as a whole did not cover its consumption out of its income. That is a fact about the composition of the year, and it survives whichever interpretation of saving behaviour is applied to it.
Gross household saving rate, 2024
| Country | % of gross disposable income | Gap to EU averagepercentage points, derived |
|---|---|---|
| Hungary | 19.8 | +5.3 |
| Czechia | 19.7 | +5.2 |
| Germany | 19.6p | +5.1 |
| European Unionaggregate | 14.5 | — |
| Latvia | 4.9 | −9.6 |
| Romania | -0.9p | −15.4 |
| Greece | -2.5p | −17.0 |
Flags carried by the source on these values: p provisional
This table as data: CSV · JSON
Every Member State for this indicator+
Members see every Member State for this indicator here, not only the rows the ranking prints. Become a Member
Embed this chart
Paste this code into a page. The frame carries the source and the extraction date, and links back to the study.
What these figures cannot tell you
- This is the household sector in aggregate, not a typical household
- The rate is computed for all households together, so a small number of high-income households saving heavily can lift a national figure while most households save nothing. A negative national rate likewise does not mean every household dissaved. Distributional questions cannot be answered from sector accounts.
- Gross, not net of depreciation
- This is the gross saving rate: it does not deduct the consumption of fixed capital, principally the depreciation of owner-occupied housing. Net saving rates are lower everywhere, and by different amounts depending on how much housing households own, so the two measures should not be mixed in one comparison.
- The missing Member State's own series is mostly below zero
- Bulgaria's series stops at 2022, so the ranking covers 26 of 27 Member States. Bulgaria has published this indicator — the same extraction holds its figures from 1995 to 2022 — and the series is below zero in 23 of those 28 years, most recently at −6.6%. In the last year in which all 27 Member States report, three were negative rather than two. The absence is a gap in the source rather than a zero, and it is not a neutral one.
- 2024, not 2025
- At the extraction date only twelve Member States had published a 2025 figure, too few to rank. This study therefore uses 2024, the most recent year with near-complete coverage, and its figures are not comparable with the 2025 indicators published elsewhere on this site. Romania is among those twelve, and its provisional 2025 value is positive at 1.8%, so one of the two negative rates has already turned in the following year's partial data. Greece publishes no 2025 figure.
Frequently asked questions
- What is the household saving rate?
- The share of gross disposable income that households do not spend on consumption. Eurostat publishes it for the household sector as a whole, so it describes the aggregate rather than a typical family. EU households saved 14.5% of their income in 2024.
- Can a saving rate be negative?
- Yes, and two Member States recorded one in 2024: Greece at −2.5% and Romania at −0.9%. A negative rate means households in aggregate spent more than they received over the year, funding the gap by drawing down savings, borrowing or selling assets.
- Which EU country saves the most?
- Hungary, at 19.8% of gross disposable income in 2024, followed by Czechia at 19.7% and Germany at 19.6%. The distance between Hungary and Greece is 22.3 percentage points.
- Is a high saving rate a good sign?
- Not necessarily. Saving rises when households are uncertain and postpone spending, and falls when consumption is strong, so the level alone does not distinguish confidence from caution. A negative rate is the one reading with an unambiguous meaning: consumption exceeded income.
Methodological note
The gross household saving rate is published in Eurostat's sector accounts as gross saving divided by gross disposable income, adjusted for the change in pension entitlements, for the households and non-profit institutions serving households sector combined.
The reference year is 2024. The more recent 2025 vintage was available at the extraction date but covered only twelve Member States, which is too few to support a ranking; the choice of year is a coverage decision and is stated rather than left implicit.
The 22.3 point distance between the highest and lowest rate is derived by Silver Data Lab by subtraction from the two published values.
Source data
The underlying series can be inspected and re-downloaded from the Eurostat data browser. The filters below are the ones applied.
Key indicators for sector accounts — annual data
nasa_10_ki
- Filters applied:
- freq=A · sector=S14_S15 · na_item=SRG_S14_S15 · unit=PC · time=2024
- Extracted:
- 2026-10-15
- Source last updated:
- 2026-10-14
Download the data
The data the study you have just read is built on, exactly as it was downloaded and archived.
Yours as a Member.
Data downloadable by Members
How to cite
Record the vintage as well as the study: the figures on this page are the ones extracted on the dates below.
Silver Data Lab Research Desk (2026). In Two EU Countries, Households Spend More Than They Earn. Silver Data Lab, published 30 July 2026, last updated 15 October 2026. https://www.silverdatalab.com/studies/household-saving-in-the-eu
- Data: Eurostat, Key indicators for sector accounts — annual data (nasa_10_ki), filters freq=A, sector=S14_S15, na_item=SRG_S14_S15, unit=PC, time=2024; extracted 2026-10-15; source last updated 2026-10-14. https://doi.org/10.2908/nasa_10_ki
Silver Data Lab's analysis is licensed CC BY 4.0. The statistics remain their publisher's and keep its terms of reuse.
Ask the research desk
A question about this study — a definition, a filter, a break in the series, what the figures can and cannot support — answered by the desk that made the extraction.
Members can write to the research desk
Studies where the same country leads or trails
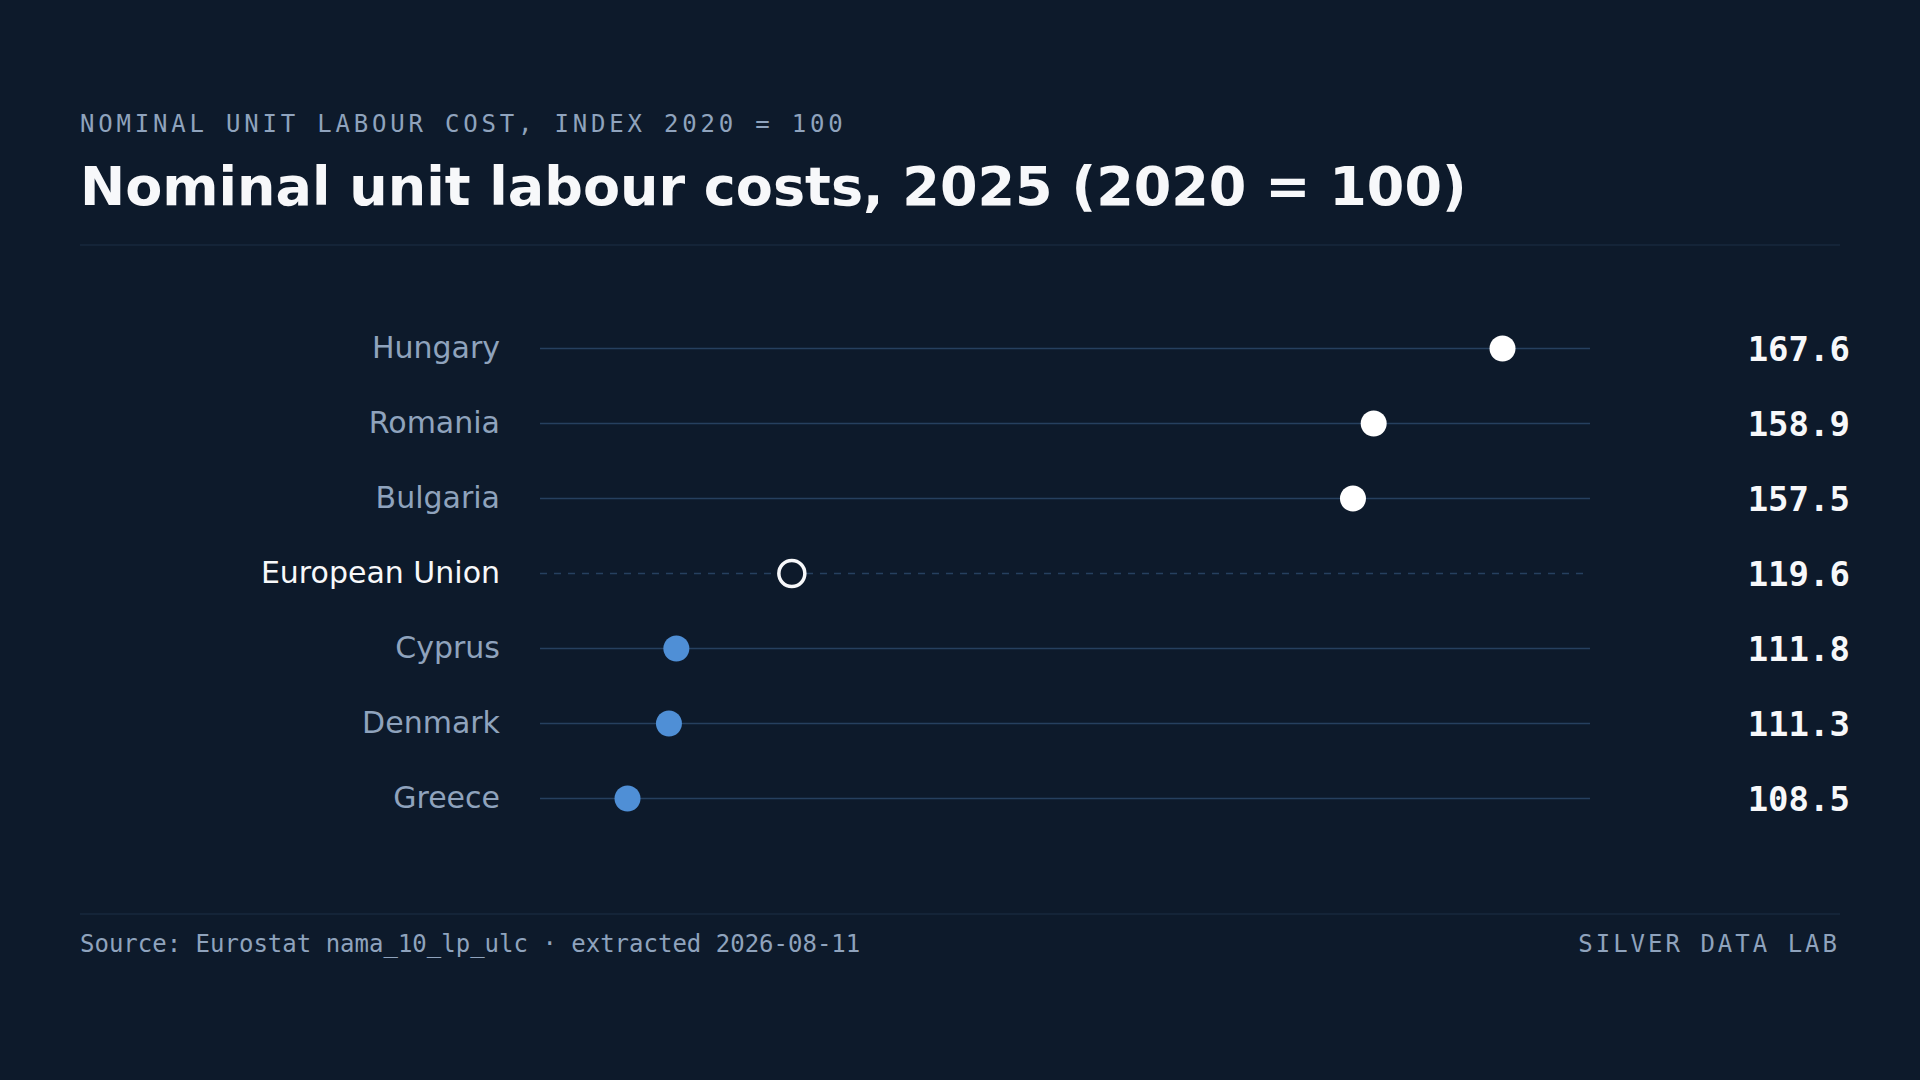
Hungary's Labour Cost per Unit of Output Rose by Over Half in Five Years
EU unit labour costs in 2025 stood at 119.1 against a 2020 base of 100 — 19.1% higher in five years.
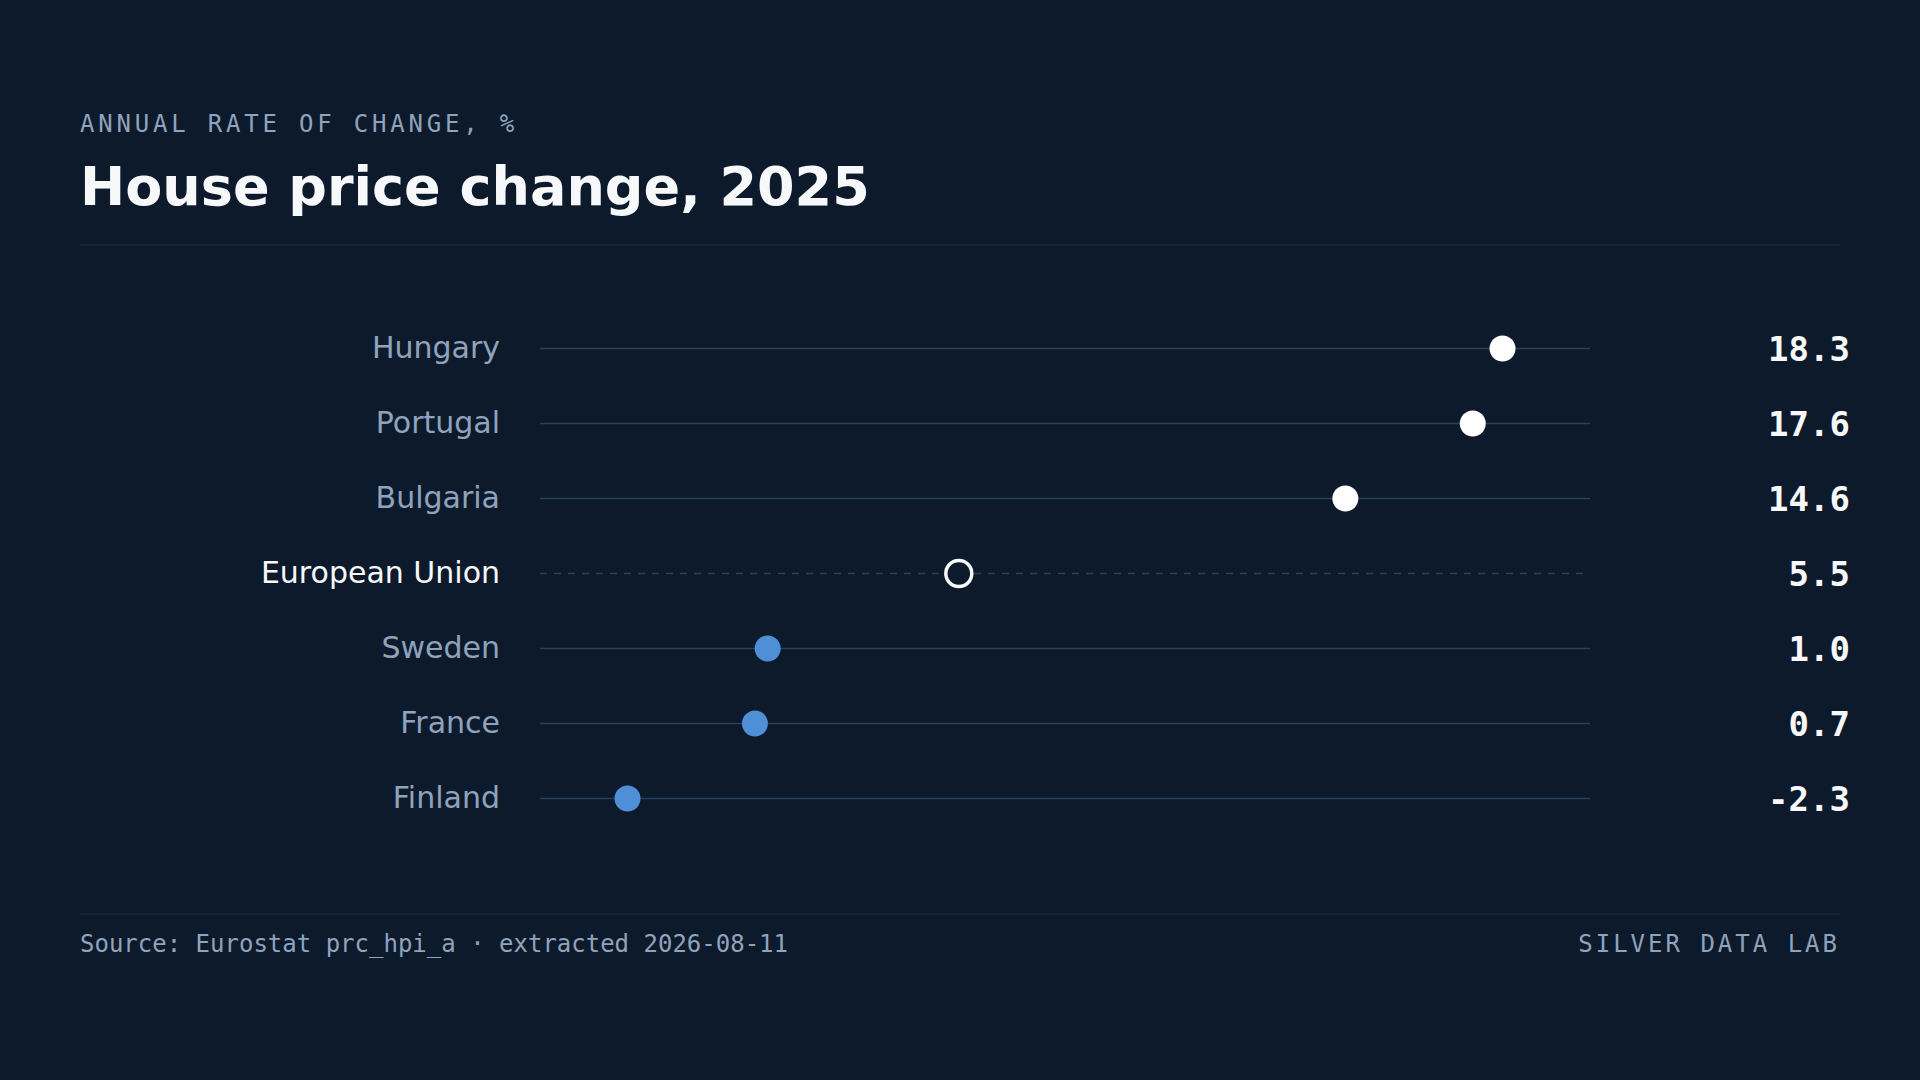
In One Year, House Prices Rose 18.3% in Hungary and Fell in Finland
House prices across the EU rose 5.5% on annual average in 2025.
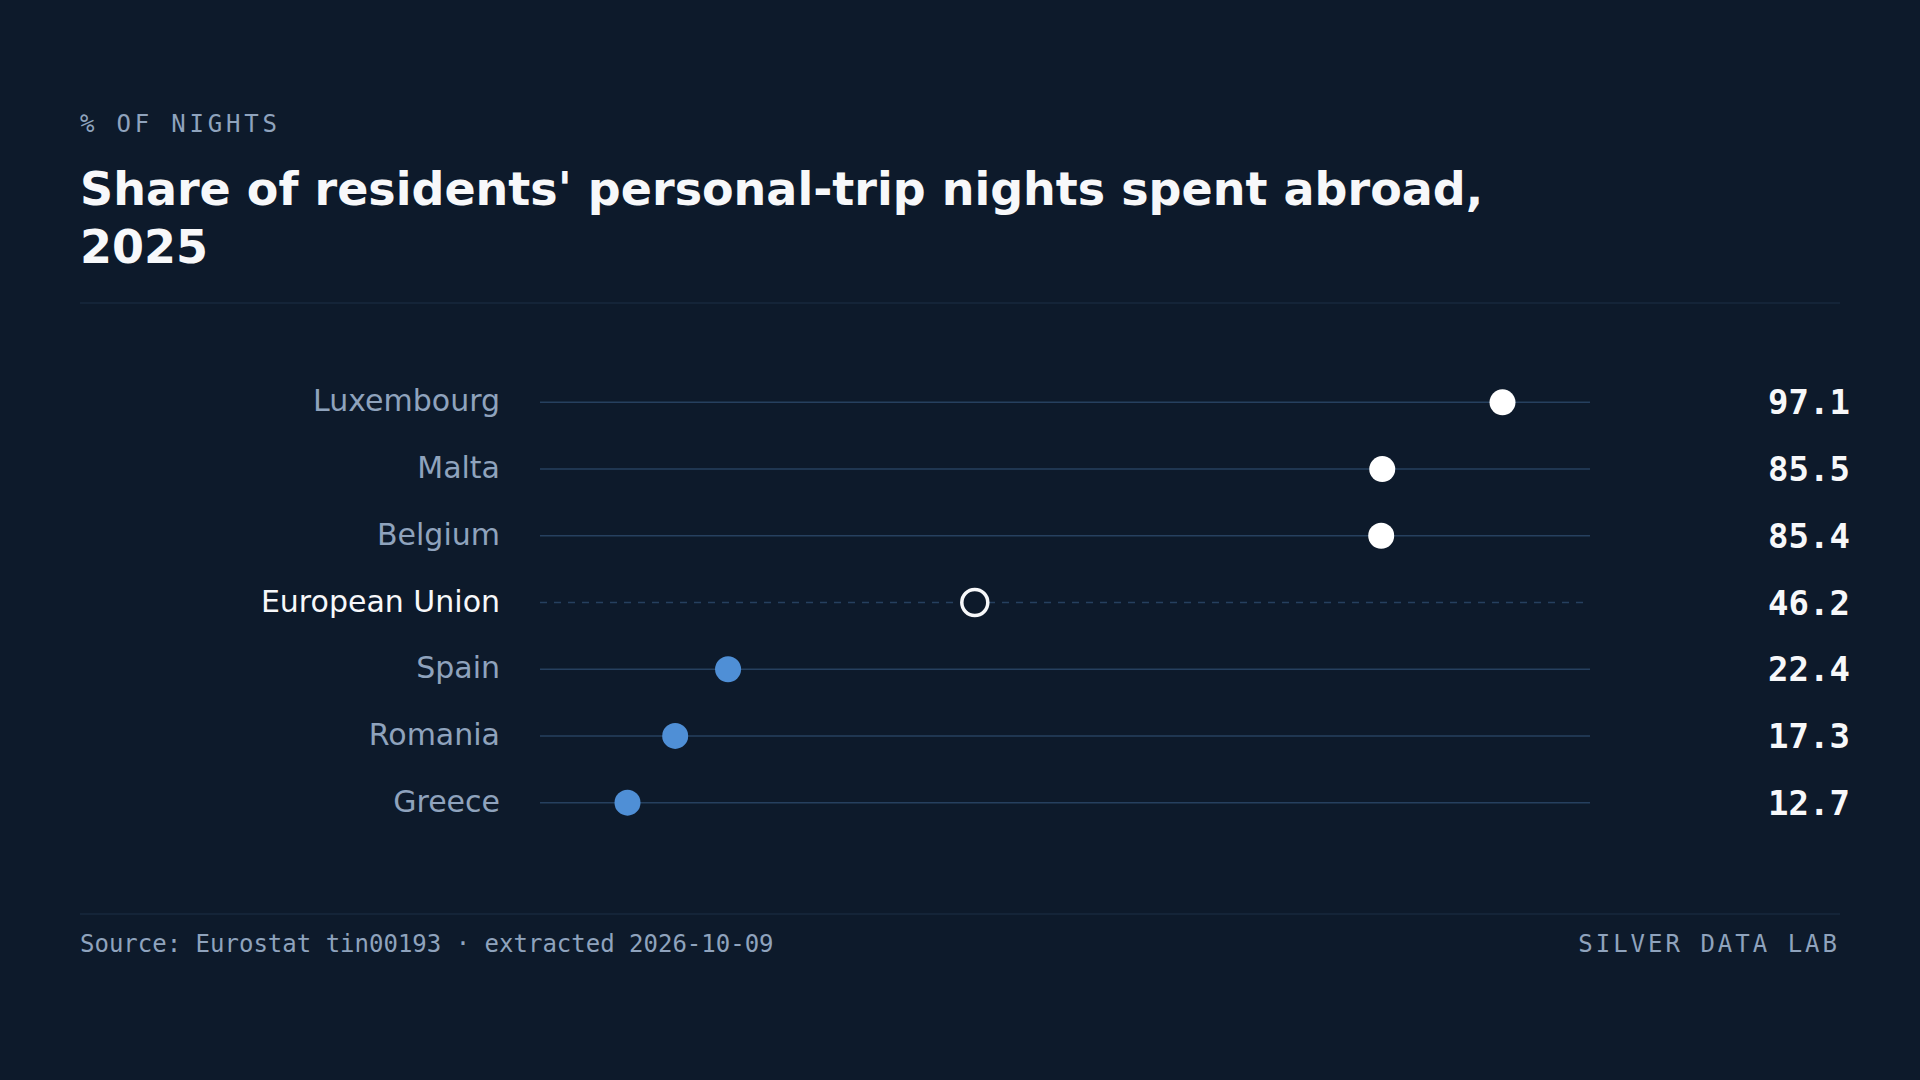
Luxembourg's Residents Spend Nearly All Their Holiday Nights Abroad
In 2025, 46.2% of the nights EU residents spent away from home on personal trips were spent in a country other than their own, against 42.3% in 2019. Both shares are derived by Silver Data Lab from Eurostat's counts of nights.