Bulgaria's GDP per Person Is About a Third of the EU Average
Silver Data Lab Research Desk · Statistical analysis · Published on 11 August 2026
- Data source
- Eurostat
- Reference period
- 2025
- Last updated
- 21 October 2026
Re-checked against the source on 23 October 2026. 40 values in its datasets moved between snapshots, 6 of them figures stated on this page. Every revision we have observed →
Key estimates
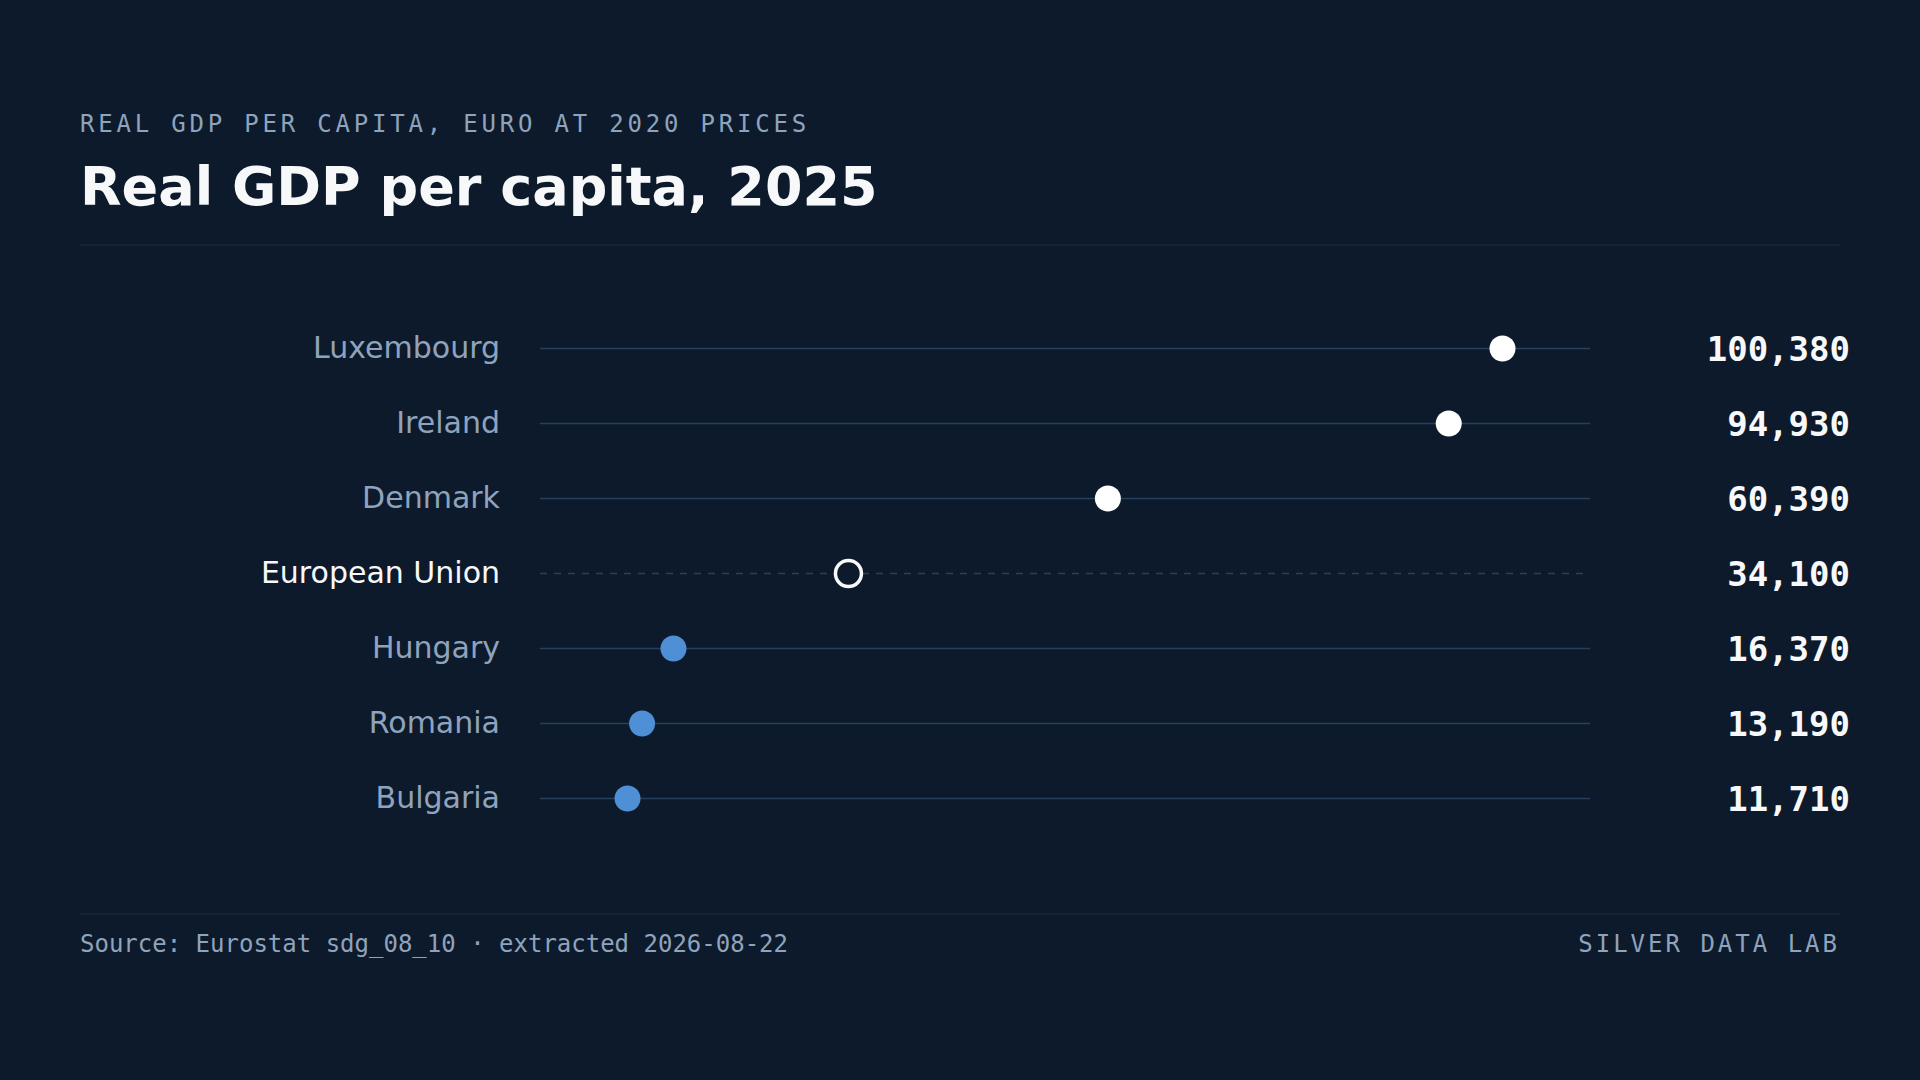
- EU real GDP per capita was 34,250 euro in 2025, at 2020 prices.
- Luxembourg records 102,840 euro and Ireland 94,930.
- Bulgaria records 11,470 euro, Romania 13,300 and Hungary 16,410.
- The ratio between Luxembourg and Bulgaria is 9.0 to one in euro, against three and a half to one in purchasing power standards.
- Eleven Member States are above the EU average and sixteen below it, because the average is pulled up by the largest economies.
The same question in a different unit
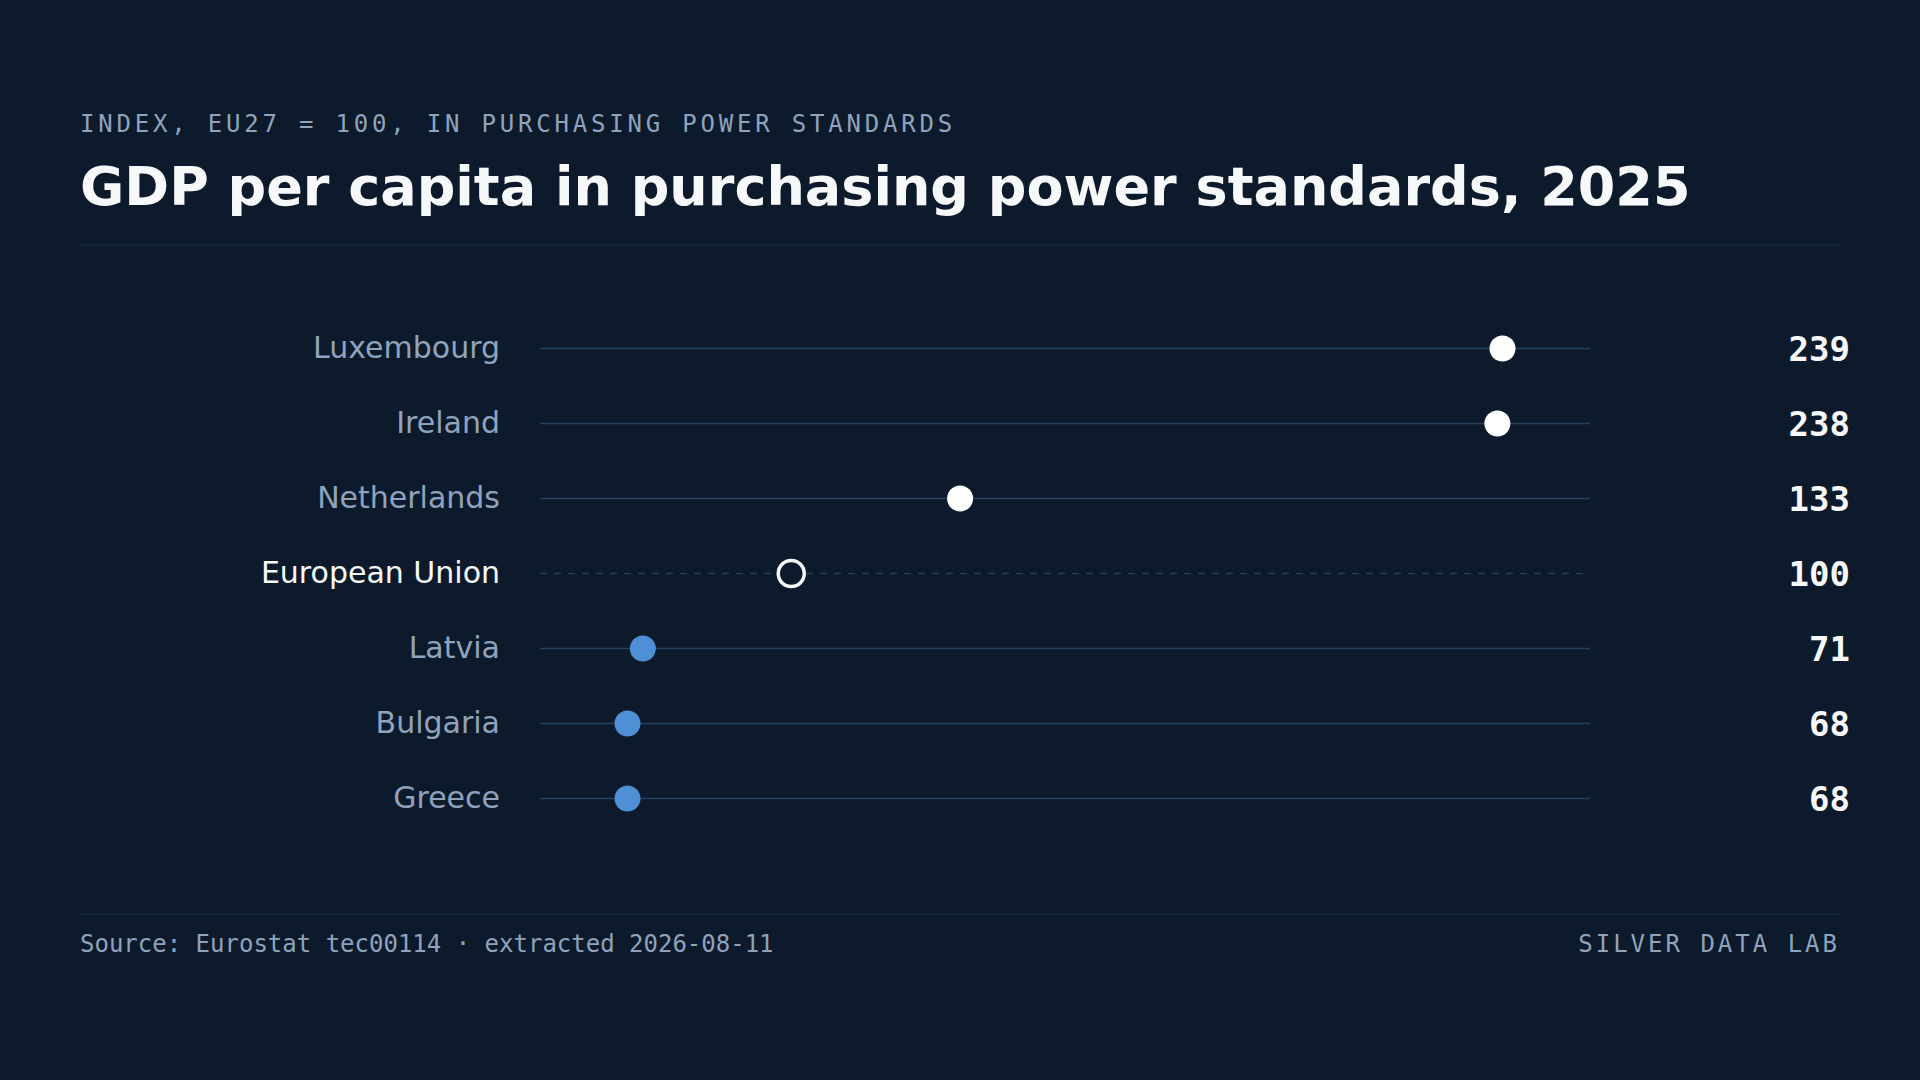
The economy and finance category on this site reports GDP per capita in purchasing power standards, which adjusts for the fact that a euro buys more in Sofia than in Copenhagen. This study reports the same underlying quantity in euro, without that adjustment.
The two produce very different pictures, and the difference is the point.
In euro at 2020 prices, EU GDP per capita in 2025 was 34,250. Luxembourg records 102,840 and Bulgaria 11,470: a ratio of 9.0 to one. Adjusted for purchasing power, the same comparison is three and a half to one, which is the figure the companion study reports.
Which measure to use
Neither is more correct. They answer different questions.
Purchasing power standards answer: how much can people actually buy? That is the right measure for comparing living standards, and it is why the economy study uses it.
Euro figures answer: how much output does this economy produce, valued at common prices? That is the right measure for questions about economic weight — contributions to the EU budget, the resources available for investment, the scale of a market.
Using the wrong one systematically overstates or understates convergence. Reported in purchasing power, EU cohesion looks substantially further advanced than it does in euro, and both statements are true of the same economies.
The top, and the familiar caution
Luxembourg at 102,840 and Ireland at 94,930 are both distorted, and this site has documented both.
Luxembourg's GDP includes output produced by a cross-border workforce that is not in its population denominator. Ireland's includes output booked by foreign-owned firms that has little to do with activity in Ireland.
Denmark at 60,390 is the highest figure in the Union that describes what it appears to describe.
The bottom
Bulgaria records 11,470 euro, Romania 13,300, Hungary 16,410 and Poland 17,210.
Poland at 17,210 is roughly half the EU average in euro and about four fifths of it in purchasing power. The gap between those two statements is the gap between how much Poland produces and how far Polish incomes stretch, and it is why the choice of unit is not a technicality.
An average above most Member States
Eleven of twenty-seven Member States are above the EU average of 34,250.
That is because the average is weighted by output: Germany, France, the Netherlands and the other large western economies dominate it. Sixteen Member States sit below a figure described as the European average — Italy among them, at 33,260 —, which makes it a poor description of a typical European country.
The same pattern appears in packaging waste and in several other indicators on this site, and the cause is always the same. A population-weighted or output-weighted European average describes the Union as an entity, not its members.
Real GDP per capita, 2025
| Country | euro per inhabitant, 2020 prices | Gap to EU averagederived |
|---|---|---|
| Luxembourg | 102,840p | +68,590.0 |
| Ireland | 94,930 | +60,680.0 |
| Denmark | 60,390 | +26,140.0 |
| European Unionaggregate | 34,250 | — |
| Hungary | 16,410p | −17,840.0 |
| Romania | 13,300p | −20,950.0 |
| Bulgaria | 11,470 | −22,780.0 |
Flags carried by the source on these values: p provisional
This table as data: CSV · JSON
Every Member State for this indicator+
Members see every Member State for this indicator here, not only the rows the ranking prints. Become a Member
Embed this chart
Paste this code into a page. The frame carries the source and the extraction date, and links back to the study.
What these figures cannot tell you
- Euro, not purchasing power
- This measure does not adjust for price level differences between Member States. It overstates real living standard gaps and is the wrong measure for comparing what people can buy; the purchasing power study on this site is the right one for that.
- Luxembourg and Ireland are distorted
- Luxembourg's output is produced partly by cross-border workers absent from its population; Ireland's includes output booked by foreign-owned firms. Neither figure describes local incomes.
- GDP is not income
- Output produced in a country can accrue to owners elsewhere. The primary income study in the economic globalisation category on this site shows how large that leakage is for Ireland and Luxembourg in particular.
- An output-weighted average
- The EU figure is weighted towards the largest economies, so sixteen of twenty-seven Member States fall below it. It describes the Union rather than a typical Member State.
Frequently asked questions
- What is GDP per capita in the EU?
- 34,250 euro per inhabitant in 2025, measured at constant 2020 prices. In purchasing power standards, which adjust for price differences between countries, the comparison between Member States is considerably narrower.
- Which EU country has the highest GDP per capita?
- Luxembourg at 102,840 euro and Ireland at 94,930, though both are distorted — Luxembourg by a cross-border workforce outside its population count, Ireland by output booked by foreign-owned firms. Denmark at 60,390 is the highest undistorted figure.
- Which EU country has the lowest?
- Bulgaria, at 11,470 euro in 2025, followed by Romania at 13,300 and Hungary at 16,410.
- Why does this differ from the purchasing power figures?
- Because a euro buys more in some Member States than others. In euro the gap between Luxembourg and Bulgaria is 9.0 to one; adjusted for purchasing power it is three and a half to one. Euro figures measure economic weight, purchasing power figures measure living standards.
Methodological note
Eurostat publishes real GDP per capita as chain linked volumes at 2020 prices in euro per inhabitant.
Values are for 2025 and cover all 27 Member States.
The ratio between the highest and lowest Member State and the count above the EU average are derived by Silver Data Lab. The comparison with purchasing power standards draws on the companion study in the economy and finance category, which uses a separate extraction.
Source data
The underlying series can be inspected and re-downloaded from the Eurostat data browser. The filters below are the ones applied.
Real GDP per capita
sdg_08_10
- Filters applied:
- freq=A · unit=CLV20_EUR_HAB · na_item=B1GQ · time=2025
- Extracted:
- 2026-10-23
- Source last updated:
- 2026-10-22
Download the data
The data the study you have just read is built on, exactly as it was downloaded and archived.
Yours as a Member.
Data downloadable by Members
How to cite
Record the vintage as well as the study: the figures on this page are the ones extracted on the dates below.
Silver Data Lab Research Desk (2026). Bulgaria's GDP per Person Is About a Third of the EU Average. Silver Data Lab, published 11 August 2026, last updated 21 October 2026. https://www.silverdatalab.com/studies/real-gdp-per-capita-in-the-eu
- Data: Eurostat, Real GDP per capita (sdg_08_10), filters freq=A, unit=CLV20_EUR_HAB, na_item=B1GQ, time=2025; extracted 2026-10-23; source last updated 2026-10-22. https://doi.org/10.2908/sdg_08_10
Silver Data Lab's analysis is licensed CC BY 4.0. The statistics remain their publisher's and keep its terms of reuse.
Ask the research desk
A question about this study — a definition, a filter, a break in the series, what the figures can and cannot support — answered by the desk that made the extraction.
Members can write to the research desk
Other studies on the same dataset
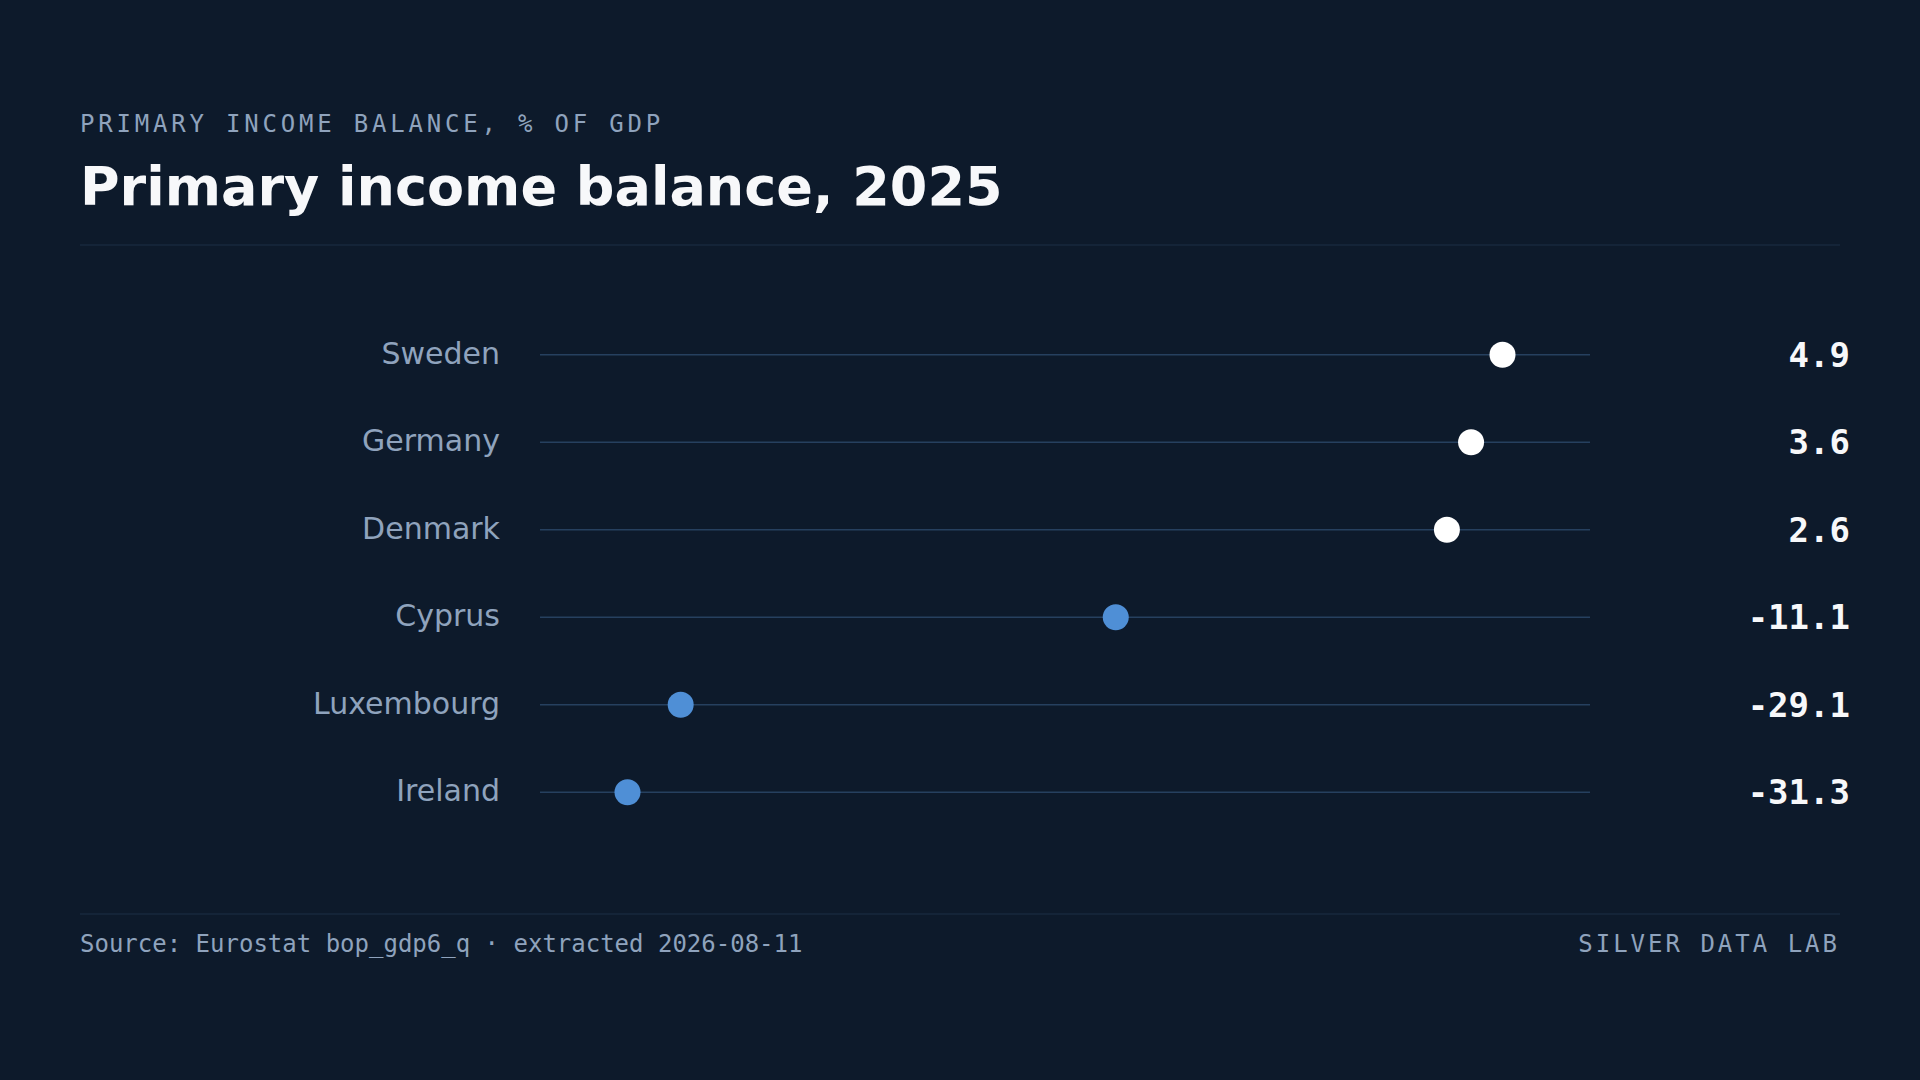
Ireland Pays Out More Income Abroad Than It Receives, a Net 28.6% of GDP
Ireland's net primary income outflow was 28.6% of GDP in 2025, second only to Luxembourg's 29.3%.
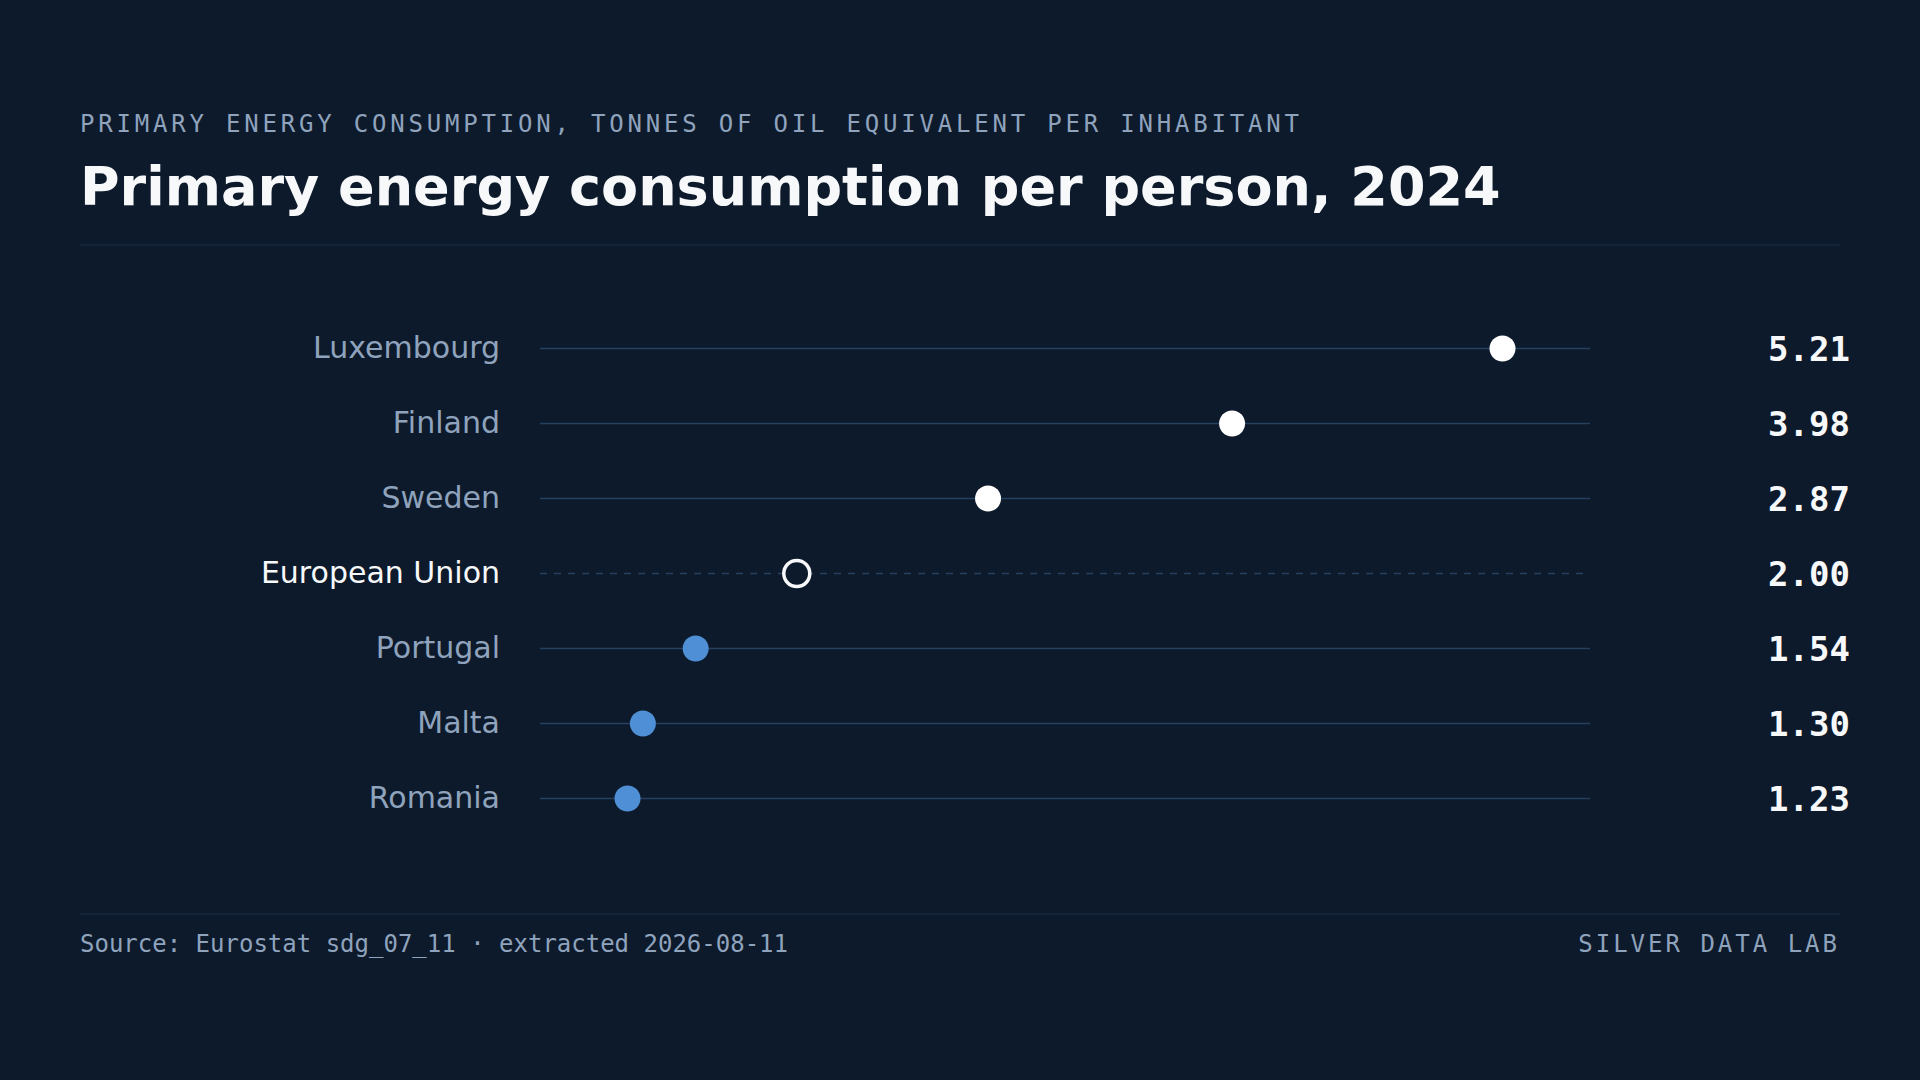
Romania Uses Less Energy per Person Than Any Other EU Country
The EU consumed 2.0 tonnes of oil equivalent per inhabitant in final energy in 2024.
Studies where the same country leads or trails
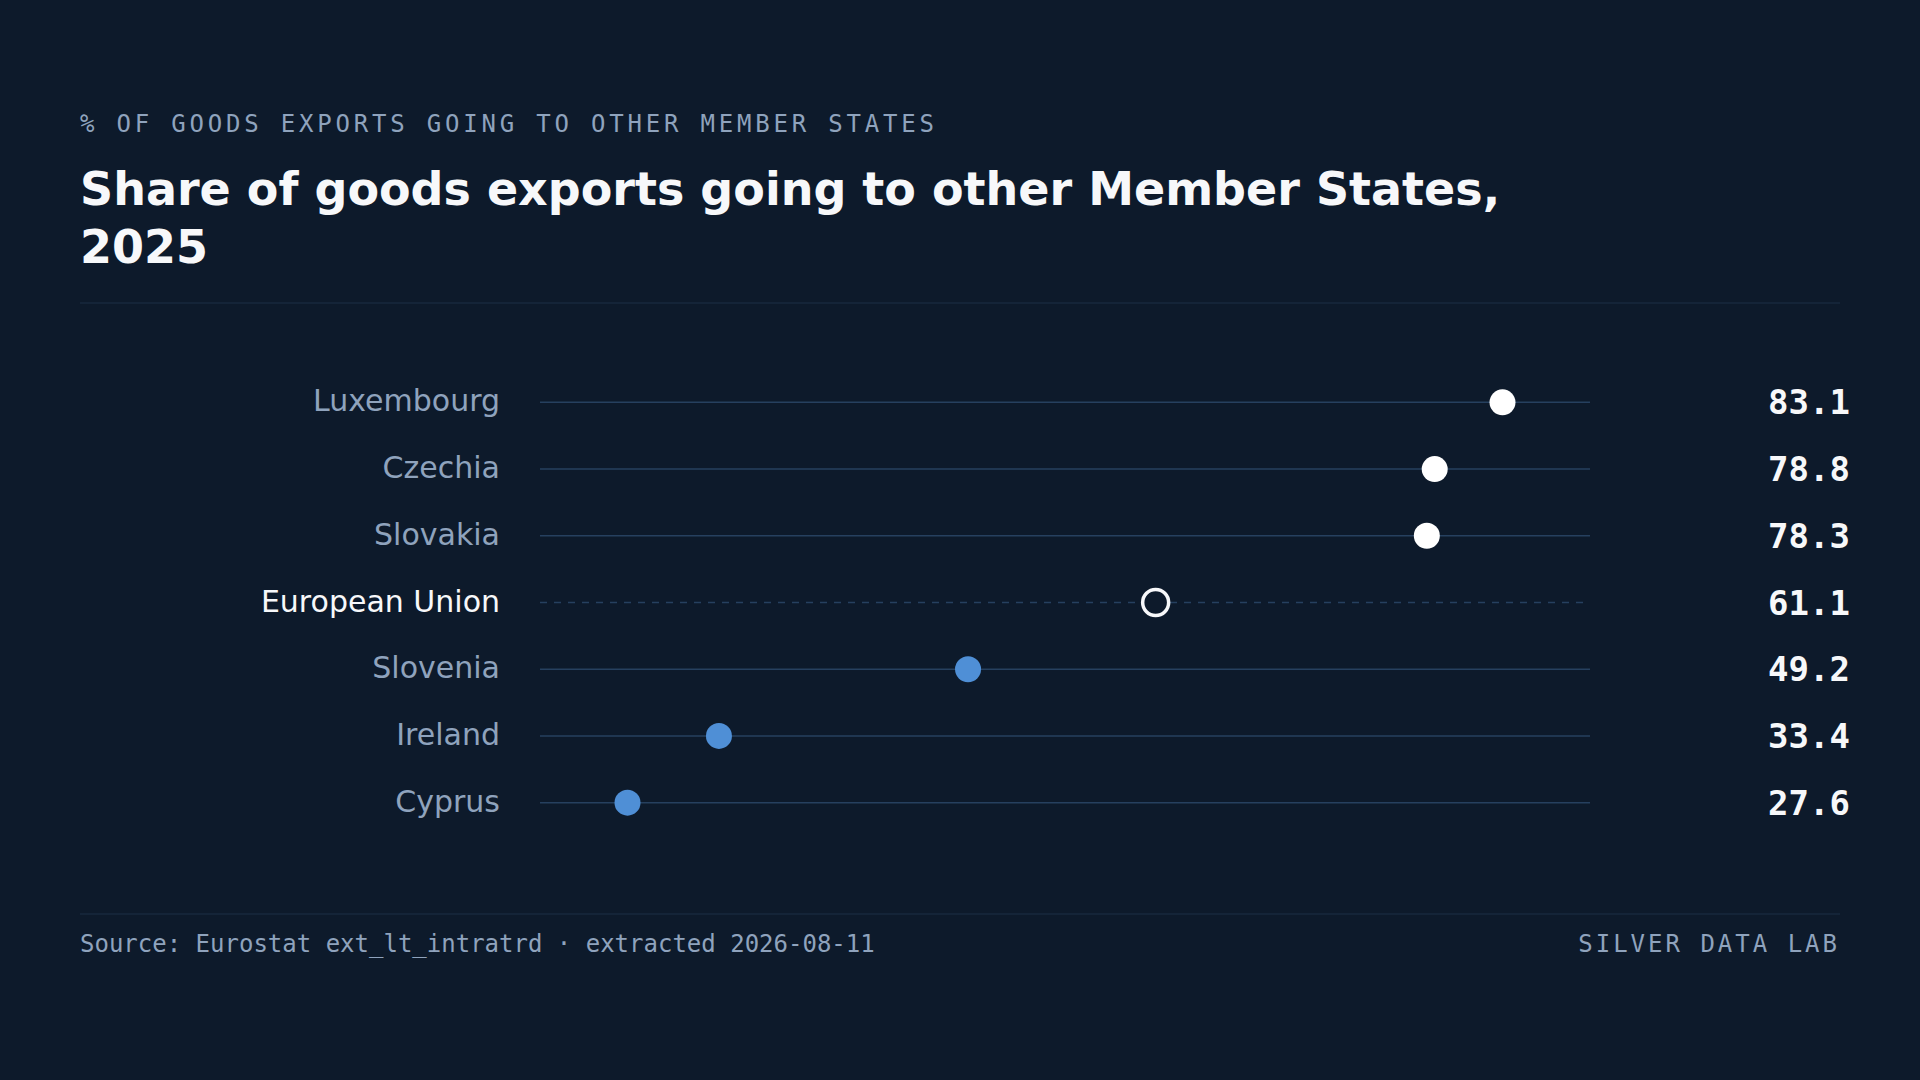
EU Countries Sell 61.1% of Their Goods Exports to Each Other
61.1% of the goods exported by EU Member States in 2025 went to other Member States.
GDP per Head Makes Luxembourg and Ireland Look Richer Than They Are
Luxembourg records 239 and Ireland 238 against an EU average of 100 — more than double the Union's output per head.
Germany's Legal Minimum Wage Buys More Than Any Other in the EU
22 of the 27 Member States set a statutory minimum wage. Austria, Denmark, Finland, Italy and Sweden do not, leaving pay floors to collective agreements.