Denmark Has the EU's Biggest Surplus With the World, at 12.3% of GDP
Silver Data Lab Research Desk · Statistical analysis · Published on 11 July 2026
- Data source
- Eurostat
- Reference period
- 2025
- Last updated
- 11 October 2026
Re-checked against the source on 03 October 2026. 29 values in its datasets moved between snapshots, 5 of them figures stated on this page. Every revision we have observed →
Key estimates
- Denmark ran a current account surplus worth 12.3% of GDP in 2025, the largest in the Union.
- Ireland records 8.0%, the Netherlands 7.6%, Malta 6.7% and Sweden 6.5%.
- Cyprus records a deficit of 8.8%, Romania 7.5%, Bulgaria 6.1% and Greece 5.6%.
- Eleven Member States ran deficits and sixteen ran surpluses.
- The Commission's thresholds are a surplus above 6% and a deficit below -4%; twelve Member States sit outside that band on the 2025 figures alone.
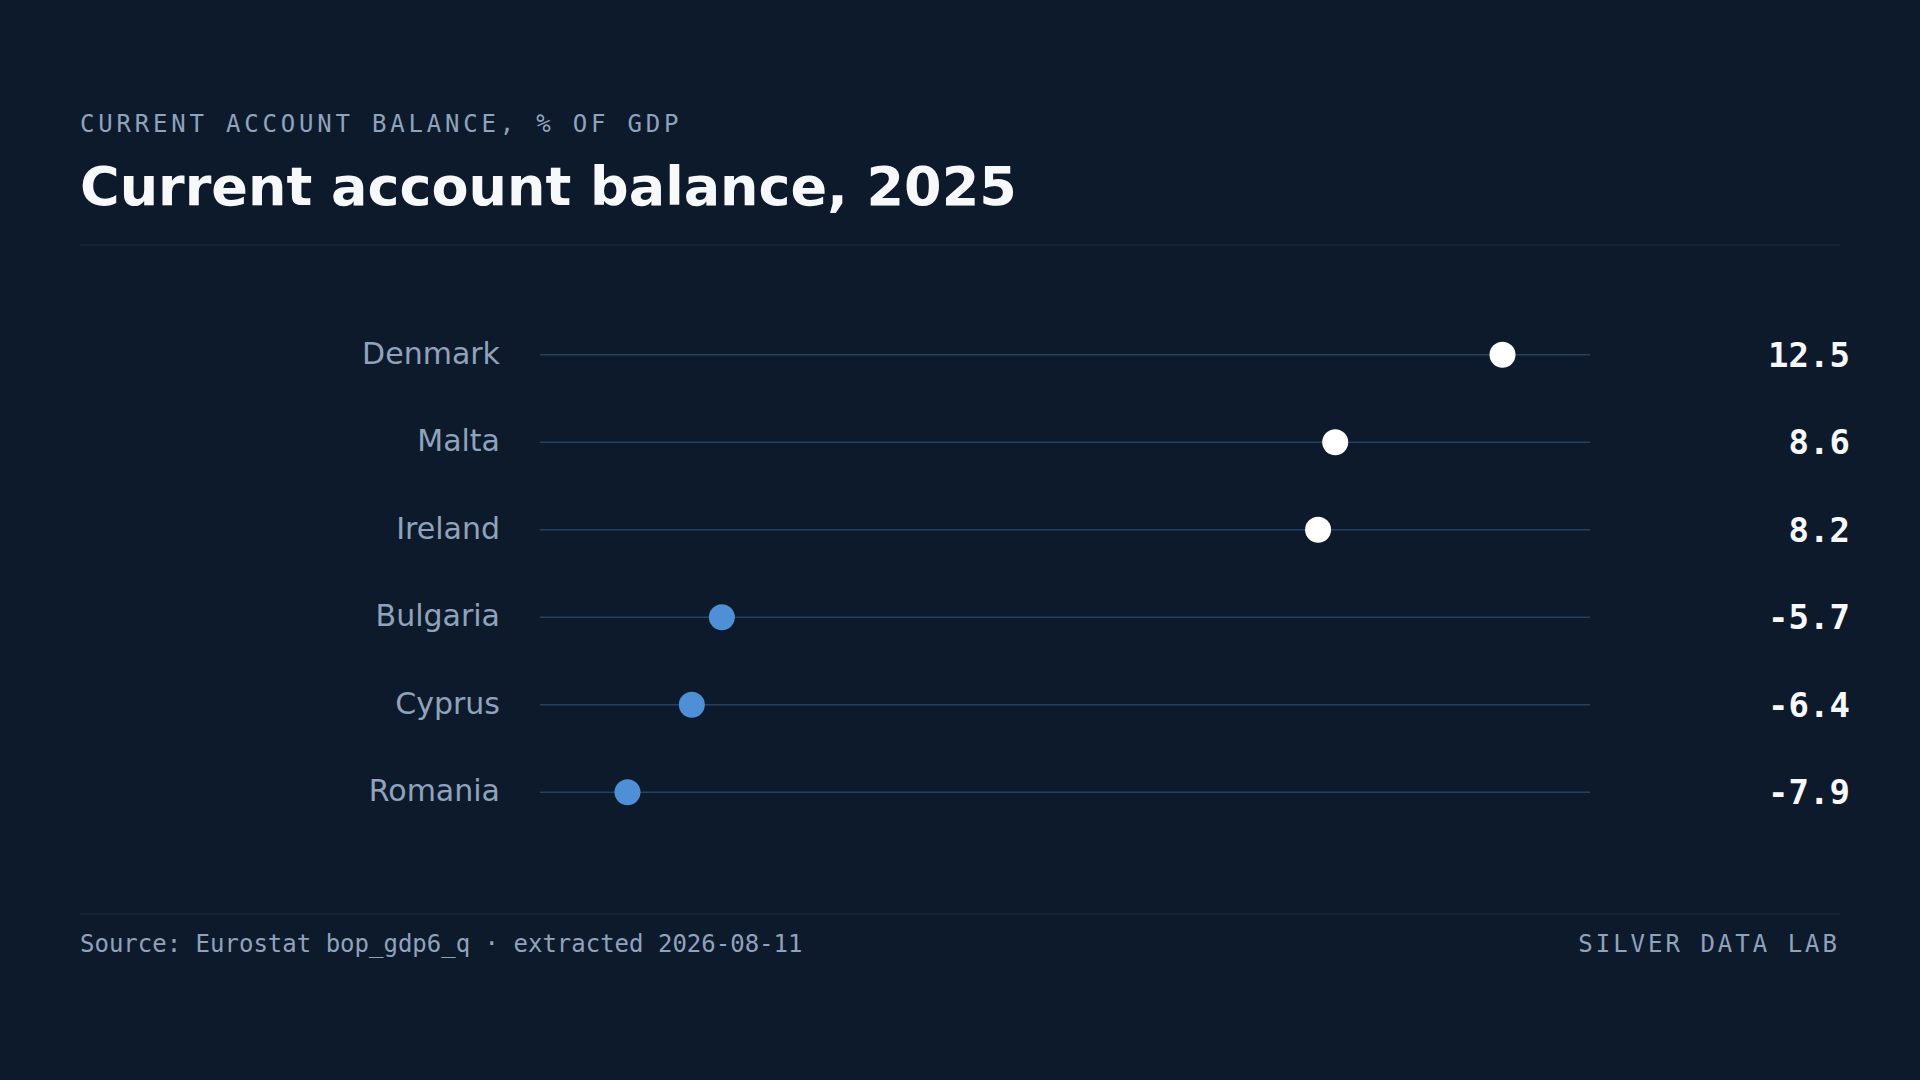
The annual flow behind the accumulated stock
The current account records what a country earns from the rest of the world against what it pays out: trade in goods and services, income on investments, and transfers. A surplus means money coming in on net; a deficit means the reverse.
Where the net international investment position is the accumulated stock, this is the annual flow that builds it. A country running persistent surpluses becomes a creditor; one running persistent deficits becomes a debtor.
In 2025, sixteen Member States ran surpluses and eleven ran deficits.
The surpluses
Denmark records 12.3% of GDP, the largest in the Union and double the Commission's 6% threshold.
Ireland follows at 8.0%, the Netherlands at 7.6%, Malta at 6.7% and Sweden at 6.5%. With Denmark those are the five Member States above the Commission's threshold; the next largest surpluses, Germany at 4.4% and Slovenia at 4.1%, sit inside the band. Denmark's surplus is consistent with its creditor position of 97.8% of GDP: the flow and the stock tell the same story about the same economy.
A large surplus is treated as an imbalance in the Commission's framework, which is counterintuitive if a surplus is read as success. The reasoning is that a country running a persistent large surplus is consuming and investing less than it produces, which suppresses demand for its trading partners and, within a currency union, cannot be corrected by an exchange rate movement.
The deficits
Cyprus records -8.8%, the largest deficit in the Union, followed by Romania at -7.5%, Bulgaria at -6.1% and Greece at -5.6%.
Romania's position is the one that has changed most over the years. It combines a persistent trade deficit with strong domestic demand, and the deficit has been financed rather than corrected. Its net investment position has deteriorated accordingly.
Greece's deficit sits on top of the Union's most negative investment position, which is the combination the imbalance procedure is designed to detect: a stock already deeply negative and a flow still adding to it.
What the framework is for
The macroeconomic imbalance procedure was created after the euro crisis, when it became clear that current account divergence inside a currency union had gone unmonitored while fiscal deficits were watched closely. Several countries that entered the crisis worst placed had complied with the fiscal rules and run current account deficits of 10% of GDP or more for years.
The asymmetric thresholds — surpluses tolerated to 6%, deficits only to -4% — reflect a judgement that deficits are the more immediate risk, since a deficit country depends on continued willingness to lend and a surplus country does not.
Whether that asymmetry is correct has been argued since it was set. The data here does not settle it, and this study does not attempt to.
Where the two ends meet
Neither end of this ranking is close to balance. Denmark at +12.3% and Cyprus at -8.8% are twenty-one points of GDP apart, inside a single market that in 2025 shared a single currency among twenty of its members — twenty-one from January 2026, when Bulgaria, which records one of the widest deficits here, adopted the euro.
Current account balance, 2025
| Country | % of GDP |
|---|---|
| Denmark | 12.3 |
| Ireland | 8.0 |
| Netherlands | 7.6 |
| Bulgaria | -6.1 |
| Romania | -7.5 |
| Cyprus | -8.8 |
This table as data: CSV · JSON
Every Member State for this indicator+
Members see every Member State for this indicator here, not only the rows the ranking prints. Become a Member
Embed this chart
Paste this code into a page. The frame carries the source and the extraction date, and links back to the study.
What these figures cannot tell you
- A single year
- Current accounts move with commodity prices, one-off transactions and the timing of large investments. What matters for imbalance is persistence, and a single year's reading cannot show it. The investment position study on this site reports the accumulated stock.
- No EU aggregate is published
- Eurostat publishes no EU value for this series. Summing the Member States would count intra-EU flows on both sides, so no reference row is shown.
- Ireland and the small financial centres
- Irish, Maltese and Luxembourg balances are affected by the operations of multinational and financial entities whose flows are large relative to the domestic economy. Their figures are correct and do not describe domestic saving behaviour.
- The thresholds are policy, not statistics
- The +6% and -4% bounds come from the Commission's imbalance procedure scoreboard, not from Eurostat. They are judgements about risk, and the asymmetry between them has been contested since it was adopted. The scoreboard also reads them against a three-year average rather than a single year, so the counts here say who stood outside the band in 2025, not who the procedure would flag.
Frequently asked questions
- Which EU country has the largest current account surplus?
- Denmark, at 12.3% of GDP in 2025 — double the Commission's 6% threshold. Ireland at 8.0%, the Netherlands at 7.6%, Malta at 6.7% and Sweden at 6.5% follow.
- Which EU country has the largest deficit?
- Cyprus, at -8.8% of GDP in 2025, followed by Romania at -7.5%, Bulgaria at -6.1% and Greece at -5.6%.
- Why is a large surplus treated as an imbalance?
- Because a country running a persistent large surplus is consuming and investing less than it produces, which reduces demand for its trading partners. Inside a currency union that cannot be corrected by an exchange rate movement, which is why the Commission monitors surpluses above 6% of GDP as well as deficits.
- How many EU countries run current account deficits?
- Eleven in 2025, against sixteen in surplus. Twelve Member States sit outside the Commission's threshold band of +6% to -4% on that year's figures; the scoreboard itself reads the band against a three-year average.
Methodological note
The current account balance is taken from Eurostat's balance of payments statistics under BPM6, expressed as a share of GDP, unadjusted, against the rest of the world.
Values are for 2025 and cover all 27 Member States. Eurostat publishes no EU aggregate for this series, so no reference row is shown and no EU figure is quoted.
The counts of Member States in surplus and deficit, and of those outside the Commission's threshold band, are derived by Silver Data Lab. The +6% and -4% thresholds are from the macroeconomic imbalance procedure scoreboard and are not Eurostat statistics; the scoreboard reads them against a three-year backward moving average, while the counts in this study compare the 2025 value alone. The comparison with net investment positions draws on the companion study in this category.
Source data
The underlying series can be inspected and re-downloaded from the Eurostat data browser. The filters below are the ones applied.
Main Balance of Payments items as share of GDP (BPM6)
bop_gdp6_q
- Filters applied:
- freq=A · unit=PC_GDP · s_adj=NSA · bop_item=CA · stk_flow=BAL · partner=WRL_REST · time=2025
- Extracted:
- 2026-10-03
- Source last updated:
- 2026-10-02
Download the data
The data the study you have just read is built on, exactly as it was downloaded and archived.
Yours as a Member.
Data downloadable by Members
How to cite
Record the vintage as well as the study: the figures on this page are the ones extracted on the dates below.
Silver Data Lab Research Desk (2026). Denmark Has the EU's Biggest Surplus With the World, at 12.3% of GDP. Silver Data Lab, published 11 July 2026, last updated 11 October 2026. https://www.silverdatalab.com/studies/current-account-balances-in-the-eu
- Data: Eurostat, Main Balance of Payments items as share of GDP (BPM6) (bop_gdp6_q), filters freq=A, unit=PC_GDP, s_adj=NSA, bop_item=CA, stk_flow=BAL, partner=WRL_REST, time=2025; extracted 2026-10-03; source last updated 2026-10-02. https://doi.org/10.2908/bop_gdp6_q
Silver Data Lab's analysis is licensed CC BY 4.0. The statistics remain their publisher's and keep its terms of reuse.
Ask the research desk
A question about this study — a definition, a filter, a break in the series, what the figures can and cannot support — answered by the desk that made the extraction.
Members can write to the research desk
Other studies on the same dataset
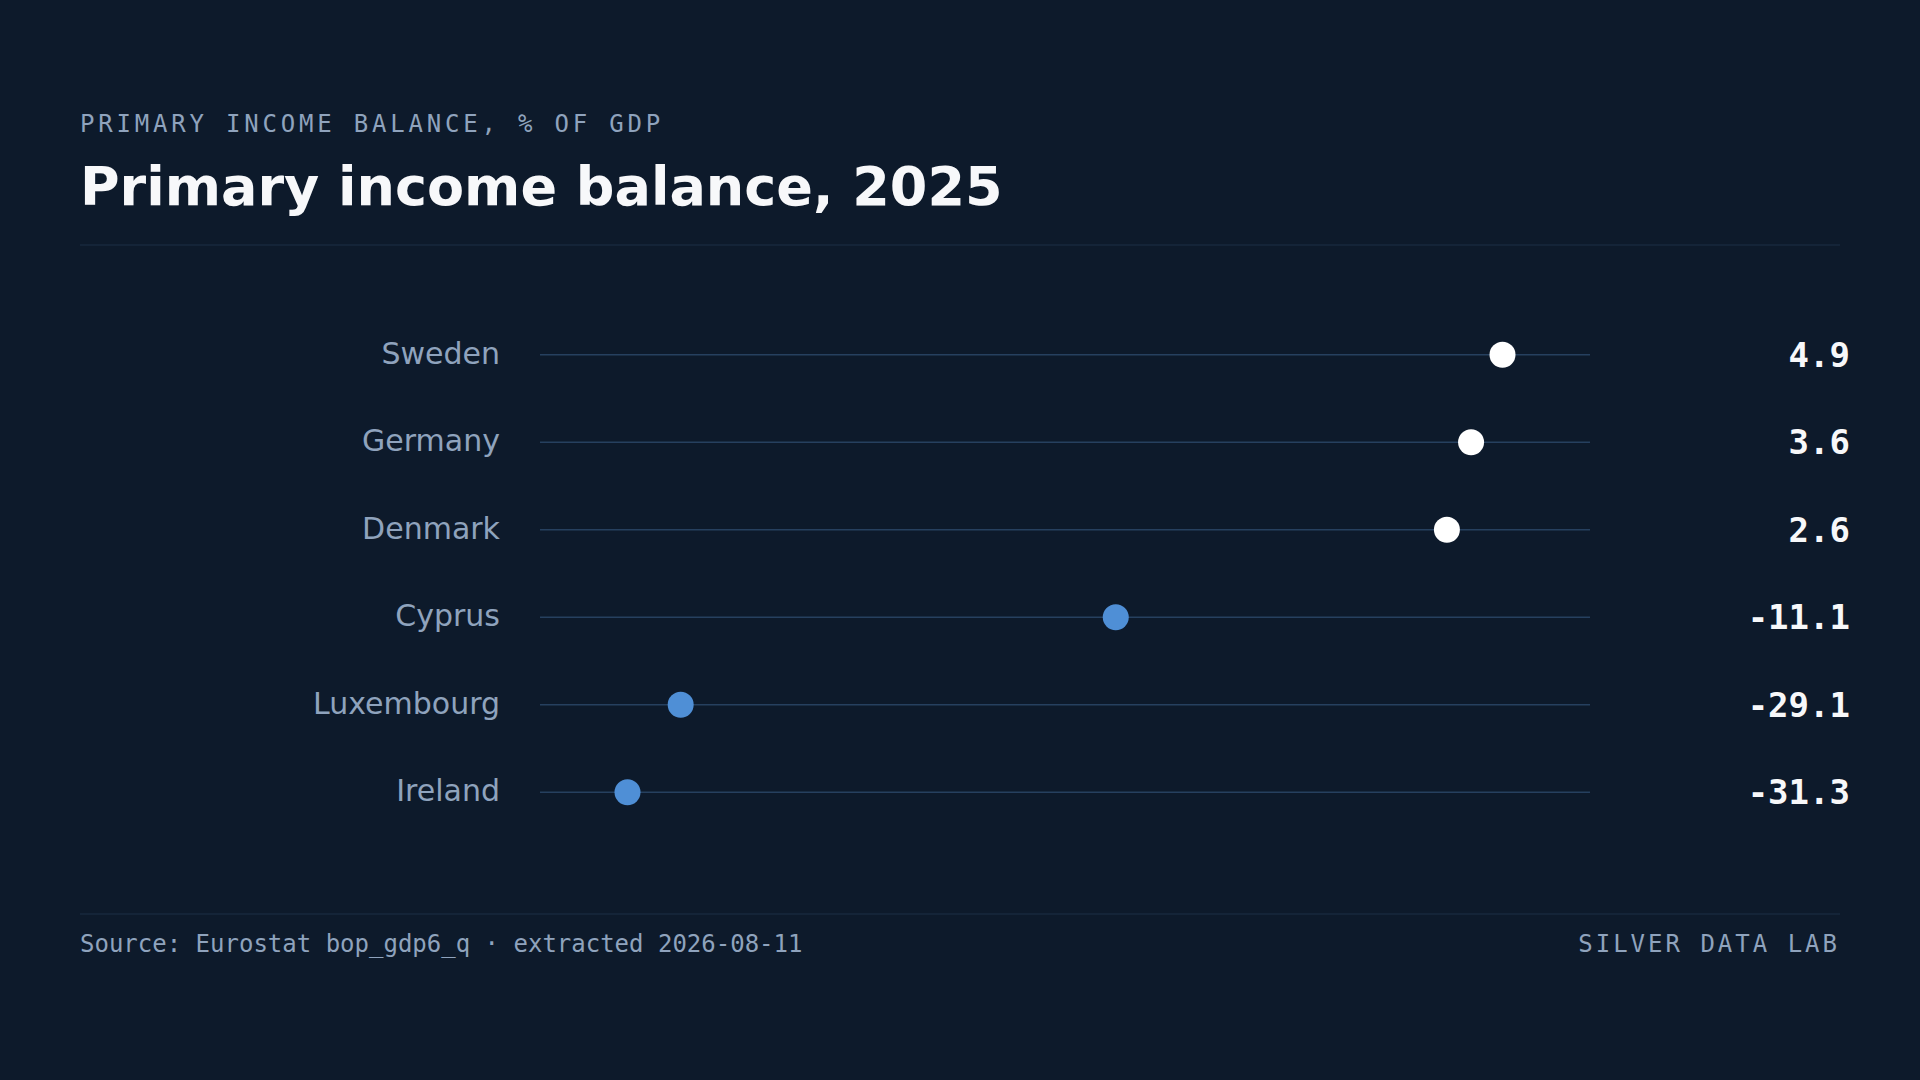
Ireland Pays Out More Income Abroad Than It Receives, a Net 28.6% of GDP
Ireland's net primary income outflow was 28.6% of GDP in 2025, second only to Luxembourg's 29.3%.
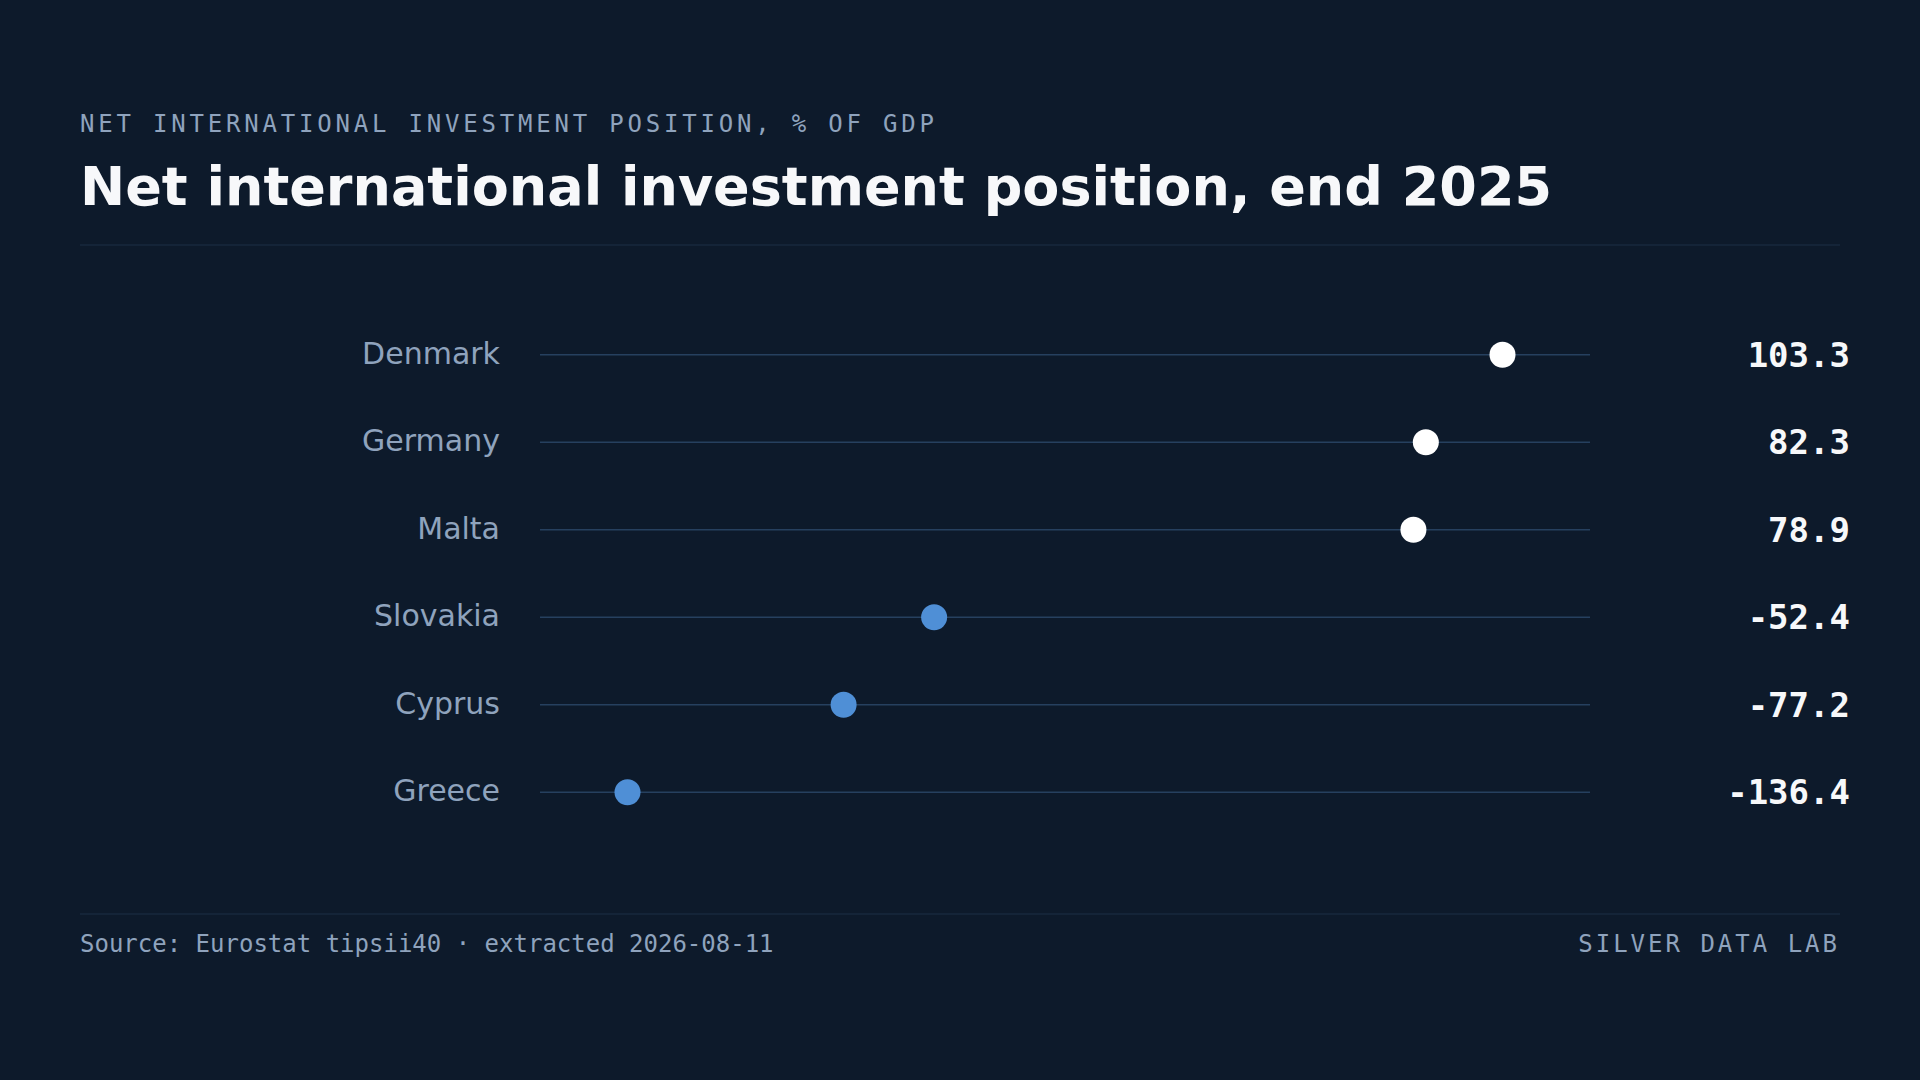
Denmark's Net Wealth Abroad Is Worth 97.8% of Its GDP
Denmark's net international investment position stood at 97.8% of GDP at the end of 2025 — close to a full year of its economic output.
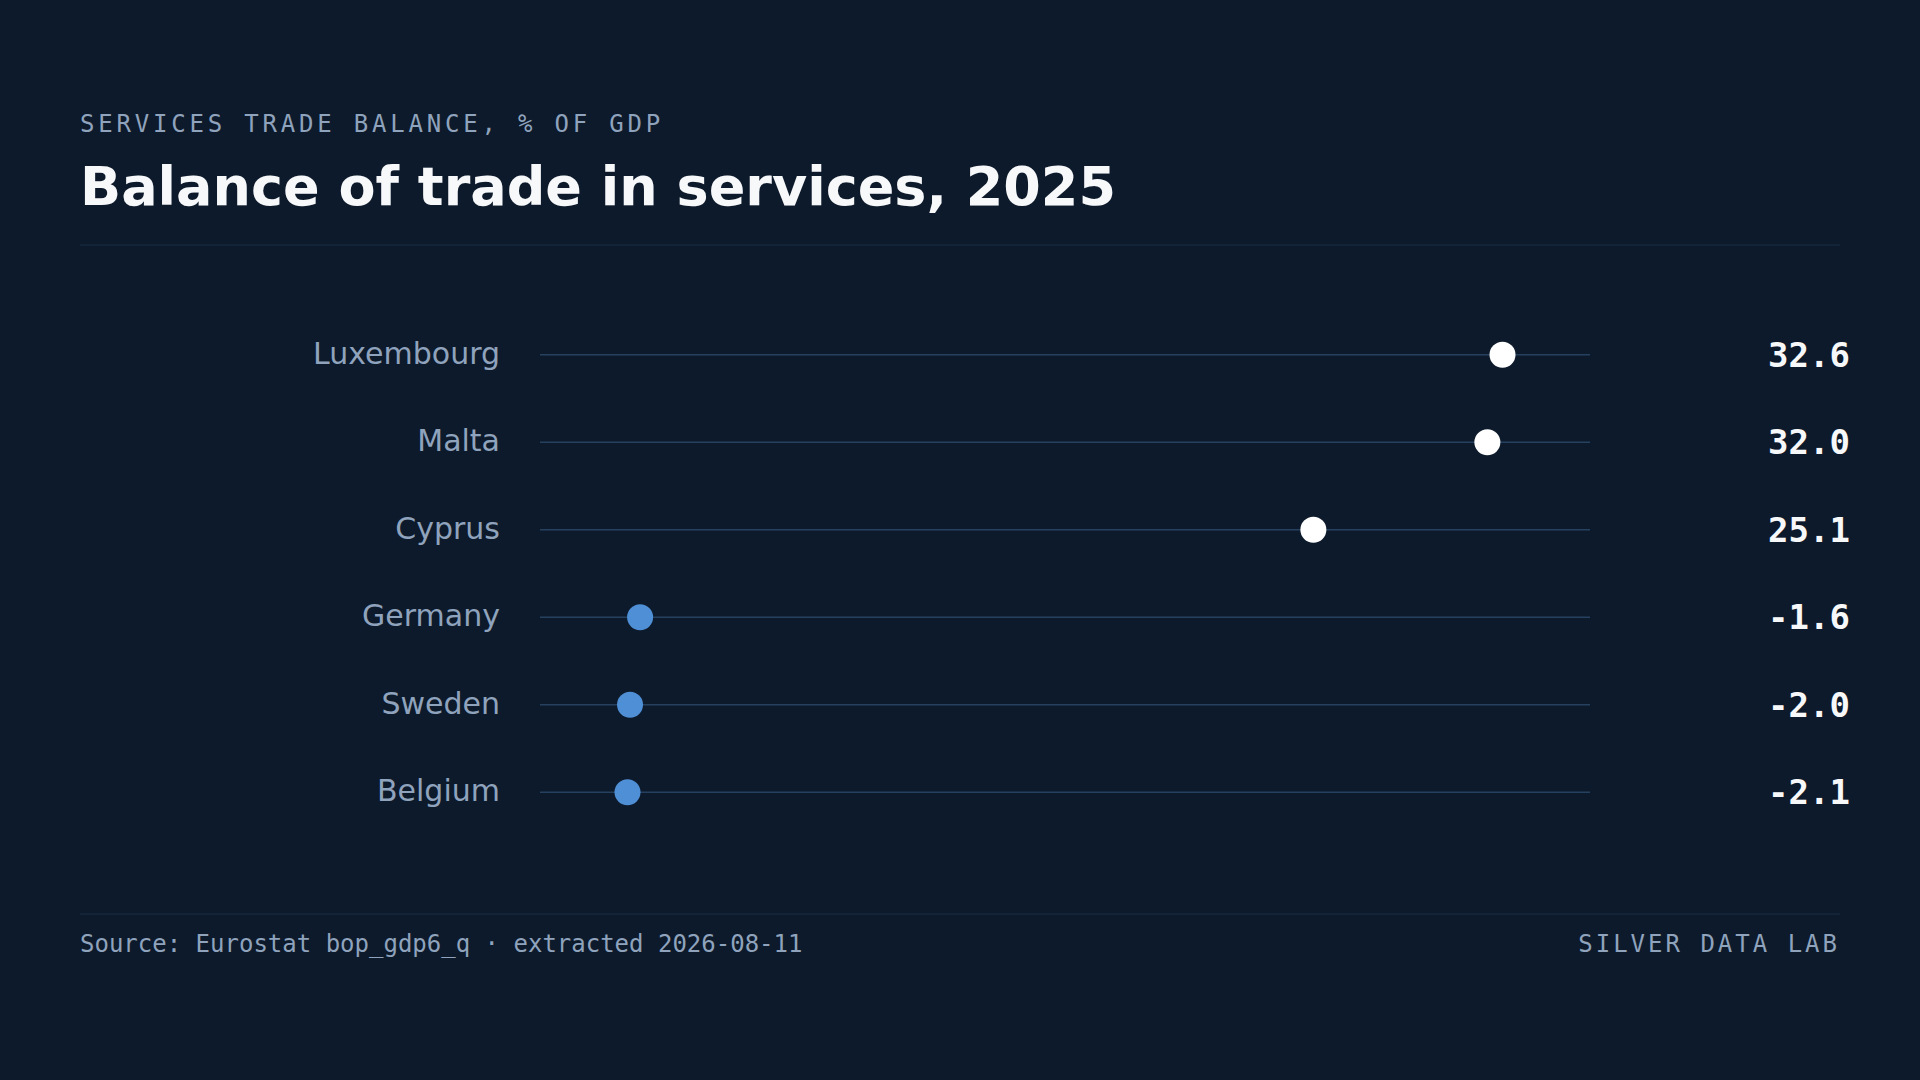
Germany Buys More Services From Abroad Than It Sells
Malta records a services trade surplus worth 33.2% of GDP, Luxembourg 30.3% and Cyprus 27.4%.
Studies where the same country leads or trails
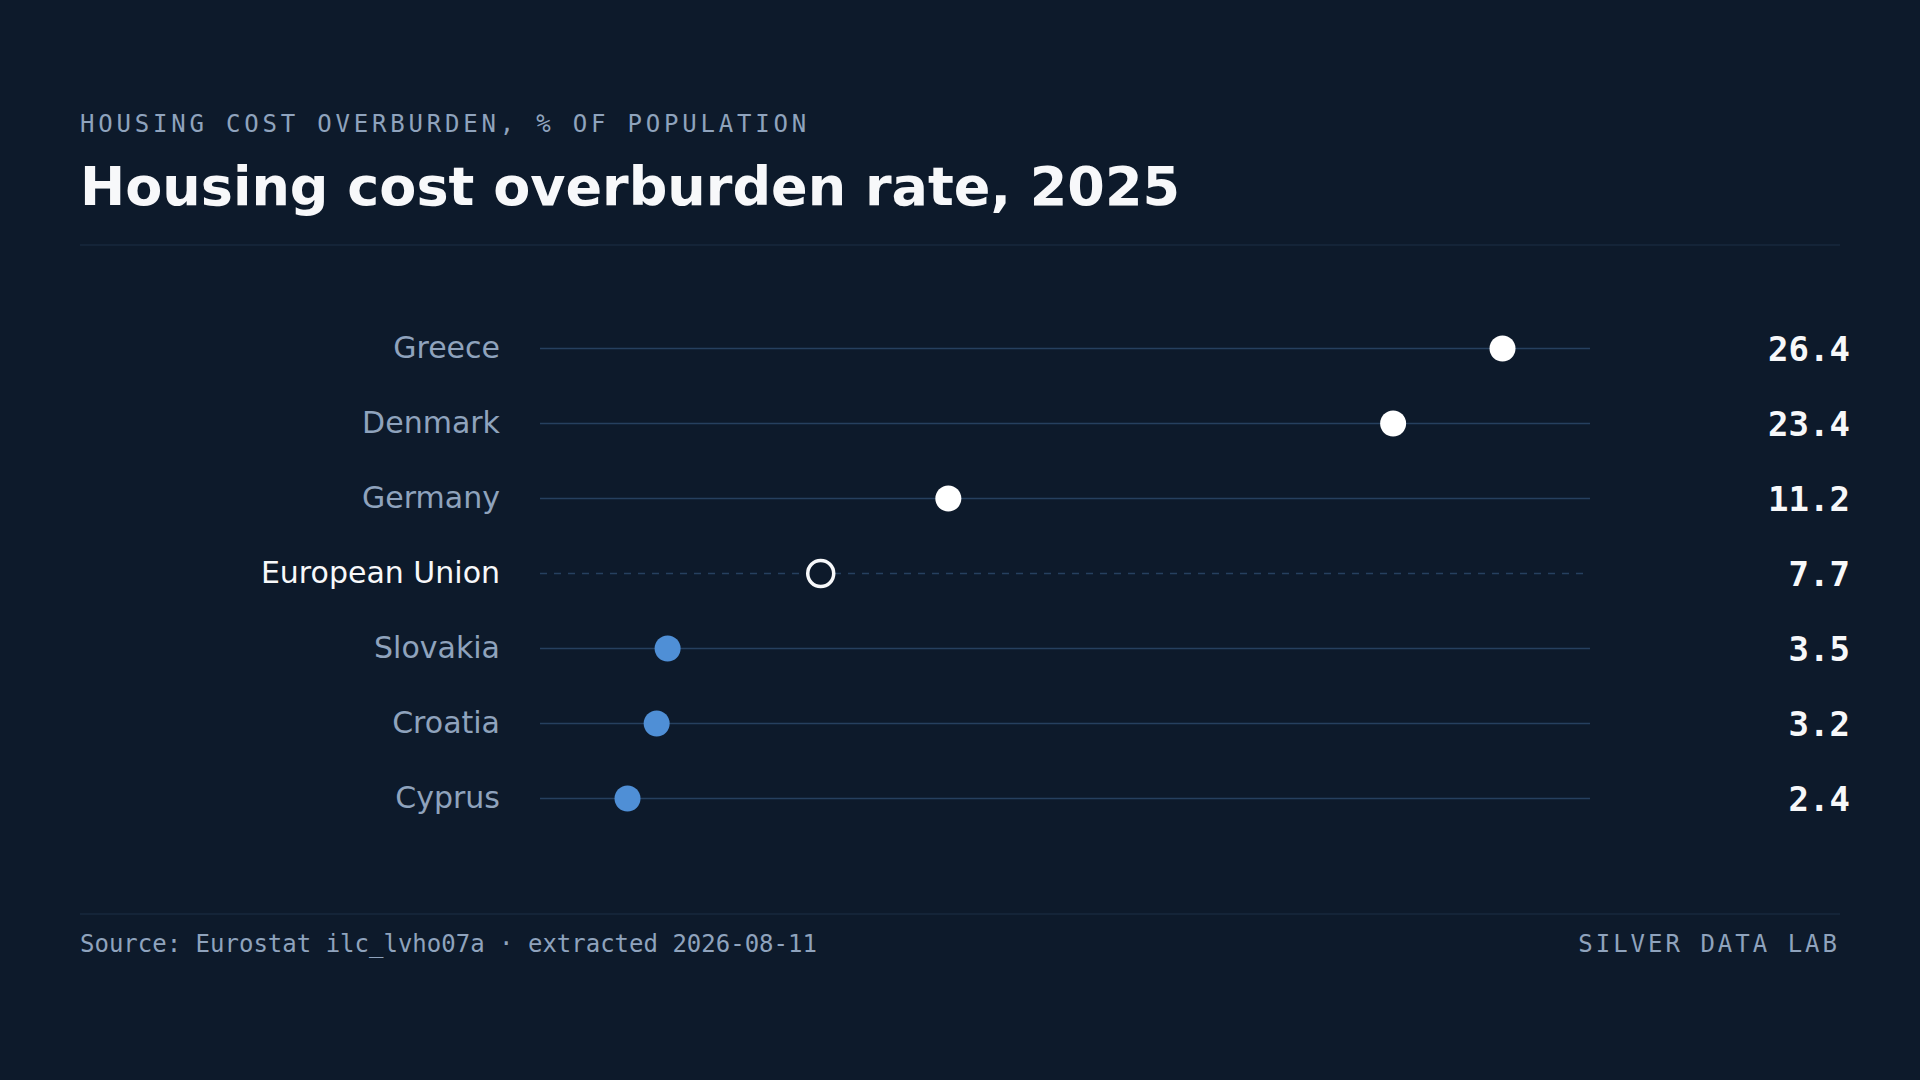
A Quarter of Greeks Spend More Than 40% of Income on Housing
7.7% of the EU population spent more than 40% of disposable income on housing in 2025.
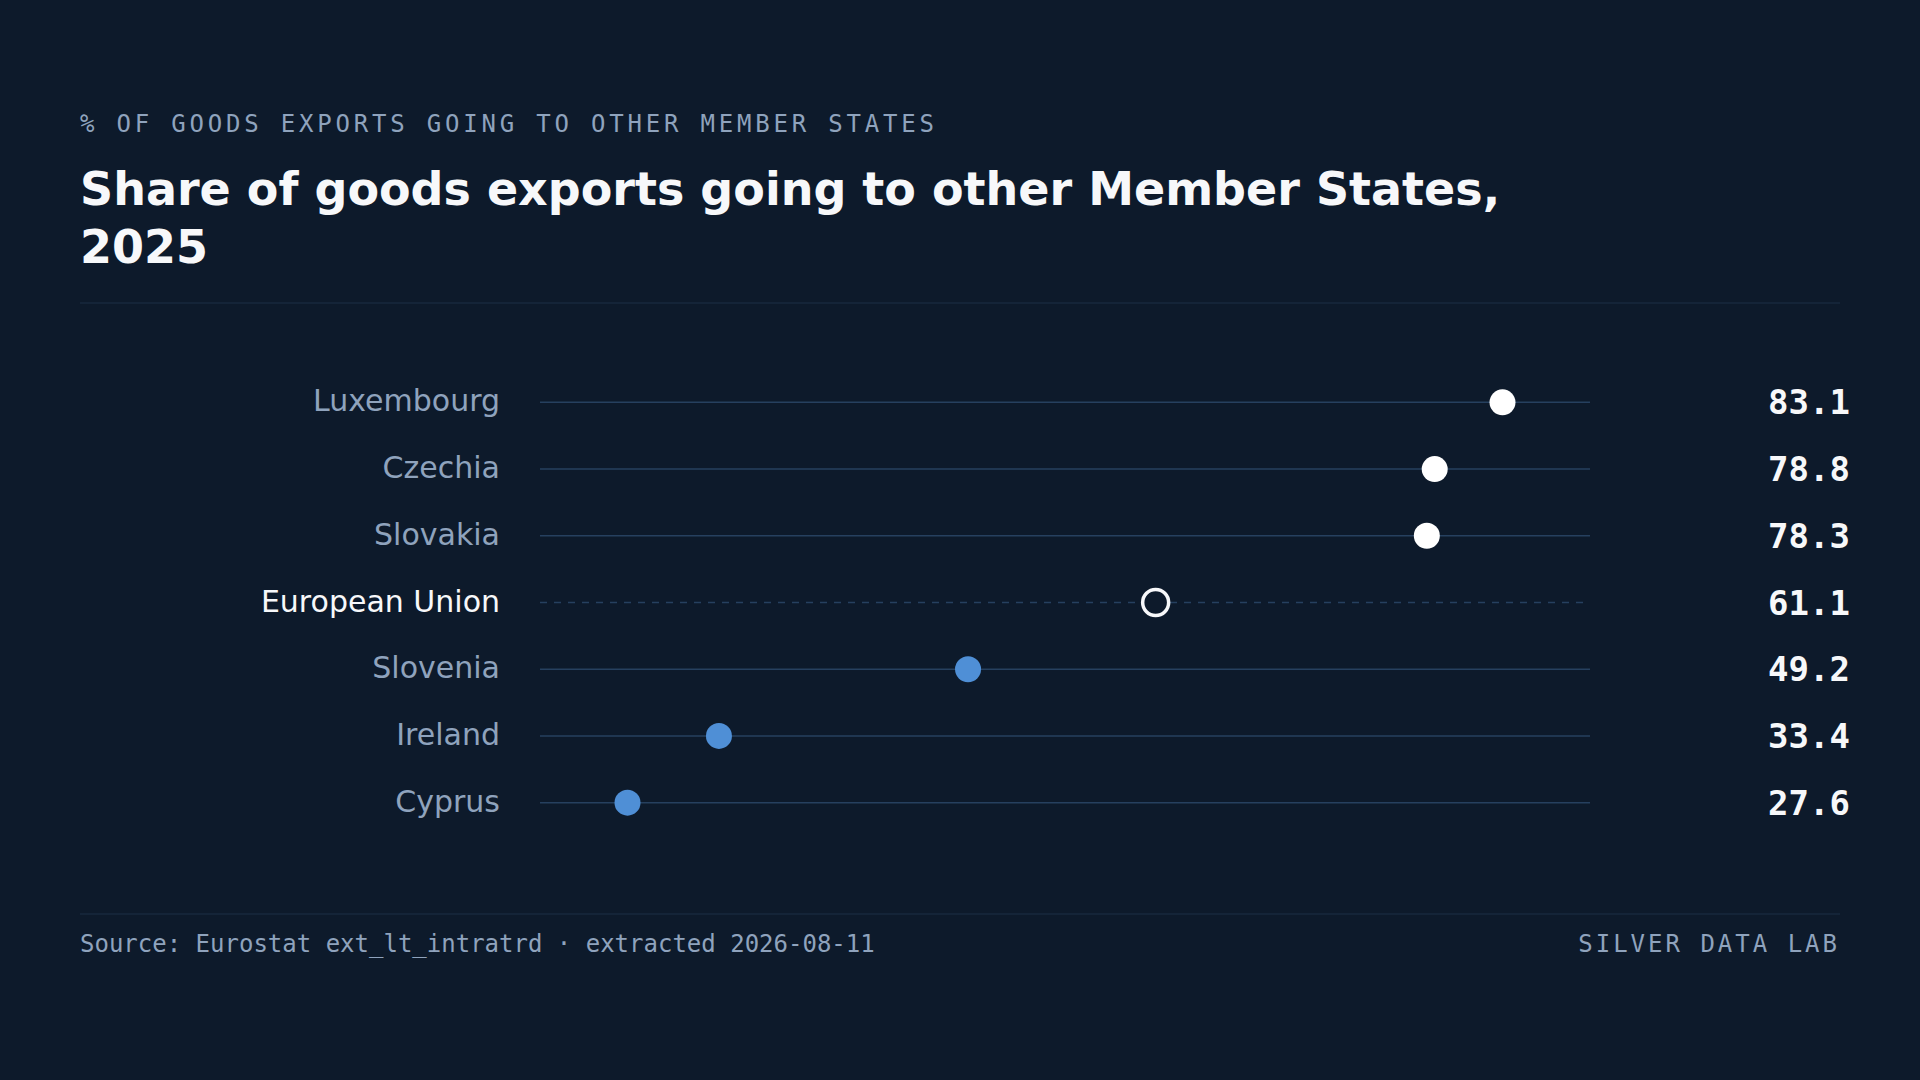
EU Countries Sell 61.1% of Their Goods Exports to Each Other
61.1% of the goods exported by EU Member States in 2025 went to other Member States.
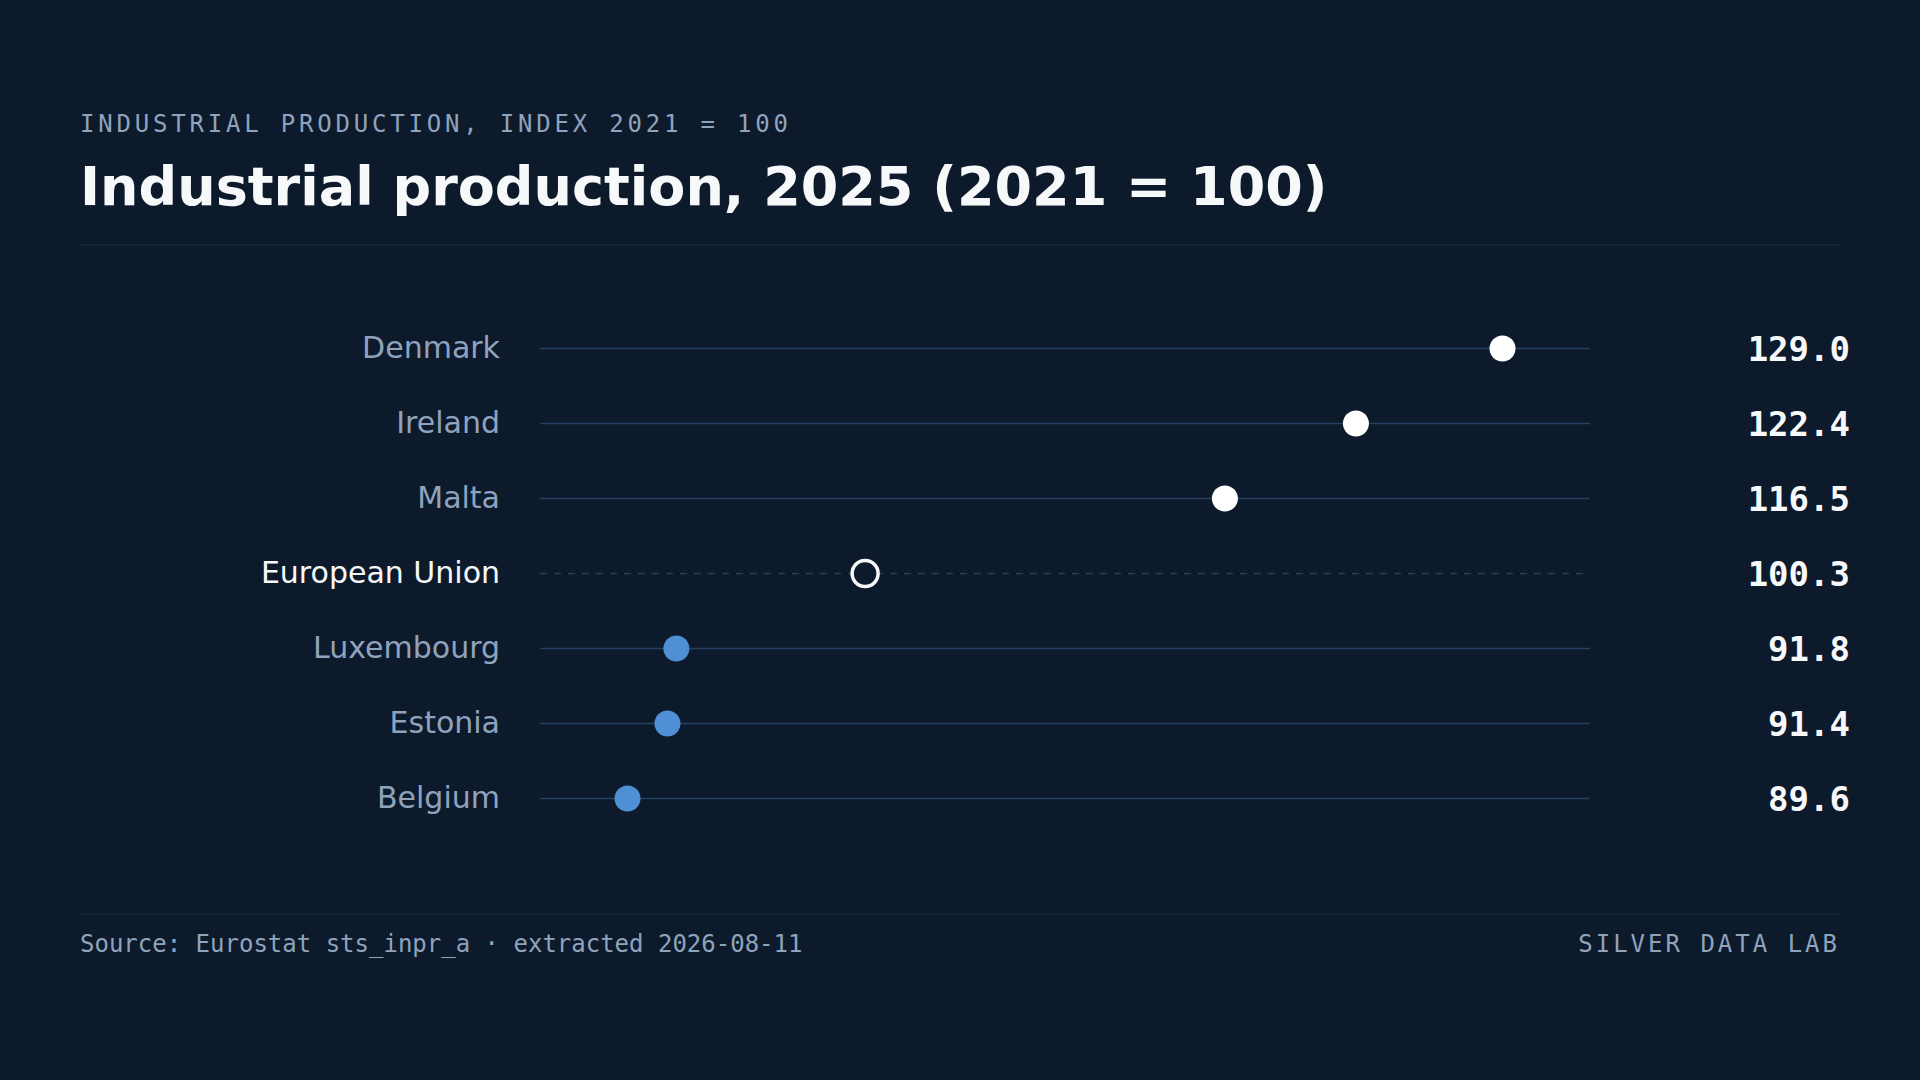
EU Industrial Output Is Where It Was Four Years Ago
EU industrial production in 2025 stood at 100.4 against a 2021 base of 100 — output is essentially unchanged after four years.