45.9% Fewer Children Sought Asylum Alone in the EU Than a Year Earlier
Silver Data Lab Research Desk · Statistical analysis · Published on 22 October 2026
- Data source
- Eurostat
- Reference period
- 2025
- Last updated
- 22 October 2026
Re-checked against the source on 22 October 2026. No value in its datasets has moved between the snapshots we hold. Every revision we have observed →
Key estimates
- In 2025, 17,930 children applied for asylum in the EU without a parent or another adult responsible for them, against 33,160 in 2024: a derived fall of 45.9%, to the lowest figure since 2020.
- Germany's count went from 13,345 to 4,925, and that drop of 8,420 makes up 55.3% of the EU's fall, by derivation; together with Bulgaria's and Greece's, it accounts for 80.2%.
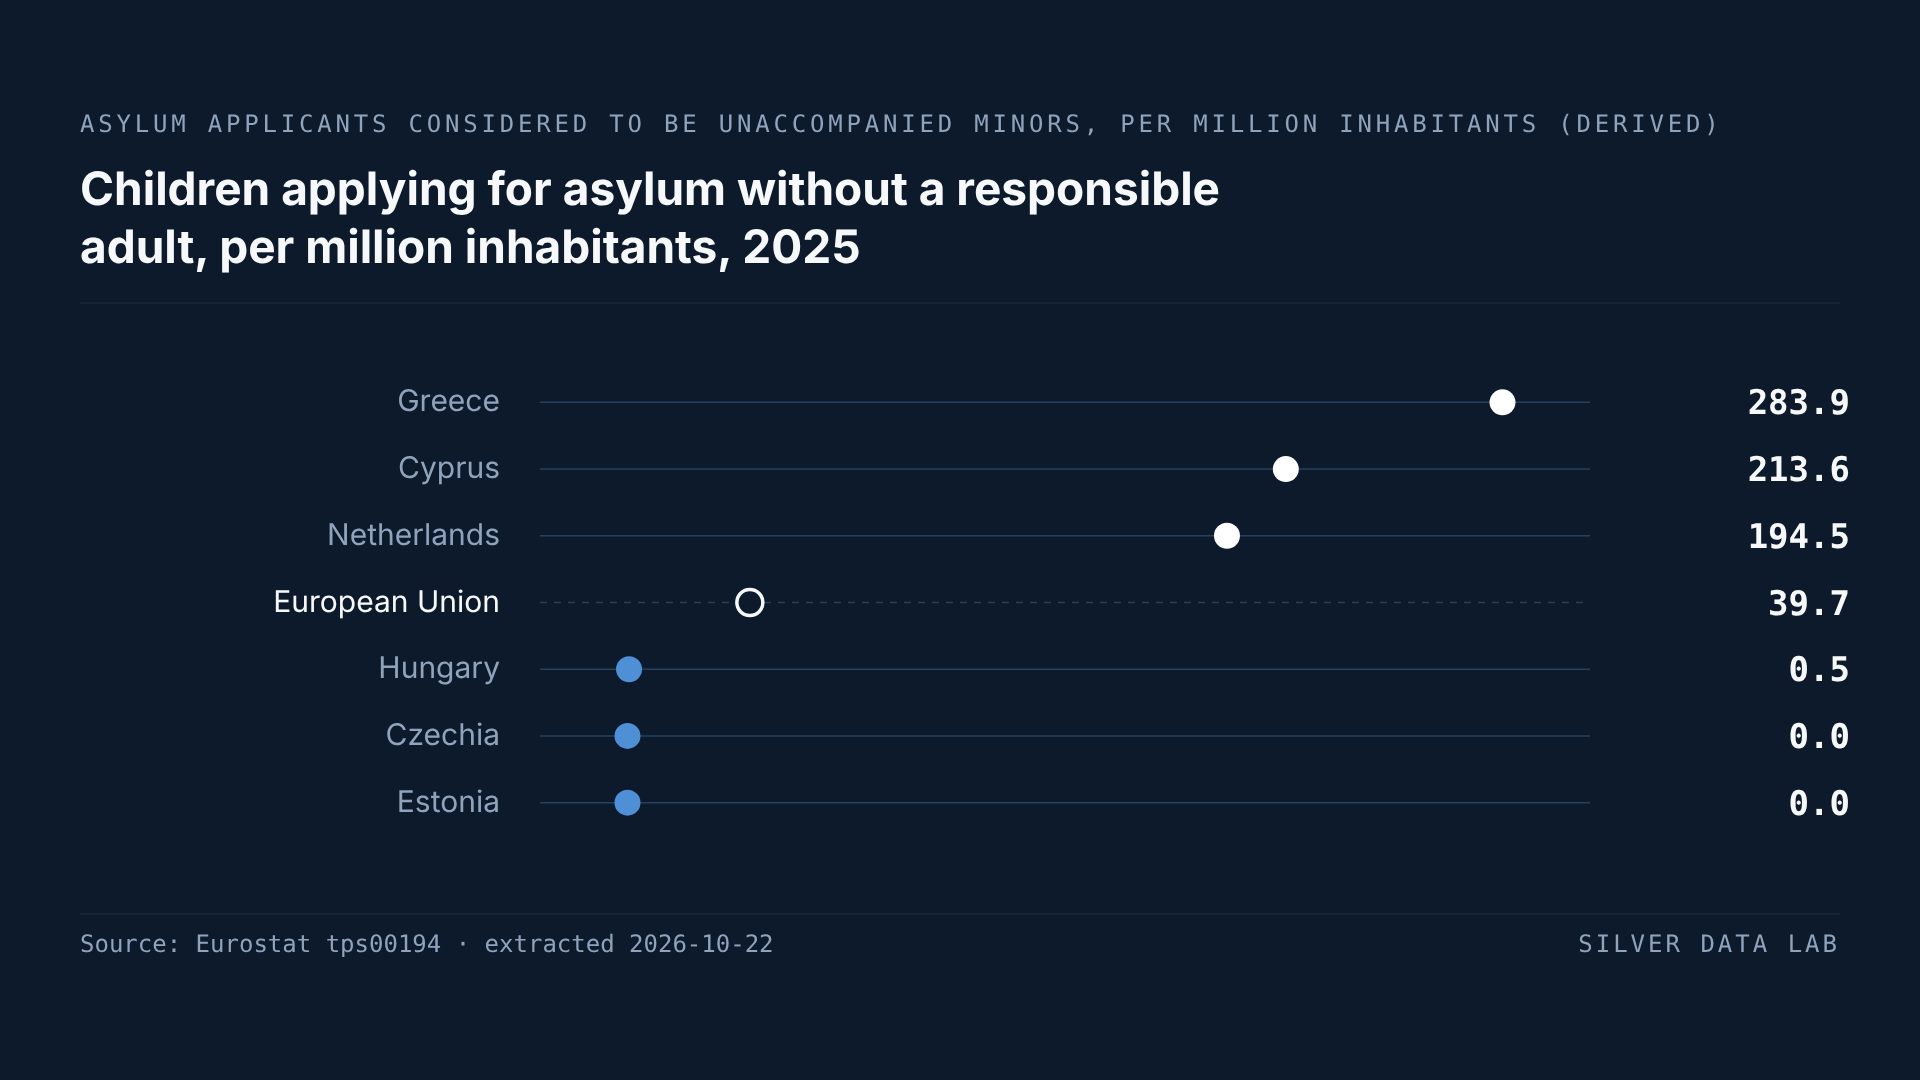
- Measured against population, Greece records the most, 283.9 applicants per million inhabitants, about seven times the EU figure of 39.7; Cyprus follows at 213.6 and the Netherlands at 194.5, all of them derived rates.
- The Dutch count fell by only 10.7%, to 3,510, so the Netherlands' share of the EU total rose from 11.9% to 19.6%; Germany, the Netherlands and Greece together hold 63.5% of the 2025 total, every share derived.
- The 2025 total is 20.4% of the 88,080 recorded in 2015, the peak of a series that starts in 2014, and it is below the 20,245 of 2014 itself.
Fewer than in any year since 2020
In 2025, 17,930 children applied for asylum in the European Union without a parent or another adult responsible for them. In 2024 Eurostat counted 33,160. The gap between the two totals, 15,230 children, is a fall of 45.9%, and it takes the figure to its lowest since 2020, when it stood at 13,590. Both the difference and the percentage are derived here from Eurostat's published totals, as is every share, rate and ratio on this page.
Seen against the whole series, 2025 sits near the bottom. Eurostat's table starts in 2014, when it recorded 20,245, and peaks in 2015 at 88,080. The 2025 total is 20.4% of that peak, about one fifth, and lower than the first year of the table.
Who is in the count
Eurostat calls these children unaccompanied minors. They are people under 18 who reach a Member State with no adult responsible for them, or who are left without one after they arrive. The table records those among them who applied for international protection during the year, the legal name in the EU for asylum. It covers refugee status and subsidiary protection, a second status for people at risk of serious harm if sent home who do not meet the refugee definition. Only citizens of countries outside the EU and stateless people, who hold no country's citizenship, can be counted.
Three features of the table shape every figure below. It counts applications, not arrivals: a child who comes alone and never applies is not in it. Whether an applicant is under 18 is the national authority's decision, sometimes taken after an assessment of the person's age. And Eurostat rounds every value to the nearest five, so the counts of the smallest countries are approximate by construction.
Two peaks in twelve years
From 88,080 in 2015 the EU count fell in every year to 13,590 in 2020. It then rose in each of the next three years, to 40,405 in 2023, its highest since 2016, and has fallen in both years since.
The countries receiving these applications have changed along the way. In 2015 Sweden alone recorded 30,420, which is 34.5% of the EU total for that year; in 2025 it recorded 180. Germany's count of 35,935 in 2016, 59.9% of that year's total, is the largest national figure in the table. Germany has recorded the largest count in five of the twelve years, including each of the last three, and in 2025 its 4,925 applicants were 27.5% of the EU total, against 40.2% in 2024.
Where the fall came from
More than half of the fall between 2024 and 2025 happened in Germany. Its count went from 13,345 to 4,925, down 8,420, which is 55.3% of the EU's drop of 15,230. Bulgaria's count fell by 2,025, from 2,600 to 575, and Greece's by 1,765, from 4,710 to 2,945, so the three largest falls make up 80.2% of the total one. Italy's count more than halved, from 2,030 to 985.
The published count went down in 19 Member States, up in five and was the same in three: Estonia, Hungary and Poland. Spain is the only Member State with more than 200 of these applicants whose count rose. In no year from 2014 to 2023 did its count exceed 100; it reached 910 in 2024 and 1,005 in 2025, the fourth largest in the EU after Germany, the Netherlands and Greece. The other rises are small: Latvia from 20 to 170, Lithuania from 0 to 30, Slovenia from 140 to 165 and Slovakia from 0 to 5. On counts rounded to five, a percentage rise from such a base says little about the change, and none is printed here.
Seven Member States recorded more than 1,000 of these applicants in 2024. In 2025 four did: Germany, the Netherlands, Greece and Spain.
Greece first when population is taken into account
A raw count mostly reflects the size of a country. To compare countries of different sizes, this study divides each count by the population on 1 January of the same year, giving a rate per million inhabitants. By that measure Greece comes first in 2025, at 283.9 applicants per million inhabitants, about seven times the EU figure of 39.7. Greece holds 2.3% of the EU's population and received 16.4% of these applications. Cyprus follows at 213.6 and the Netherlands at 194.5, and they are the only three Member States above 100 per million in 2025, against seven in 2024.
Latvia is fourth, at 91.4, a rate resting on 170 applicants, ahead of Bulgaria at 89.3. Slovenia and Belgium are both at 77.4, Belgium's count being provisional, followed by Austria at 62.0, Germany at 58.9 and Ireland at 40.4: ten Member States above the EU figure, and 17 below it.
The top of this ranking moves from year to year. Cyprus had the highest rate in 2023 and again in 2024, at 953.6 and then 677.8 per million, before its count fell from 655 to 210. Greece's rate also dropped, from 453.9 in 2024, but by less than those of Cyprus and Bulgaria, and it moved from second place to first.
The Netherlands, where the count fell by about a tenth
In the Netherlands the count went from 3,930 to 3,510, a fall of 10.7% while the EU total fell by 45.9%. Its share of the EU total therefore rose from 11.9% to 19.6%, close to one applicant in five. Its 2025 count is the second largest in the Union, behind Germany's, and its rate per million is 3.3 times the German one. Germany, the Netherlands and Greece together account for 63.5% of the 2025 total.
Where almost none are recorded
Czechia and Estonia both publish a count of zero for 2025, and Estonia's count is zero in every year of the table. Rounded to the nearest five, a zero stands for no more than two applicants, so it does not prove that no child applied. Hungary and Slovakia each publish 5, which gives 0.5 and 0.9 per million. Hungary had recorded 8,805 in 2015.
What the numbers leave out
The table says how many children applied, and where. It does not say why fewer did in 2025, how they travelled or what became of their applications, and this study offers no reason for any rise or fall. It is not a count of the children who arrived in the EU alone, only of those who asked for protection in a Member State.
Children applying for asylum without a responsible adult, per million inhabitants, 2025
| Country | applicants per million inhabitants (derived) | Gap to EU figurederived |
|---|---|---|
| Greece | 283.9 | +244.2 |
| Cyprus | 213.6 | +173.9 |
| Netherlands | 194.5 | +154.8 |
| European Unionaggregate | 39.7 | — |
| Hungary | 0.5 | −39.2 |
| Czechia | 0.0 | −39.7 |
| Estonia | 0.0 | −39.7 |
This table as data: CSV · JSON
Every Member State for this indicator+
Members see every Member State for this indicator here, not only the rows the ranking prints. Become a Member
Embed this chart
Paste this code into a page. The frame carries the source and the extraction date, and links back to the study.
Change in the number of children applying for asylum without a responsible adult, 2024 to 2025
| Country | applicants (derived) |
|---|---|
| Latvia | 150 |
| Spain | 95 |
| Greece | -1,765 |
| Bulgaria | -2,025 |
| Germany | -8,420 |
This table as data: CSV · JSON
Every Member State for this indicator+
Members see every Member State for this indicator here, not only the rows the ranking prints. Become a Member
Embed this chart
Paste this code into a page. The frame carries the source and the extraction date, and links back to the study.
What these figures cannot tell you
- Applications, not arrivals
- The table counts children under 18 who applied for international protection without a responsible adult. A child who arrives alone and does not apply is not in it, so a low count shows that few such applications were made, not that few children arrived on their own. Eurostat's metadata notes that definitions and practices in producing asylum statistics differ between countries, and that one person can apply in more than one Member State in the same year: that weighs on comparisons between countries, and an EU total built by adding national counts can count the same person twice.
- The age the authorities accepted
- Whether an applicant counts as a minor depends on the age the national authority accepted, in some cases after an age assessment procedure. Eurostat warns that this table and the counts of unaccompanied minors in its other asylum tables, which classify every applicant by status as a minor, can differ for that reason. This study uses this table alone and does not set its counts against the number of child applicants in those other tables.
- Every value rounded to the nearest five
- Eurostat rounds each value to the nearest five, and rounds the EU total separately from the national ones: the published EU figure is 5 above the sum of the 27 national counts for 2024 and 15 above it for 2014, and equals it for 2025. A published zero can stand for up to two applicants and a published 5 for three to seven, so the difference between two years can be out by up to four. For counts below about a hundred, a rank or a percentage change rests partly on the rounding; the text names the countries where that applies and prints no percentage change for them.
- Estimated, provisional and revised figures
- Eurostat's metadata lists France's data on unaccompanied minors as estimated since January 2023 in its asylum applicant tables, and records that France's 2025 figure in this table was revised in August 2026. Belgium's 2025 count is flagged as provisional. In the population table, the EU total for 1 January 2024 and 1 January 2025 is estimated and provisional, France's population provisional in both years and Romania's estimated.
- A rate computed here, on a wider population
- Eurostat publishes counts, not rates. Each rate per million inhabitants divides a year's count by the population on 1 January of that year, from tps00001, and the EU figure divides Eurostat's EU count by Eurostat's EU population, with no national figure summed here. The population takes in the country's own citizens and citizens of other EU countries, while only non-EU citizens and stateless people can appear in the count, so the rate measures scale between countries rather than the share of any group. Eurostat recommends that countries report their usually resident population, but its metadata records that Austria, Czechia, Denmark, Luxembourg, the Netherlands and Sweden report the people on their population registers and Germany another basis, so the denominator is not defined in exactly the same way in every Member State.
- No cause in the data, and a definition that is changing
- The table records no routes, policies or events, and so gives no reason for any rise or fall; none is stated here. Eurostat's metadata says that changes to what countries are asked to report affect comparability over time, and divides the series between guidelines applied from 2014 to 2020 and from 2021. Under the EU's Pact on Migration and Asylum, the definition of an asylum applicant moves from applications lodged to applicants registered from July 2026, with 2026 a transition year, so a comparison of 2026 with 2025 will cross a change of definition.
Frequently asked questions
- How many children applied for asylum in the EU without a parent in 2025?
- 17,930, in Eurostat's count of children under 18, from outside the EU or stateless, who applied for international protection in a Member State with no parent or other responsible adult. That is 45.9% fewer than the 33,160 of 2024, a derived change, and the lowest figure since 2020.
- What is an unaccompanied minor?
- In Eurostat's definition, a person under 18 who arrives in an EU Member State without an adult responsible for them, or who is left without one after arriving. Whether a person is under 18 is decided by the national authority, in some cases after an age assessment, so the age counted is the one officials accepted.
- Which EU country receives the most applications for its population?
- Greece, with 283.9 applicants per million inhabitants in 2025, about seven times the EU figure of 39.7; Cyprus follows at 213.6 and the Netherlands at 194.5. These rates are derived here from Eurostat's counts and its population on 1 January. In number rather than rate, Germany records the most, 4,925.
- Why did the number fall in 2025?
- The table does not say. It records applications and nothing about routes, policies or events, so this study gives no reason. What it shows is where the fall happened: Germany's count dropped by 8,420, which is 55.3% of the EU's fall, a derived share.
- Does the count include every child who reaches the EU alone?
- No. Only children who apply for asylum are in it, and only if they are citizens of a non-EU country or stateless; a child who never applies is not counted. Eurostat also notes that one person can apply in more than one Member State in a year, which an EU total built from national counts cannot separate.
Methodological note
The study measures the number of people under 18 who applied for international protection in an EU Member State during the year with no adult responsible for them, as Eurostat publishes it in table tps00194, drawn from the dataset migr_asyunaa, for every year from 2014 to 2025. The count covers citizens of non-EU countries and stateless people, both sexes and all ages under 18; its unit is the person, its age is the one the national authority accepted, and Eurostat rounds it to the nearest five. The EU figure is Eurostat's own total for the 27 Member States. The population on 1 January of each year from 2015 comes from tps00001, which Eurostat draws from the dataset demo_gind.
The counts are quoted as Eurostat publishes them, with Belgium's provisional 2025 value stated wherever it is named. Silver Data Lab derived the following, and nothing else: each rate per million inhabitants, as a published count divided by the published population on 1 January of the same year, for every Member State and, for the EU, as Eurostat's EU count divided by Eurostat's EU population; the change in each national count and in the EU total between 2024 and 2025, in applicants, and for the EU and the Netherlands also in per cent, with Italy's two counts compared as a ratio; the EU's 2025 total as a share of its 2015 total; Germany's fall, and the combined falls of Germany, Bulgaria and Greece, as shares of the EU's fall; the shares of the EU total held by Sweden in 2015, Germany in 2016, 2024 and 2025, the Netherlands in 2024 and 2025, Greece in 2025, and Germany, the Netherlands and Greece together in 2025; Greece's share of the EU population; the ratio of Greece's rate to the EU figure and of the Netherlands' rate to Germany's; the falls in the rates of Greece, Cyprus and Bulgaria between 2024 and 2025, compared with one another; and the numbers of Member States whose count rose, fell or stayed the same, that recorded more than 1,000 applicants, that exceed 100 per million, or that stand above or below the EU figure. Every count, rank and comparison covers all 27 Member States, each of which has a value in every year of both tables used.
Source data
This study draws on 2 datasets from Eurostat. Each can be inspected and re-downloaded from its catalogue, and the filters below are the ones applied.
Asylum applicants considered to be unaccompanied minors - annual data
tps00194
- Filters applied:
- freq=A · citizen=EXT_EU27_2020 · sex=T · unit=PER · age=TOTAL
- Extracted:
- 2026-10-22
- Source last updated:
- 2026-08-27
Population on 1 January
tps00001
- Filters applied:
- freq=A · indic_de=JAN
- Extracted:
- 2026-10-22
- Source last updated:
- 2026-09-30
Download the data
The data the study you have just read is built on, exactly as it was downloaded and archived.
Yours as a Member.
Data downloadable by Members
How to cite
Record the vintage as well as the study: the figures on this page are the ones extracted on the dates below.
Silver Data Lab Research Desk (2026). 45.9% Fewer Children Sought Asylum Alone in the EU Than a Year Earlier. Silver Data Lab, published 22 October 2026, last updated 22 October 2026. https://www.silverdatalab.com/studies/unaccompanied-minors-in-the-eu
- Data: Eurostat, Asylum applicants considered to be unaccompanied minors - annual data (tps00194), filters freq=A, citizen=EXT_EU27_2020, sex=T, unit=PER, age=TOTAL; extracted 2026-10-22; source last updated 2026-08-27. https://doi.org/10.2908/tps00194
- Data: Eurostat, Population on 1 January (tps00001), filters freq=A, indic_de=JAN; extracted 2026-10-22; source last updated 2026-09-30. https://doi.org/10.2908/tps00001
Silver Data Lab's analysis is licensed CC BY 4.0. The statistics remain their publisher's and keep its terms of reuse.
Ask the research desk
A question about this study — a definition, a filter, a break in the series, what the figures can and cannot support — answered by the desk that made the extraction.
Members can write to the research desk
Studies where the same country leads or trails
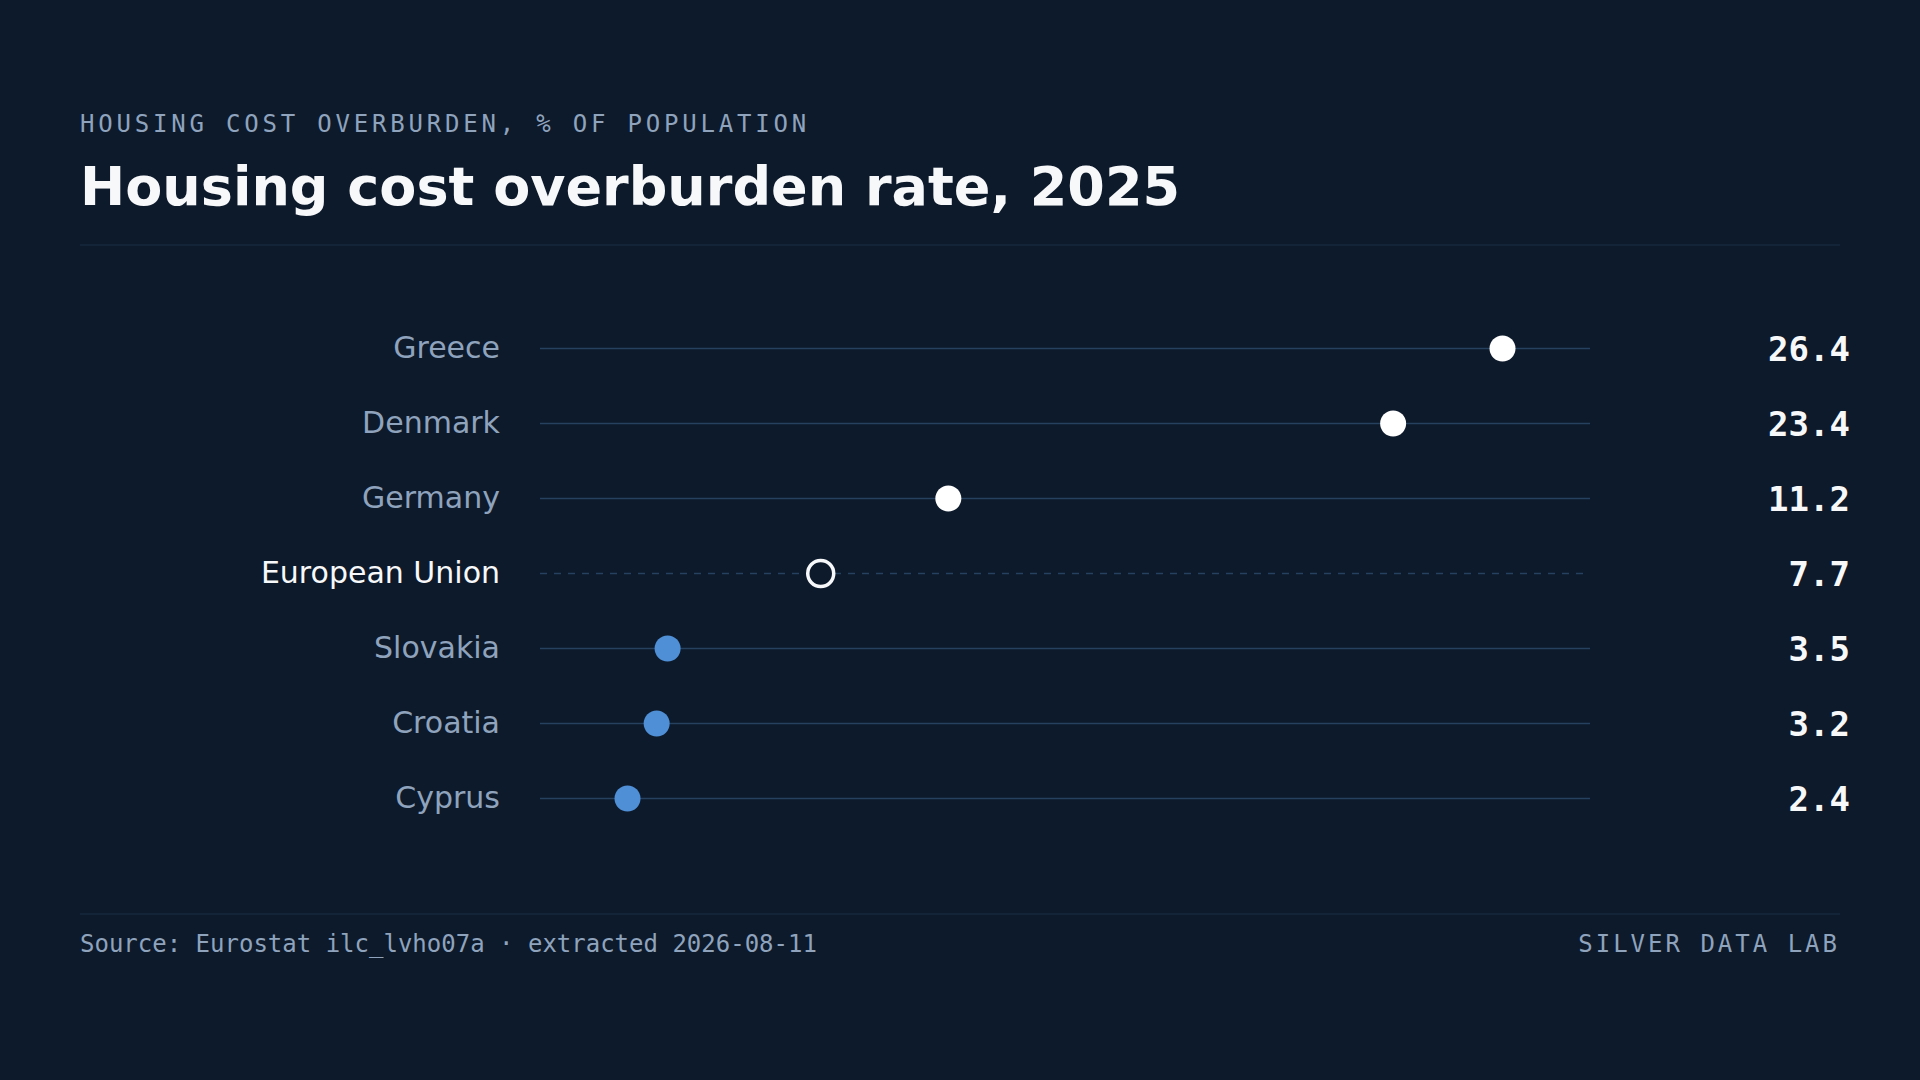
A Quarter of Greeks Spend More Than 40% of Income on Housing
7.7% of the EU population spent more than 40% of disposable income on housing in 2025.
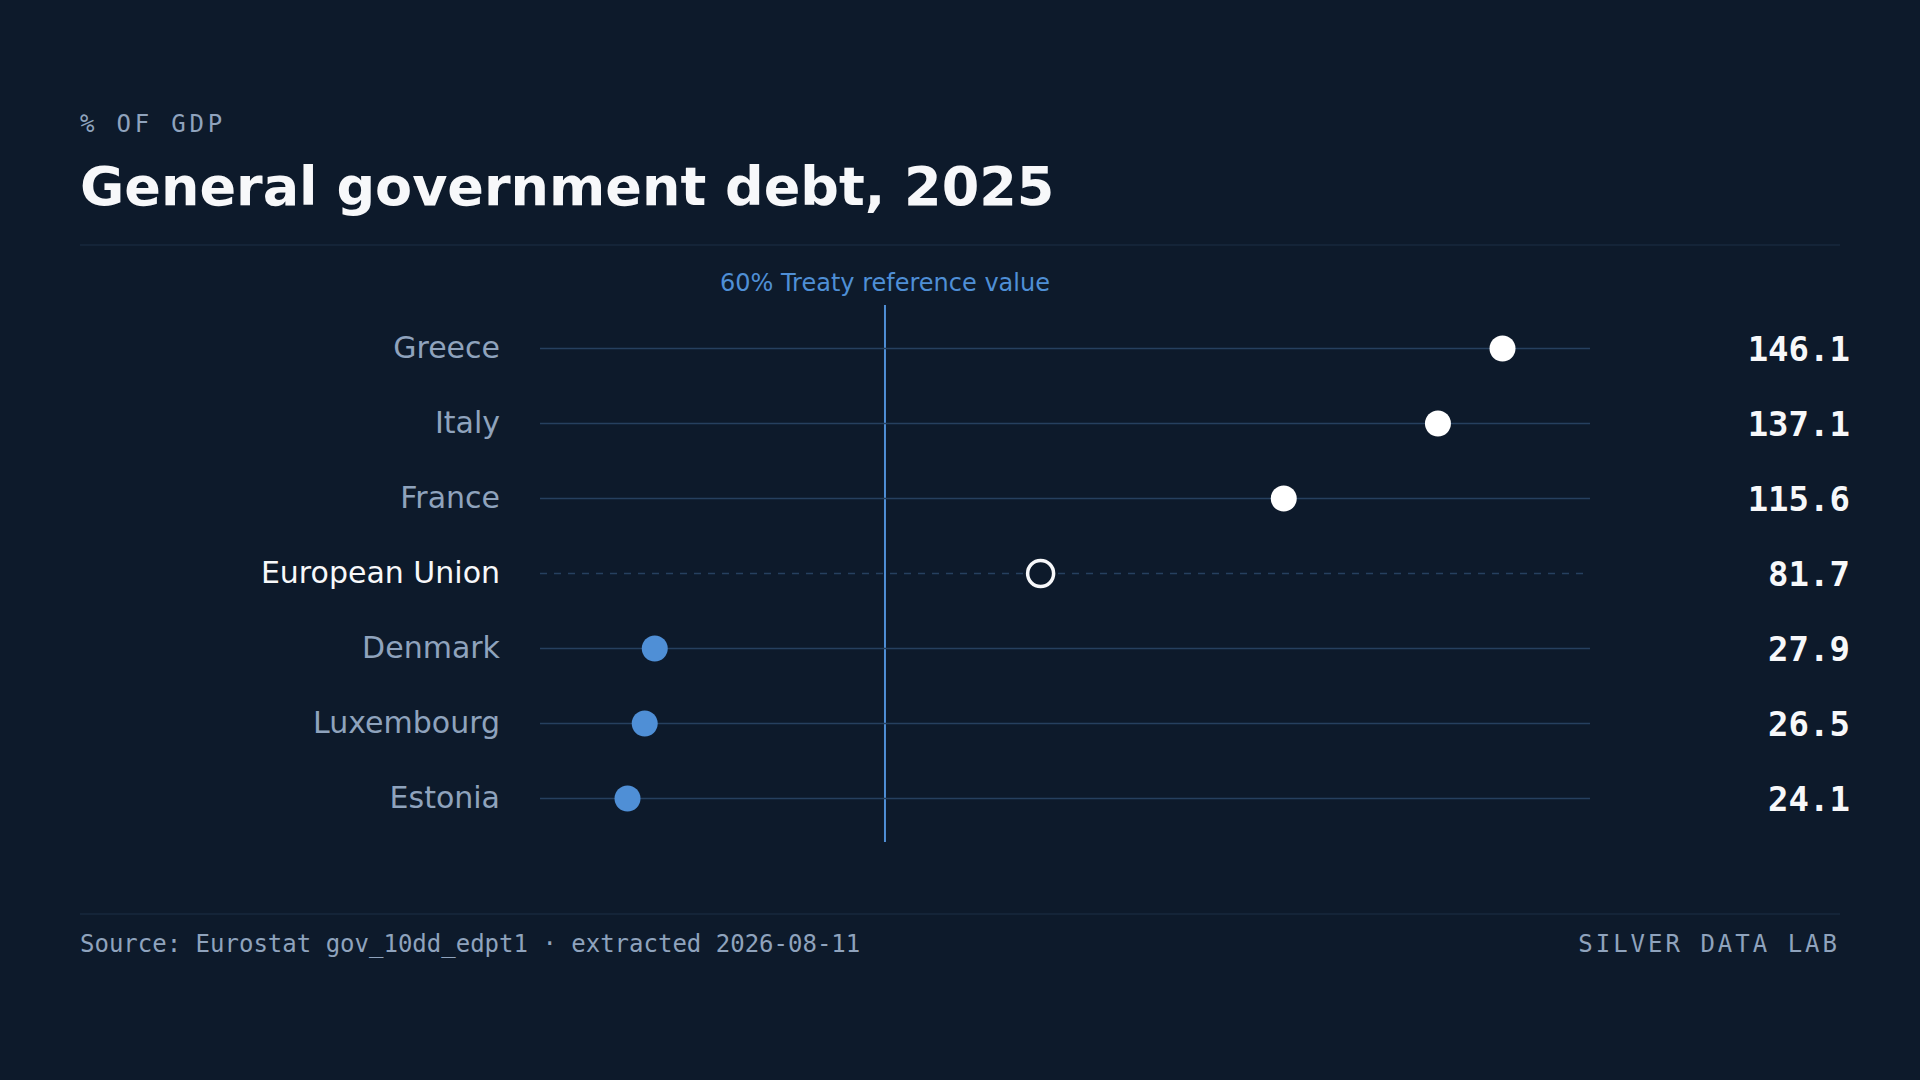
Greece Has the EU's Highest Debt Relative to GDP and a Budget Surplus
EU general government debt stood at 81.5% of GDP in 2025, against a Treaty reference value of 60%.
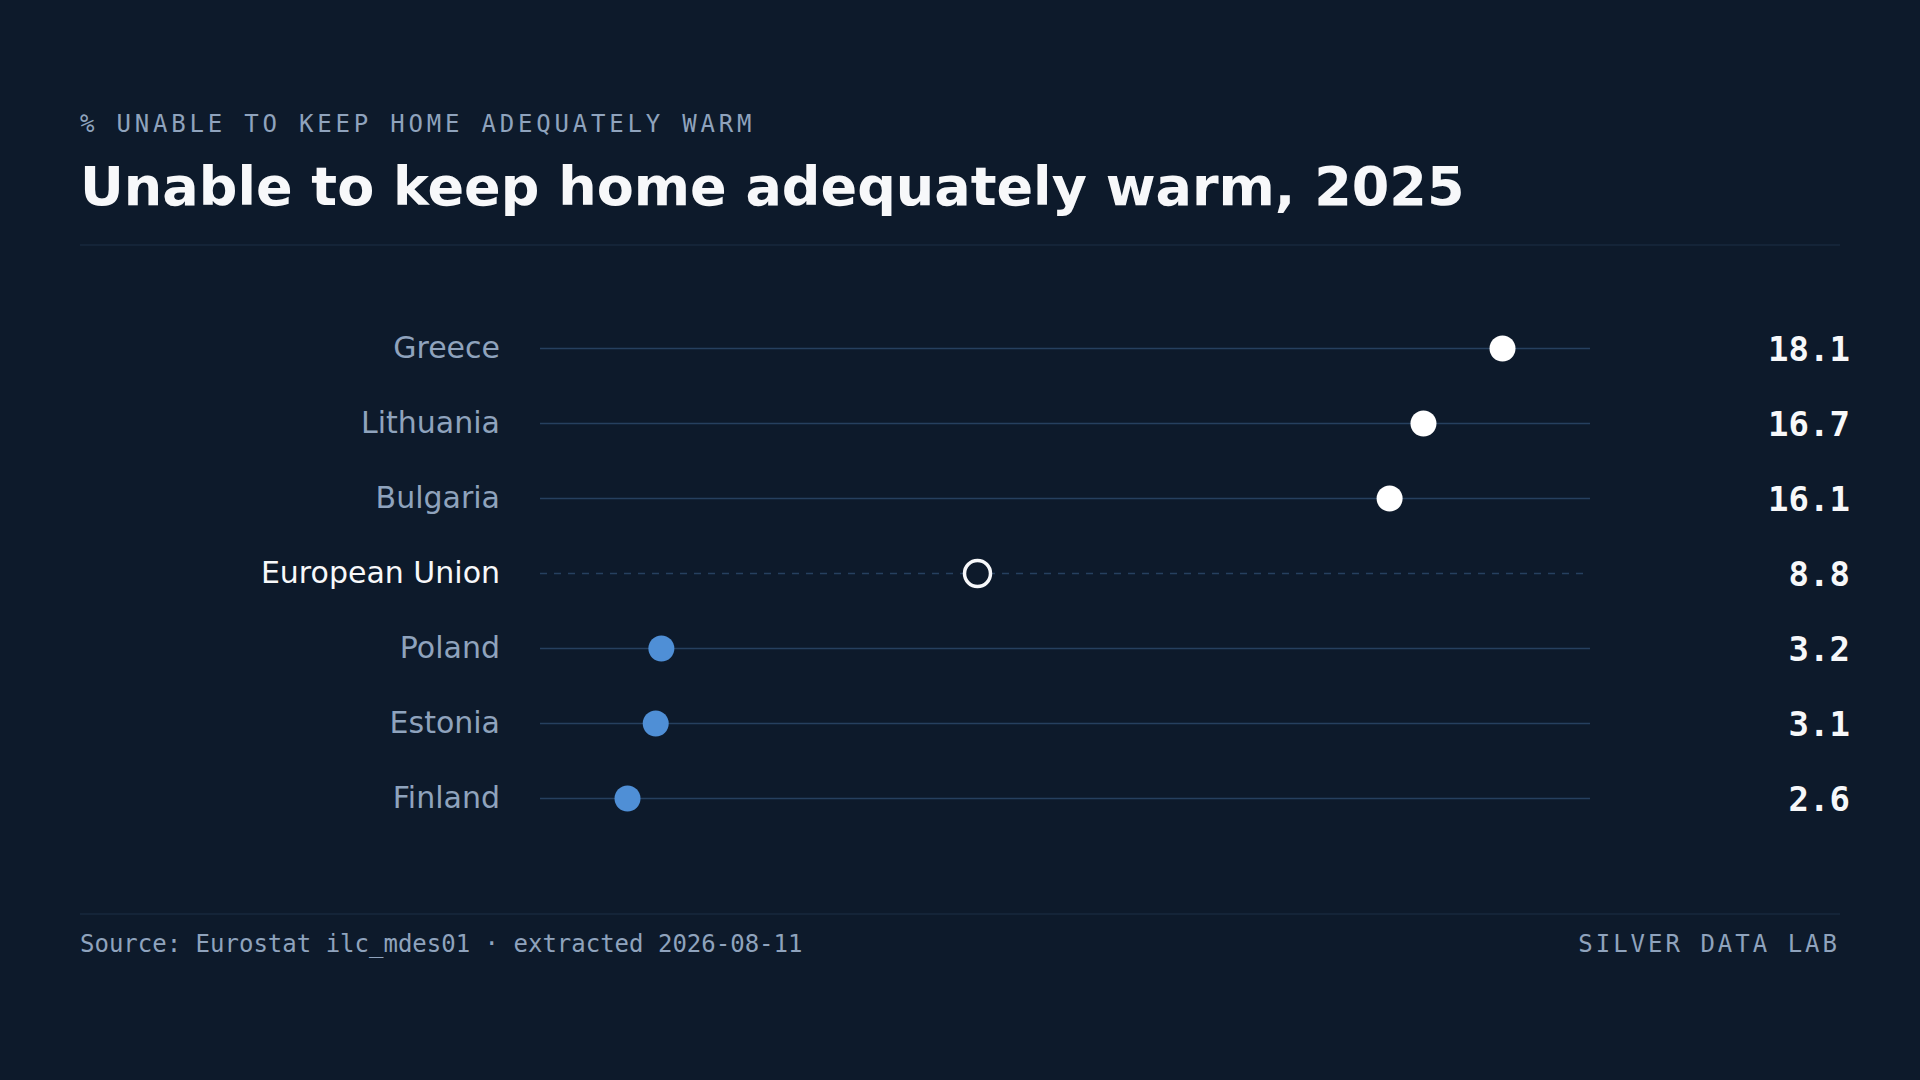
Greece Has the EU's Highest Share of People Who Cannot Afford Heating
8.8% of the EU population could not keep their home adequately warm in 2025.