Greece Has the EU's Highest Debt Relative to GDP and a Budget Surplus
Silver Data Lab Research Desk · Statistical analysis · Published on 25 April 2026
- Data source
- Eurostat
- Reference period
- 2025
- Last updated
- 22 October 2026
Re-checked against the source on 22 October 2026. 289 values in its datasets moved between snapshots, 16 of them figures stated on this page. Every revision we have observed →
Key estimates
- EU general government debt stood at 81.5% of GDP in 2025, against a Treaty reference value of 60%.
- Twelve Member States exceeded the debt limit and ten ran deficits worse than the 3% limit — but only seven appear on both lists.
- Greece carries the Union's highest debt at 145.4% of GDP while running a budget surplus of 2.0%.
- Romania records the worst deficit at 7.8% of GDP while its debt, at 58.9%, sits just inside the limit.
- Five Member States breach the debt rule alone and three breach the deficit rule alone, which is why neither figure identifies fiscal stress by itself.
A stock and a flow, routinely confused
European fiscal surveillance rests on two numbers, and they measure different things. Government debt is a stock: everything owed, accumulated over decades, expressed against one year's output. The deficit is a flow: the gap between what a government spent and raised in a single year.
The Treaty attaches a reference value to each — 60% of GDP for debt, 3% for the deficit — and public debate tends to collapse the two into a single idea of fiscal health. The 2025 figures show why that does not work: the two rules identify substantially different countries.
Who breaches the debt rule
EU general government debt stood at 81.5% of GDP in 2025, comfortably above the 60% reference value, and twelve Member States sat above it individually.
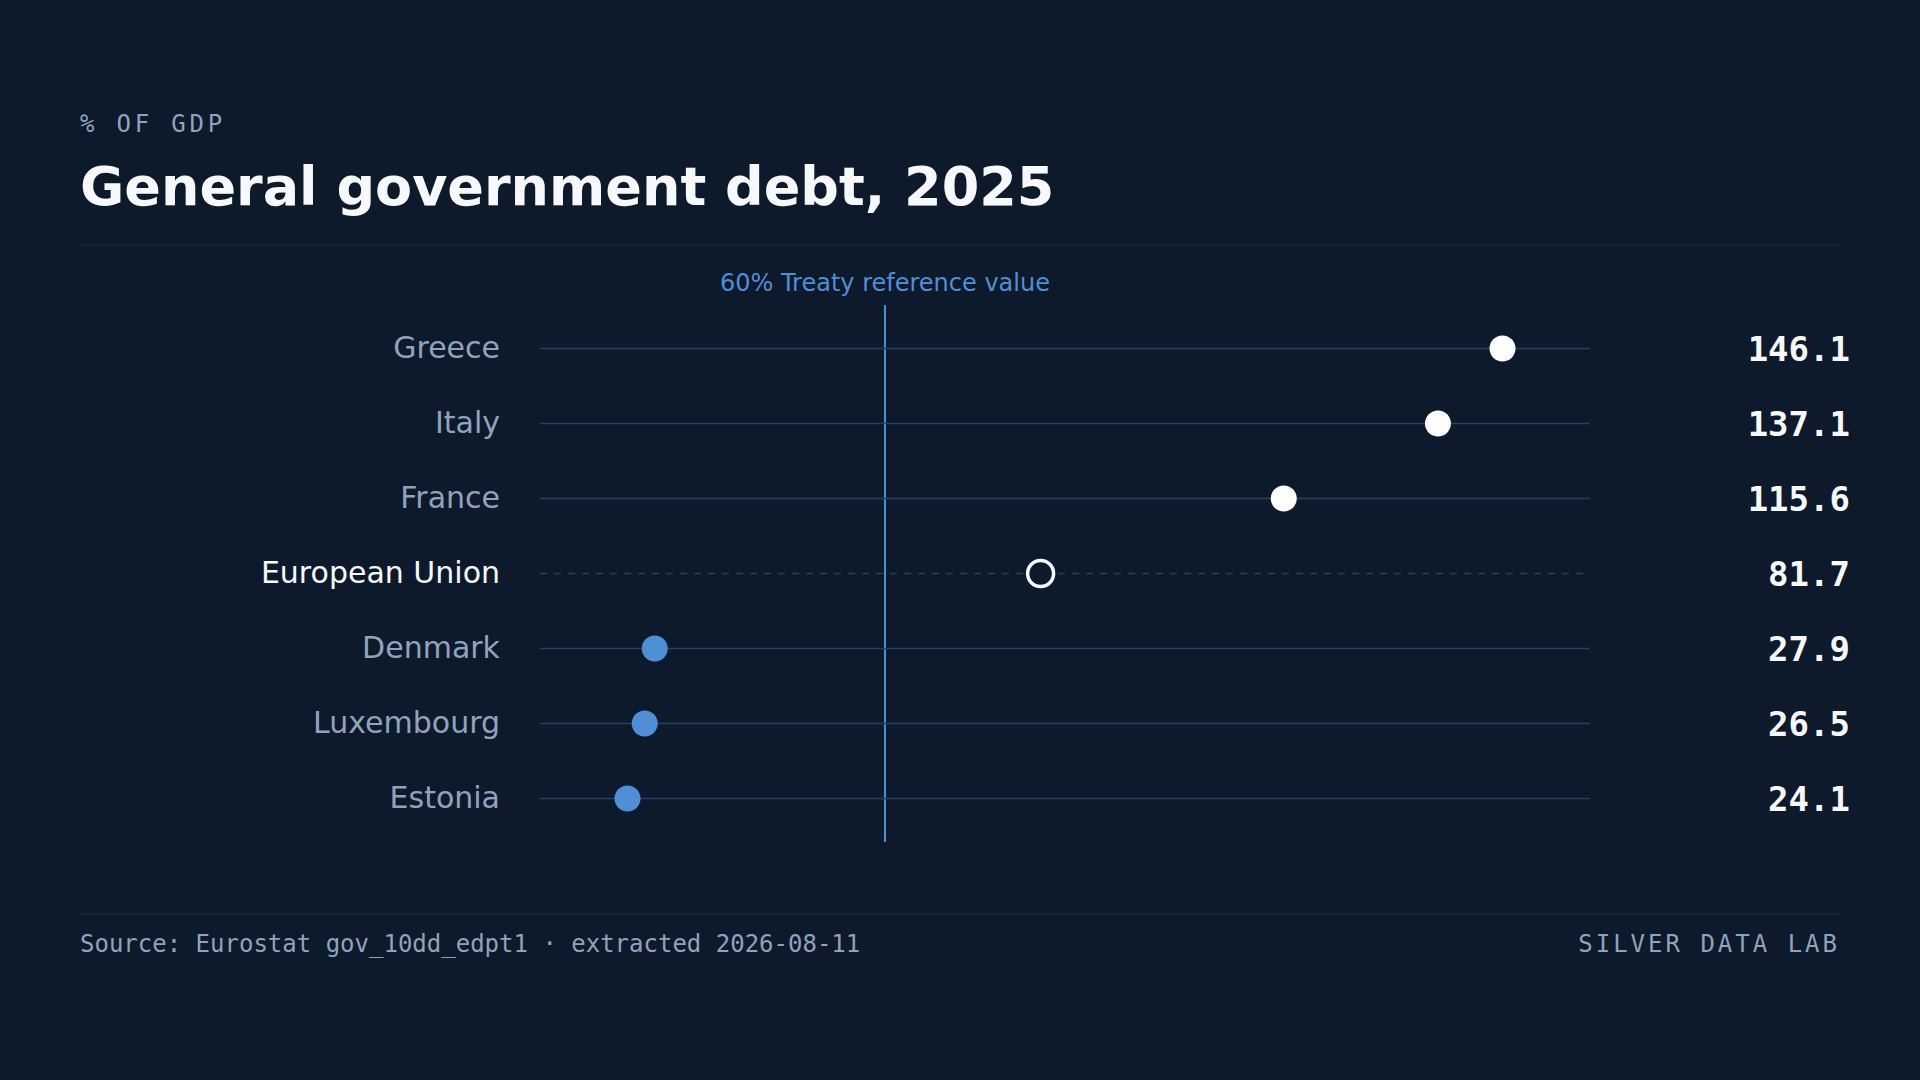
Greece leads at 145.4%, followed by Italy at 136.7% and France at 115.7%. Belgium at 108.1% and Spain at 100.5% complete the group above 100%. Portugal at 89.2%, Finland at 88.4%, Austria at 80.7%, Hungary at 74.4%, Slovenia at 65.1%, Germany at 62.8% and Slovakia at 60.5% make up the rest.
At the other end, Estonia records 24.0%, Luxembourg 26.0% and Denmark 27.2% — under half the reference value, and roughly a fifth of what Greece carries.
Who breaches the deficit rule
Ten Member States ran deficits worse than 3% of GDP in 2025, and the list is not the same one.
Romania is furthest out at 7.8%, followed by Poland at 7.2%, Belgium at 5.2% and France at 5.1%. Hungary at 4.7%, Slovakia at 4.4%, Austria at 4.1%, Bulgaria at 4.0%, Finland at 3.8% and Italy at 3.1% complete the group.
Five Member States finished the year in surplus: Cyprus at 3.6%, Denmark at 2.9%, Greece at 2.0%, Ireland at 1.8% and Portugal at 0.7%.
Where the two lists disagree
Seven Member States breach both rules: Austria, Belgium, Finland, France, Hungary, Italy and Slovakia. Those are the cases where the two measures agree, and where the ordinary reading of fiscal stress applies.
Five breach the debt rule alone — Germany, Greece, Spain, Portugal and Slovenia. Their stock of debt is the legacy of past decisions; their current budgets are not adding to it at a rate the rules object to. Greece is the clearest case in the Union: the highest debt ratio anywhere, and a surplus.
Three breach the deficit rule alone — Bulgaria, Poland and Romania. Their accumulated debt is modest, and they are spending beyond their revenue now. Romania combines the worst deficit in the Union with a debt ratio of 58.9%, which sits under the limit by just over a point.
These are opposite situations, and a single ranking of either indicator would file them together. Debt describes what a country has already committed to; the deficit describes the direction it is currently moving. A country can be heavily indebted and consolidating, or lightly indebted and deteriorating, and the two rules exist because neither question answers the other.
General government debt, 2025
| Country | % of GDP | Gap to EU averagepercentage points, derived |
|---|---|---|
| Greece | 145.4 | +63.9 |
| Italy | 136.7 | +55.2 |
| France | 115.7 | +34.2 |
| European Unionaggregate | 81.5 | — |
| Denmark | 27.2 | −54.3 |
| Luxembourg | 26.0 | −55.5 |
| Estonia | 24.0 | −57.5 |
This table as data: CSV · JSON
Every Member State for this indicator+
Members see every Member State for this indicator here, not only the rows the ranking prints. Become a Member
Embed this chart
Paste this code into a page. The frame carries the source and the extraction date, and links back to the study.
Government budget balance, 2025
| Country | % of GDP, surplus positive | Gap to EU averagepercentage points, derived |
|---|---|---|
| Cyprus | 3.6 | +6.7 |
| Denmark | 2.9 | +6.0 |
| Greece | 2.0 | +5.1 |
| European Unionaggregate | -3.1 | — |
| Belgium | -5.2 | −2.1 |
| Poland | -7.2 | −4.1 |
| Romania | -7.8 | −4.7 |
This table as data: CSV · JSON
Every Member State for this indicator+
Members see every Member State for this indicator here, not only the rows the ranking prints. Become a Member
Embed this chart
Paste this code into a page. The frame carries the source and the extraction date, and links back to the study.
What these figures cannot tell you
- Debt is measured against one year of output
- A debt-to-GDP ratio moves when either term moves. A country can reduce the ratio without repaying anything if nominal GDP grows, through real growth or inflation, and can see it rise in a recession without borrowing more. Year-on-year changes should not be read as decisions taken by a government.
- The 60% and 3% values are reference values, not the whole framework
- The Treaty reference values are the thresholds quoted here because they are fixed and comparable. The surveillance framework built on them assesses adjustment paths, cyclical conditions and one-off items, so exceeding a reference value is not by itself a finding about compliance. This study measures the ratios, not the procedures.
- General government, not the state alone
- Figures cover the general government sector: central, state and local government together with social security funds. Member States differ substantially in how much activity sits at each level and how much sits in publicly owned corporations outside the sector entirely, which affects cross-country comparison of both indicators.
- These figures are revised
- Deficit and debt statistics are reported twice a year and revised as national accounts are updated. The values here are those published at the extraction date and later vintages may differ, particularly for the most recent year.
Frequently asked questions
- Which EU country has the highest government debt?
- Greece, at 145.4% of GDP in 2025, followed by Italy at 136.7% and France at 115.7%. The EU aggregate was 81.5%, against a Treaty reference value of 60%.
- Which EU country has the largest budget deficit?
- Romania, at 7.8% of GDP in 2025, ahead of Poland at 7.2%. Five Member States ran surpluses instead: Cyprus, Denmark, Greece, Ireland and Portugal.
- How many EU countries break the fiscal rules?
- In 2025, twelve Member States carried debt above 60% of GDP and ten ran deficits worse than 3%. Only seven appear on both lists, which is why the two indicators cannot be substituted for one another.
- How can Greece have the highest debt and still run a surplus?
- Because debt is a stock and the deficit is a flow. Greece's 145.4% ratio is the accumulated result of past borrowing, while its 2025 budget took in more than it spent, by 2.0% of GDP. Romania is the mirror image: the Union's worst deficit alongside a debt ratio of 58.9%, just inside the limit.
Methodological note
Both indicators come from the same dataset, covering the general government sector and expressed as a percentage of GDP for 2025.
Debt is government consolidated gross debt, Eurostat's GD item, the measure the Treaty reference value of 60% applies to. The budget balance is net lending or net borrowing, item B9, where a negative value is a deficit and a positive value a surplus; the reference value of 3% applies to deficits.
The counts of Member States breaching each rule, and the division into those breaching both, only the debt rule and only the deficit rule, are derived by Silver Data Lab from the published ratios by comparison against the two reference values.
Source data
The underlying series can be inspected and re-downloaded from the Eurostat data browser. The filters below are the ones applied.
Government deficit/surplus, debt and associated data
gov_10dd_edpt1
- Filters applied:
- freq=A · sector=S13 · na_item=GD, B9 · unit=PC_GDP · time=2025
- Extracted:
- 2026-10-22
- Source last updated:
- 2026-10-21
Download the data
The data the study you have just read is built on, exactly as it was downloaded and archived.
Yours as a Member.
Data downloadable by Members
How to cite
Record the vintage as well as the study: the figures on this page are the ones extracted on the dates below.
Silver Data Lab Research Desk (2026). Greece Has the EU's Highest Debt Relative to GDP and a Budget Surplus. Silver Data Lab, published 25 April 2026, last updated 22 October 2026. https://www.silverdatalab.com/studies/government-debt-and-deficit-in-the-eu
- Data: Eurostat, Government deficit/surplus, debt and associated data (gov_10dd_edpt1), filters freq=A, sector=S13, na_item=GD, B9, unit=PC_GDP, time=2025; extracted 2026-10-22; source last updated 2026-10-21. https://doi.org/10.2908/gov_10dd_edpt1
Silver Data Lab's analysis is licensed CC BY 4.0. The statistics remain their publisher's and keep its terms of reuse.
Ask the research desk
A question about this study — a definition, a filter, a break in the series, what the figures can and cannot support — answered by the desk that made the extraction.
Members can write to the research desk
Studies where the same country leads or trails
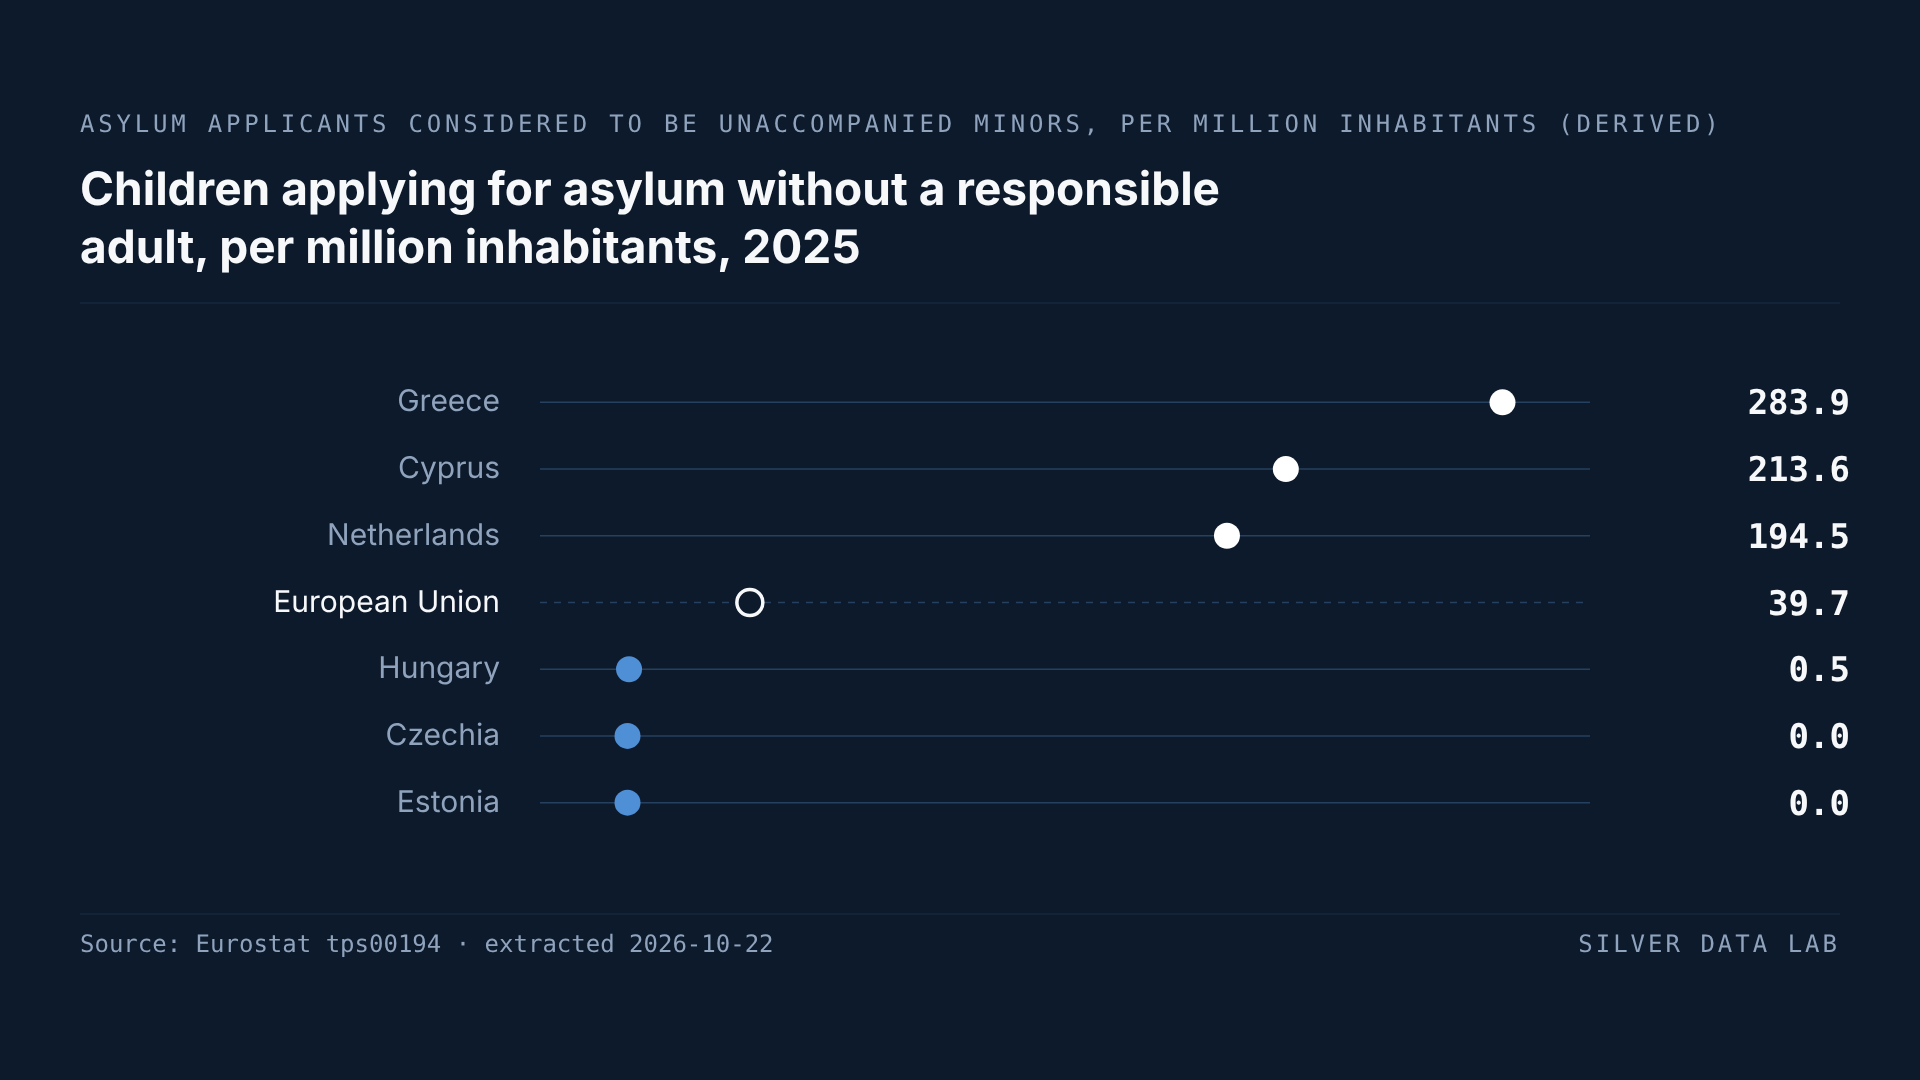
45.9% Fewer Children Sought Asylum Alone in the EU Than a Year Earlier
In 2025, 17,930 children applied for asylum in the EU without a parent or another adult responsible for them, against 33,160 in 2024: a derived fall of 45.9%, to the lowest figure since 2020.
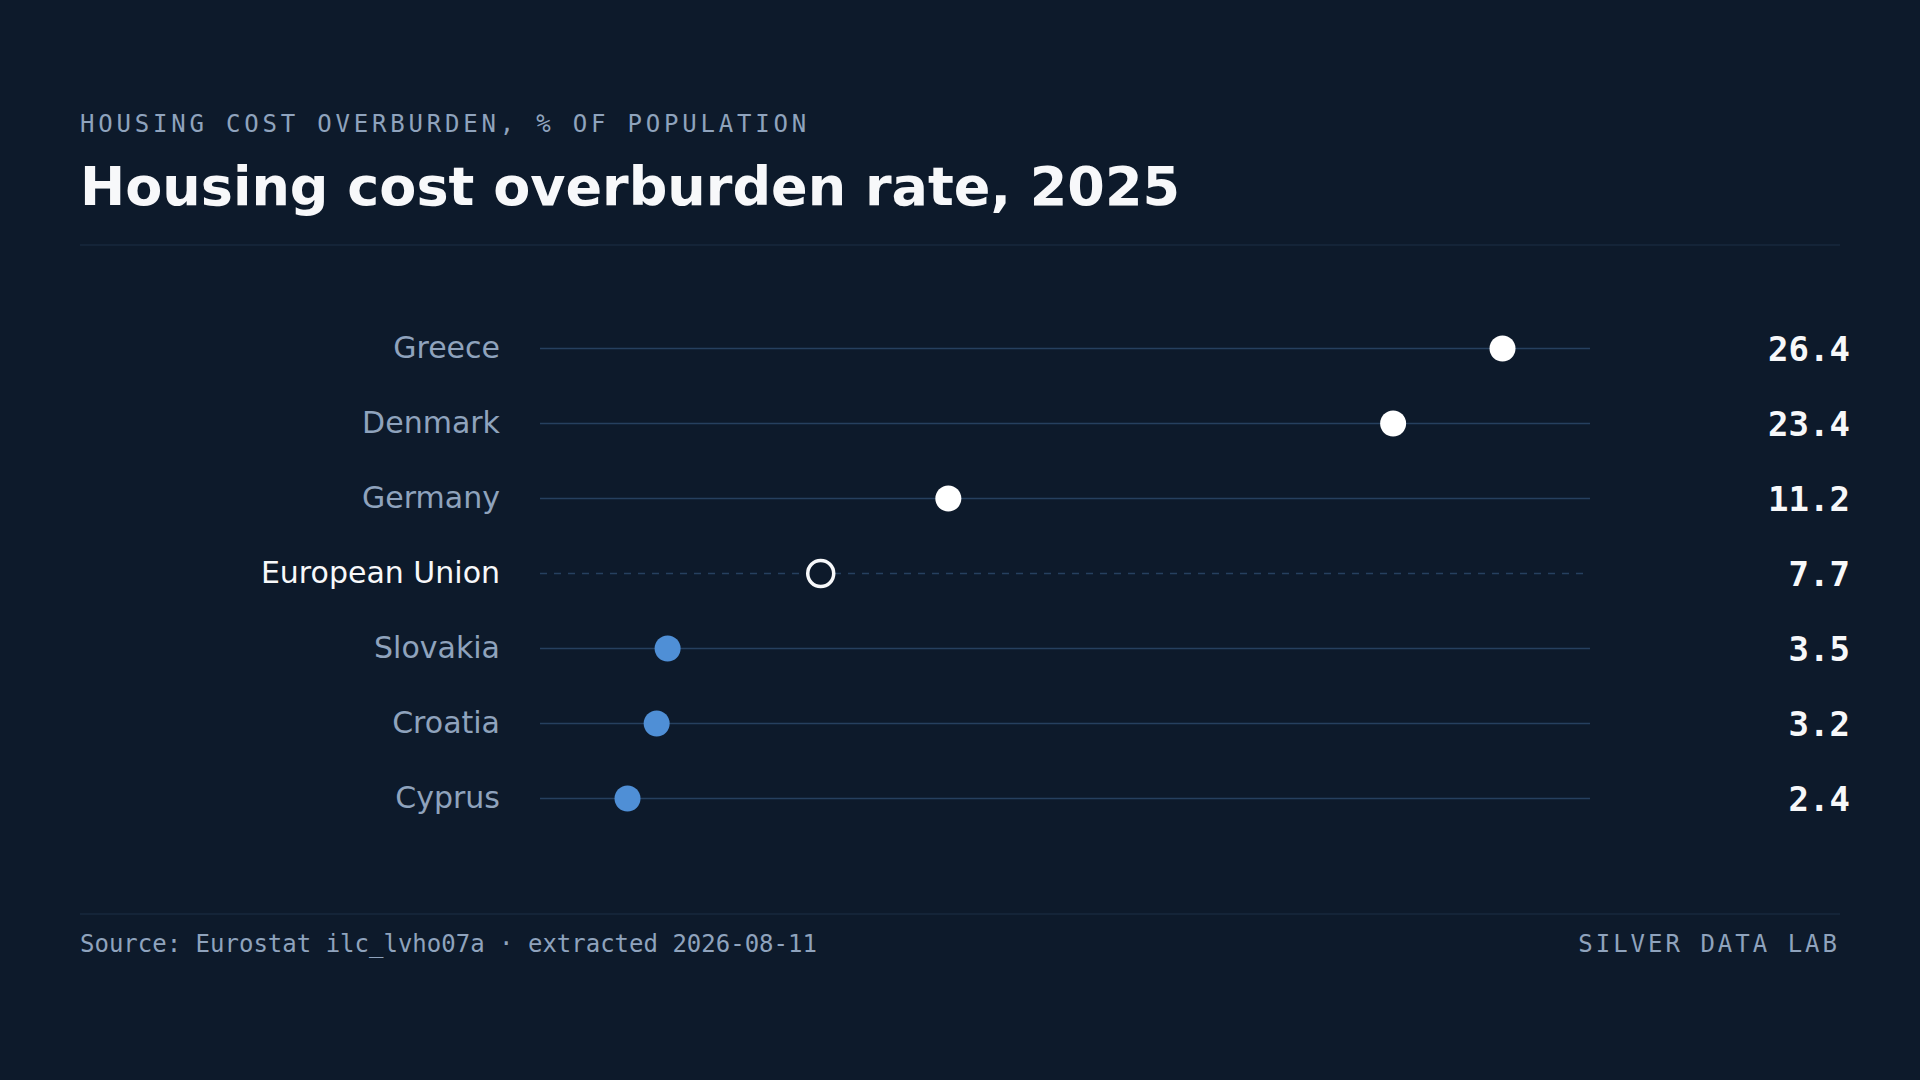
A Quarter of Greeks Spend More Than 40% of Income on Housing
7.7% of the EU population spent more than 40% of disposable income on housing in 2025.
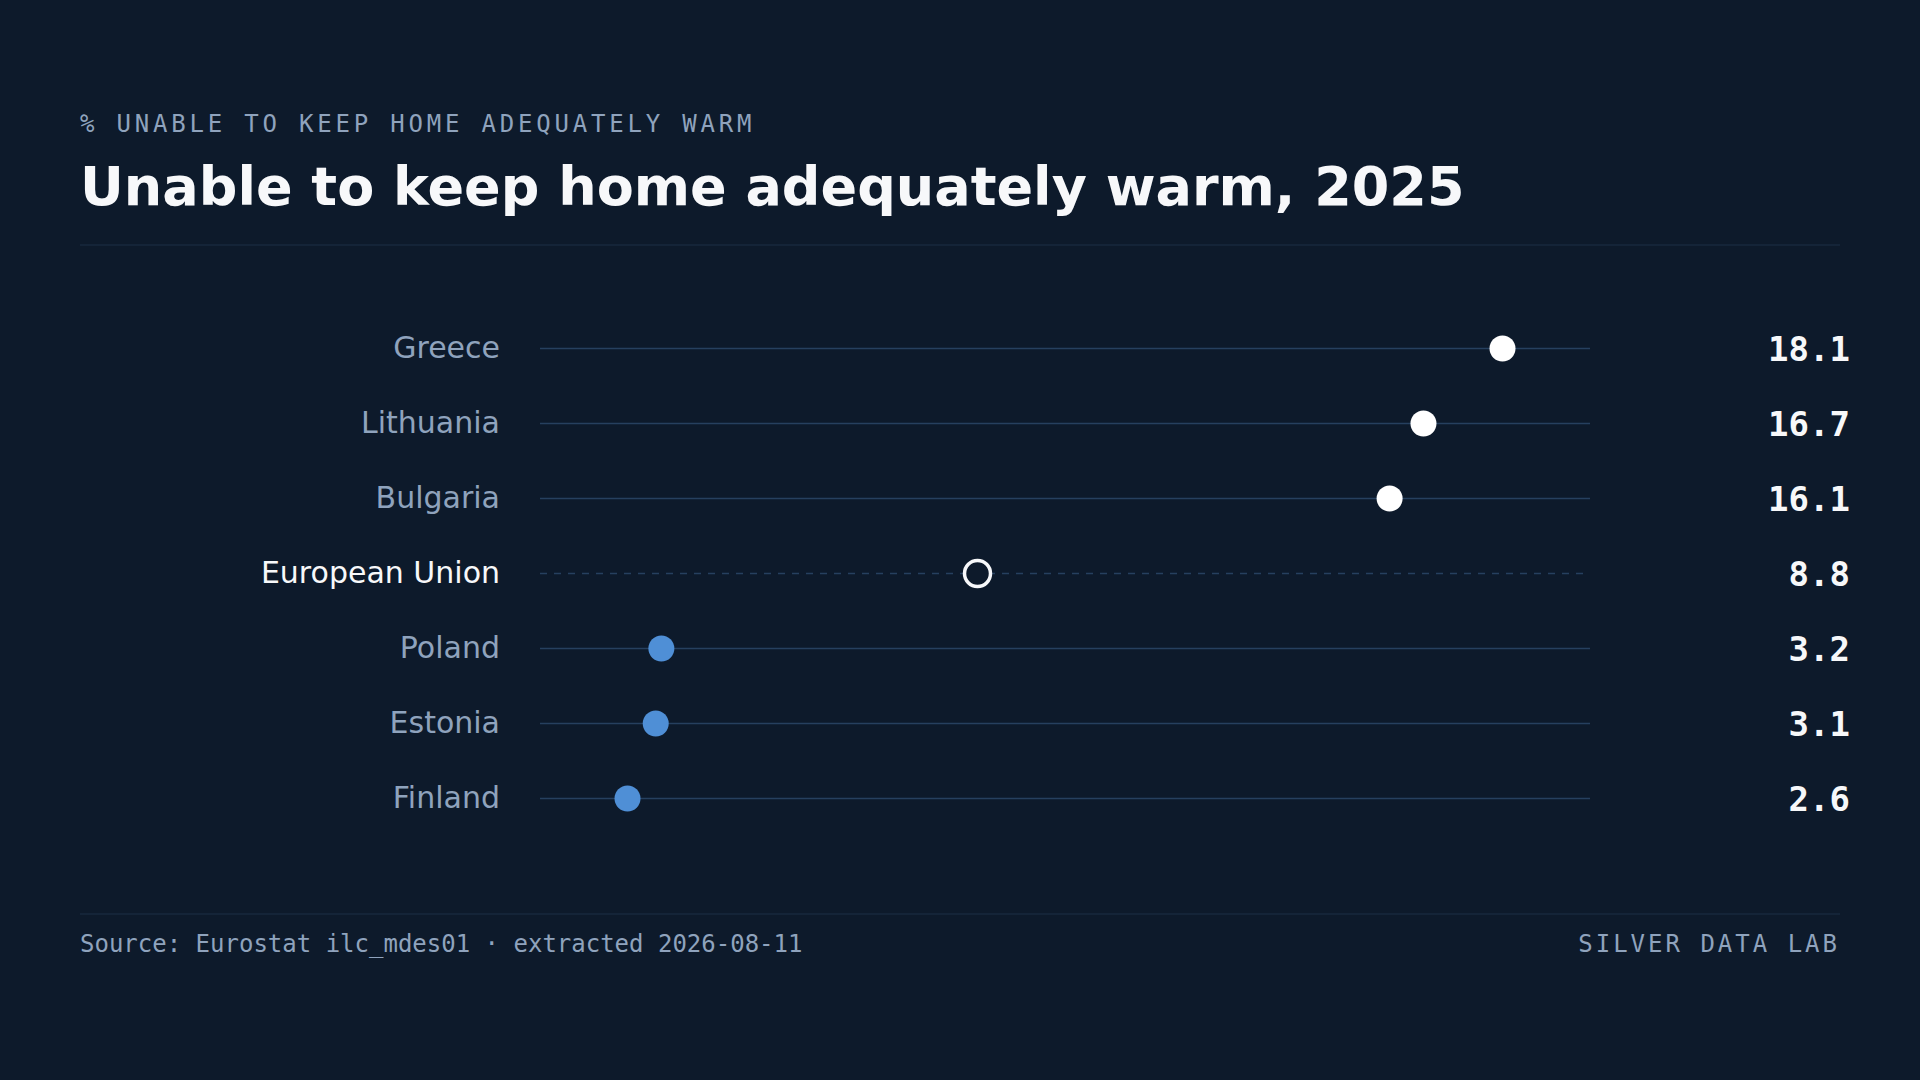
Greece Has the EU's Highest Share of People Who Cannot Afford Heating
8.8% of the EU population could not keep their home adequately warm in 2025.