Greece Has the EU's Highest Share of People Who Cannot Afford Heating
Silver Data Lab Research Desk · Statistical analysis · Published on 14 June 2026
- Data source
- Eurostat
- Reference period
- 2025
- Last updated
- 11 October 2026
Re-checked against the source on 21 October 2026. No value in its datasets has moved between the snapshots we hold. Every revision we have observed →
Key estimates
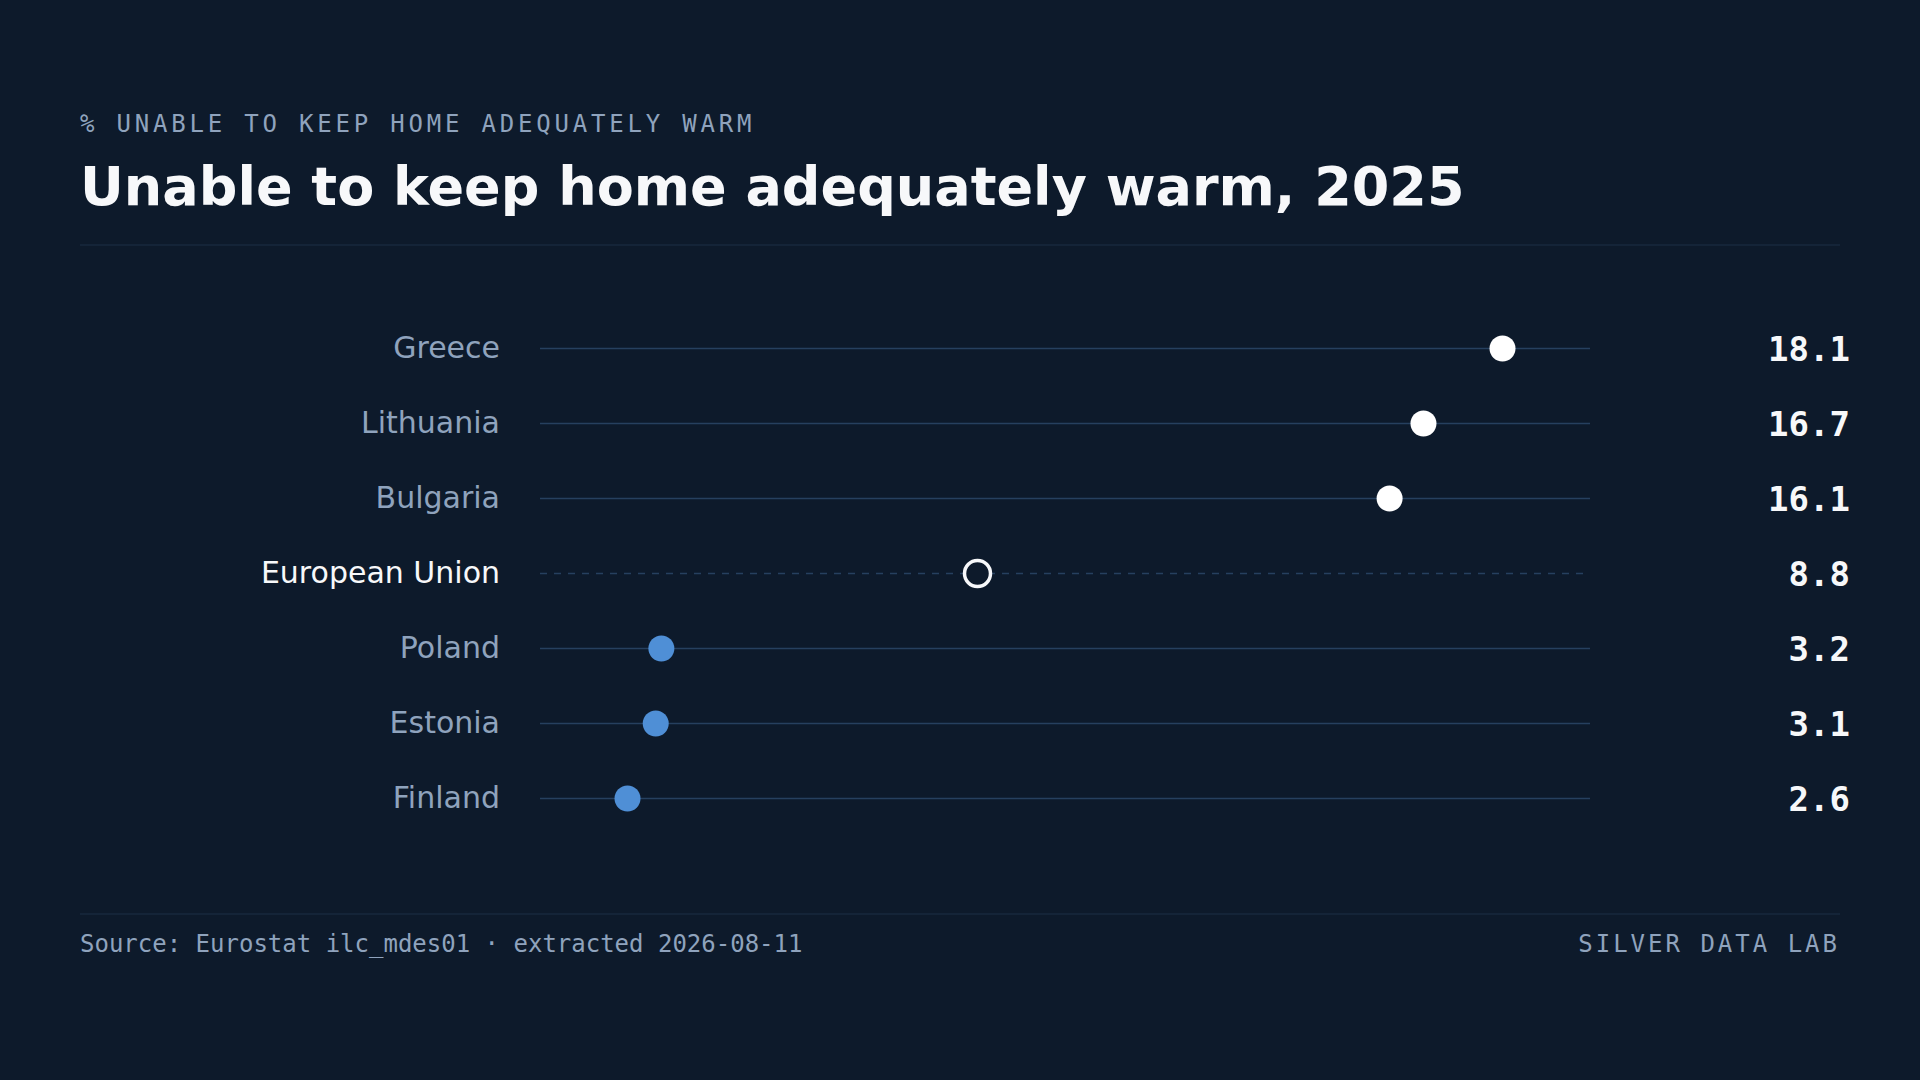
- 8.8% of the EU population could not keep their home adequately warm in 2025.
- Greece records the highest rate at 18.1%, followed by Lithuania at 16.7% and Bulgaria at 16.1%.
- Finland records the lowest at 2.6%, with Estonia at 3.1% and Poland at 3.2%.
- Spain at 15.9% and Portugal at 15.6% are both around twice the EU rate, despite mild winters.
- Four of the five worst-affected Member States are southern European, and the coldest country in the Union has the smallest share of people affected.
A ranking that runs against the thermometer
The share of people who cannot keep their home adequately warm is the most direct measure of energy poverty the European statistical system publishes. It comes from a household survey and asks about affordability rather than temperature: households that could heat adequately but choose not to are not counted.
Across the EU, 8.8% answered that they could not in 2025 — roughly one person in eleven.
The intuitive expectation is that this tracks winter severity. It does not. It runs close to the opposite.
Where people cannot keep warm
Greece records 18.1%, the highest rate in the Union. Lithuania follows at 16.7%, Bulgaria at 16.1%, Spain at 15.9% and Portugal at 15.6%.
Four of those five are southern European countries with mild winters. Spain and Portugal, in particular, record rates around twice the EU average despite having among the shortest heating seasons in the Union.
Where they can
Finland records 2.6%, the lowest in the EU. Estonia follows at 3.1%, Poland at 3.2%, Luxembourg at 3.5% and Slovenia at 3.6%.
Finland has the coldest winters of any Member State and the smallest share of people unable to heat their homes. Sweden at 4.7% and Denmark at 4.5% sit similarly low.
What explains the inversion
This study cannot demonstrate causes from a single affordability question, and will not claim to. What the pattern is consistent with is straightforward and worth stating as a hypothesis rather than a finding: countries with long cold winters have building stock, heating systems and energy policy built around the assumption that heating is essential, while countries with mild winters have historically treated it as optional and built accordingly.
A poorly insulated home in Athens is cheap to build and expensive to heat for the few weeks a year it needs it. A Finnish home is the reverse.
Whether that is the explanation would require data on building stock and heating systems that this extraction does not contain. What the extraction does establish is that the ranking cannot be read as a map of climate, and that any policy discussion assuming energy poverty concentrates in cold countries is starting from the wrong place.
The Lithuanian exception
Lithuania at 16.7% is the case that does not fit either story. It has cold winters and the second-highest rate in the Union, sitting between Greece and Bulgaria.
Naming the exception matters more than smoothing it away. A pattern that holds for most of the distribution and fails clearly for one Member State is a pattern with a boundary, and the boundary is part of the finding.
Unable to keep home adequately warm, 2025
| Country | % of population | Gap to EU averagepercentage points, derived |
|---|---|---|
| Greece | 18.1 | +9.3 |
| Lithuania | 16.7p | +7.9 |
| Bulgaria | 16.1 | +7.3 |
| European Unionaggregate | 8.8 | — |
| Poland | 3.2 | −5.6 |
| Estonia | 3.1 | −5.7 |
| Finland | 2.6 | −6.2 |
Flags carried by the source on these values: p provisional
This table as data: CSV · JSON
Every Member State for this indicator+
Members see every Member State for this indicator here, not only the rows the ranking prints. Become a Member
Embed this chart
Paste this code into a page. The frame carries the source and the extraction date, and links back to the study.
What these figures cannot tell you
- This is a self-reported affordability question
- The indicator records whether a household says it cannot afford to keep the home adequately warm. Adequately is not defined by a temperature, so what respondents consider adequate may itself differ between countries with different heating norms — which could contribute to the pattern this study describes.
- Causes are not established here
- The explanation offered in the text — building stock and heating infrastructure built around different climatic assumptions — is a hypothesis consistent with the data, not a finding from it. Establishing it would require information on insulation, heating systems and energy prices that this extraction does not contain.
- Survey data
- Figures come from EU-SILC, a sample survey. They are estimates rather than counts, and differences of a few tenths of a point between Member States should not be treated as meaningful.
- One question is not the whole of energy poverty
- Energy poverty is also measured through arrears on utility bills, the share of income spent on energy, and housing conditions. This indicator captures one dimension of it, and a country can perform differently on the others.
Frequently asked questions
- How many Europeans cannot heat their homes?
- 8.8% of the EU population reported being unable to keep their home adequately warm in 2025, roughly one person in eleven. National rates ranged from 18.1% in Greece to 2.6% in Finland.
- Which EU country has the worst energy poverty?
- On this measure Greece, at 18.1% in 2025, ahead of Lithuania at 16.7% and Bulgaria at 16.1%. Spain at 15.9% and Portugal at 15.6% follow, both around twice the EU rate.
- Why do warm countries score worse on energy poverty?
- The pattern is clear in the data and its cause is not established by it. A plausible explanation is that countries with mild winters have building stock and heating systems built on the assumption that heating is occasional, making it expensive when it is needed. Confirming that would require data on insulation and heating systems that this indicator does not contain.
- Which EU country has the least energy poverty?
- Finland, at 2.6% in 2025 — the coldest Member State in the Union with the smallest share of people unable to heat their homes. Estonia at 3.1% and Poland at 3.2% follow.
Methodological note
The indicator is Eurostat's share of the population unable to keep their home adequately warm, taken for all households regardless of income and for the total population rather than a poverty subgroup.
Values are for 2025, the most recent year with complete coverage of the 27 Member States at the extraction date.
The observation that four of the five worst-affected Member States are southern European, and the comparison between winter severity and the ranking, are derived by Silver Data Lab from the published rates. No climate data is used: the characterisation of countries as warm or cold is a description, not a variable in the analysis.
Source data
The underlying series can be inspected and re-downloaded from the Eurostat data browser. The filters below are the ones applied.
Inability to keep home adequately warm by poverty status
ilc_mdes01
- Filters applied:
- freq=A · hhcomp=TOTAL · rskpovth=TOTAL · unit=PC · time=2025
- Extracted:
- 2026-10-21
- Source last updated:
- 2026-10-20
Download the data
The data the study you have just read is built on, exactly as it was downloaded and archived.
Yours as a Member.
Data downloadable by Members
How to cite
Record the vintage as well as the study: the figures on this page are the ones extracted on the dates below.
Silver Data Lab Research Desk (2026). Greece Has the EU's Highest Share of People Who Cannot Afford Heating. Silver Data Lab, published 14 June 2026, last updated 11 October 2026. https://www.silverdatalab.com/studies/energy-poverty-in-the-eu
- Data: Eurostat, Inability to keep home adequately warm by poverty status (ilc_mdes01), filters freq=A, hhcomp=TOTAL, rskpovth=TOTAL, unit=PC, time=2025; extracted 2026-10-21; source last updated 2026-10-20. https://doi.org/10.2908/ilc_mdes01
Silver Data Lab's analysis is licensed CC BY 4.0. The statistics remain their publisher's and keep its terms of reuse.
Ask the research desk
A question about this study — a definition, a filter, a break in the series, what the figures can and cannot support — answered by the desk that made the extraction.
Members can write to the research desk
Other studies on the same dataset
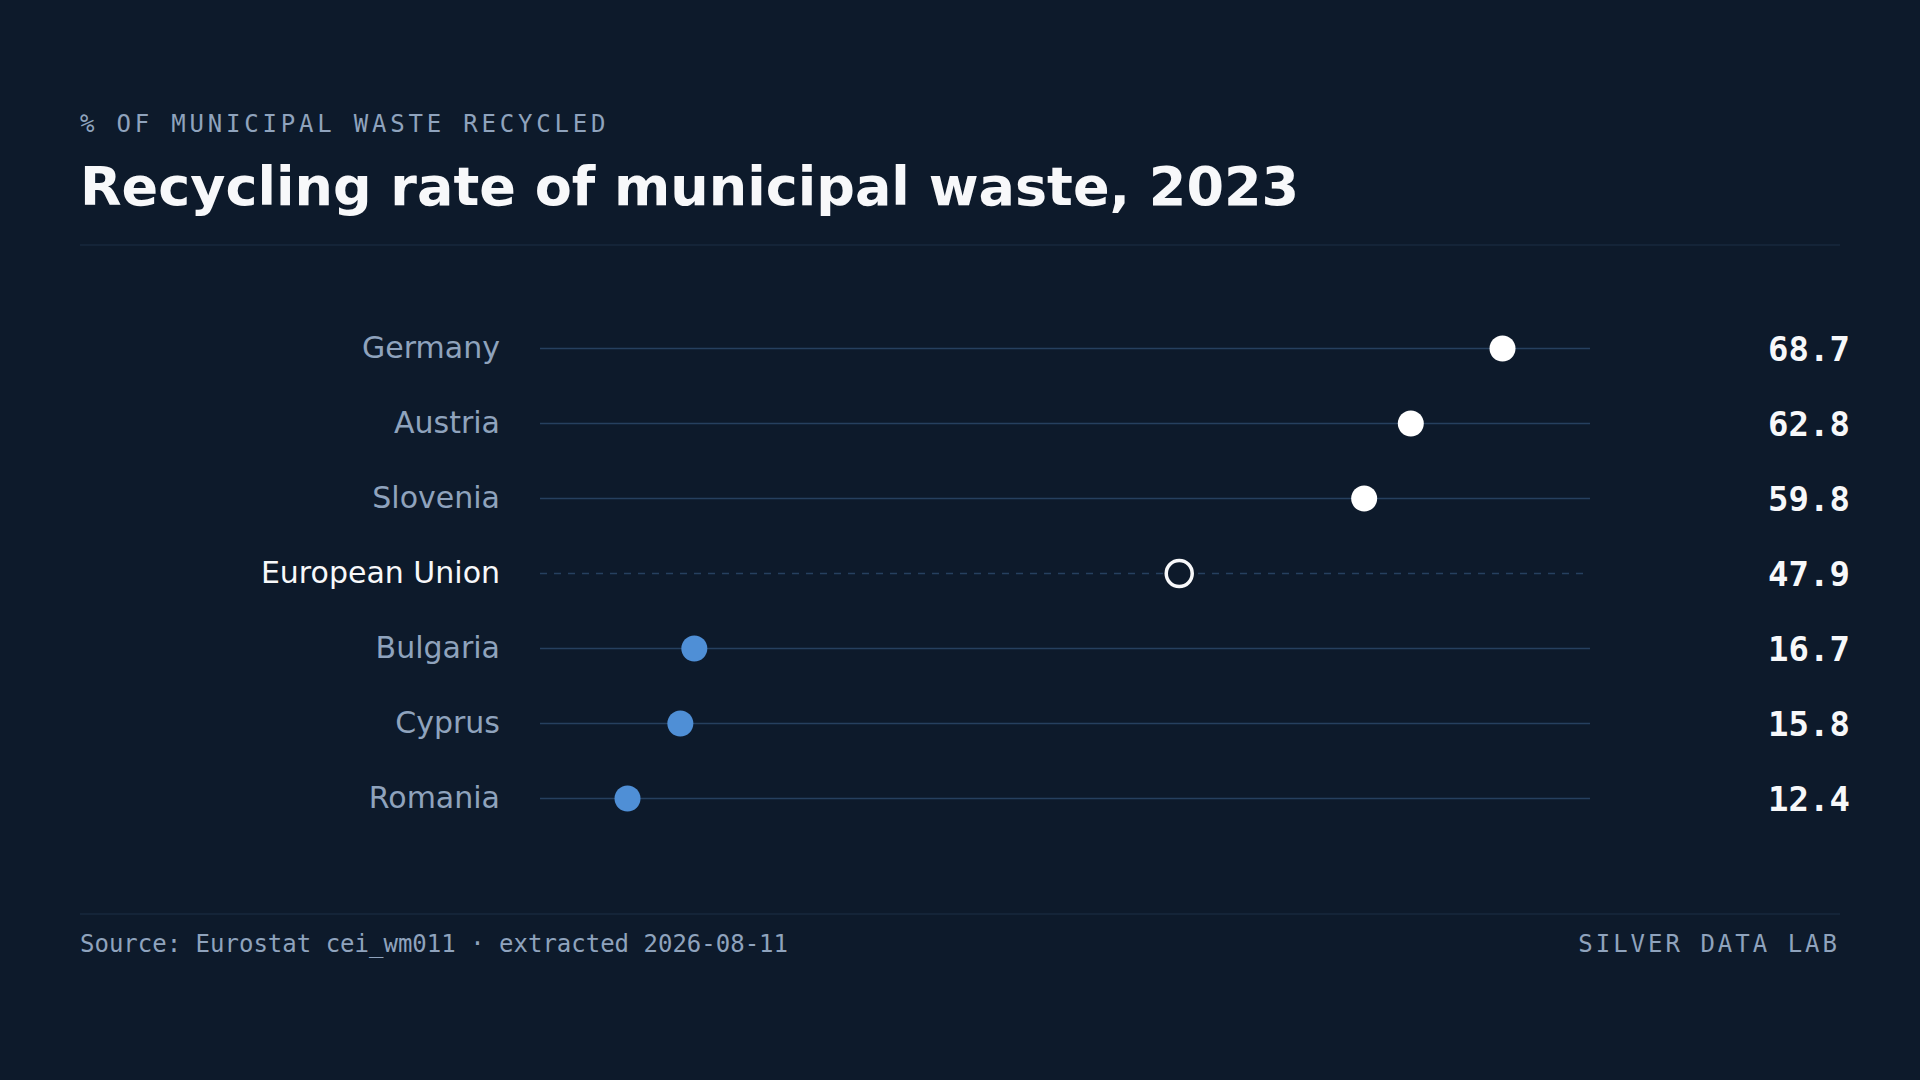
Germany's Recycling Rate Is 5.5 Times Romania's
The EU recycled 47.9% of its municipal waste in 2023, slightly under half.
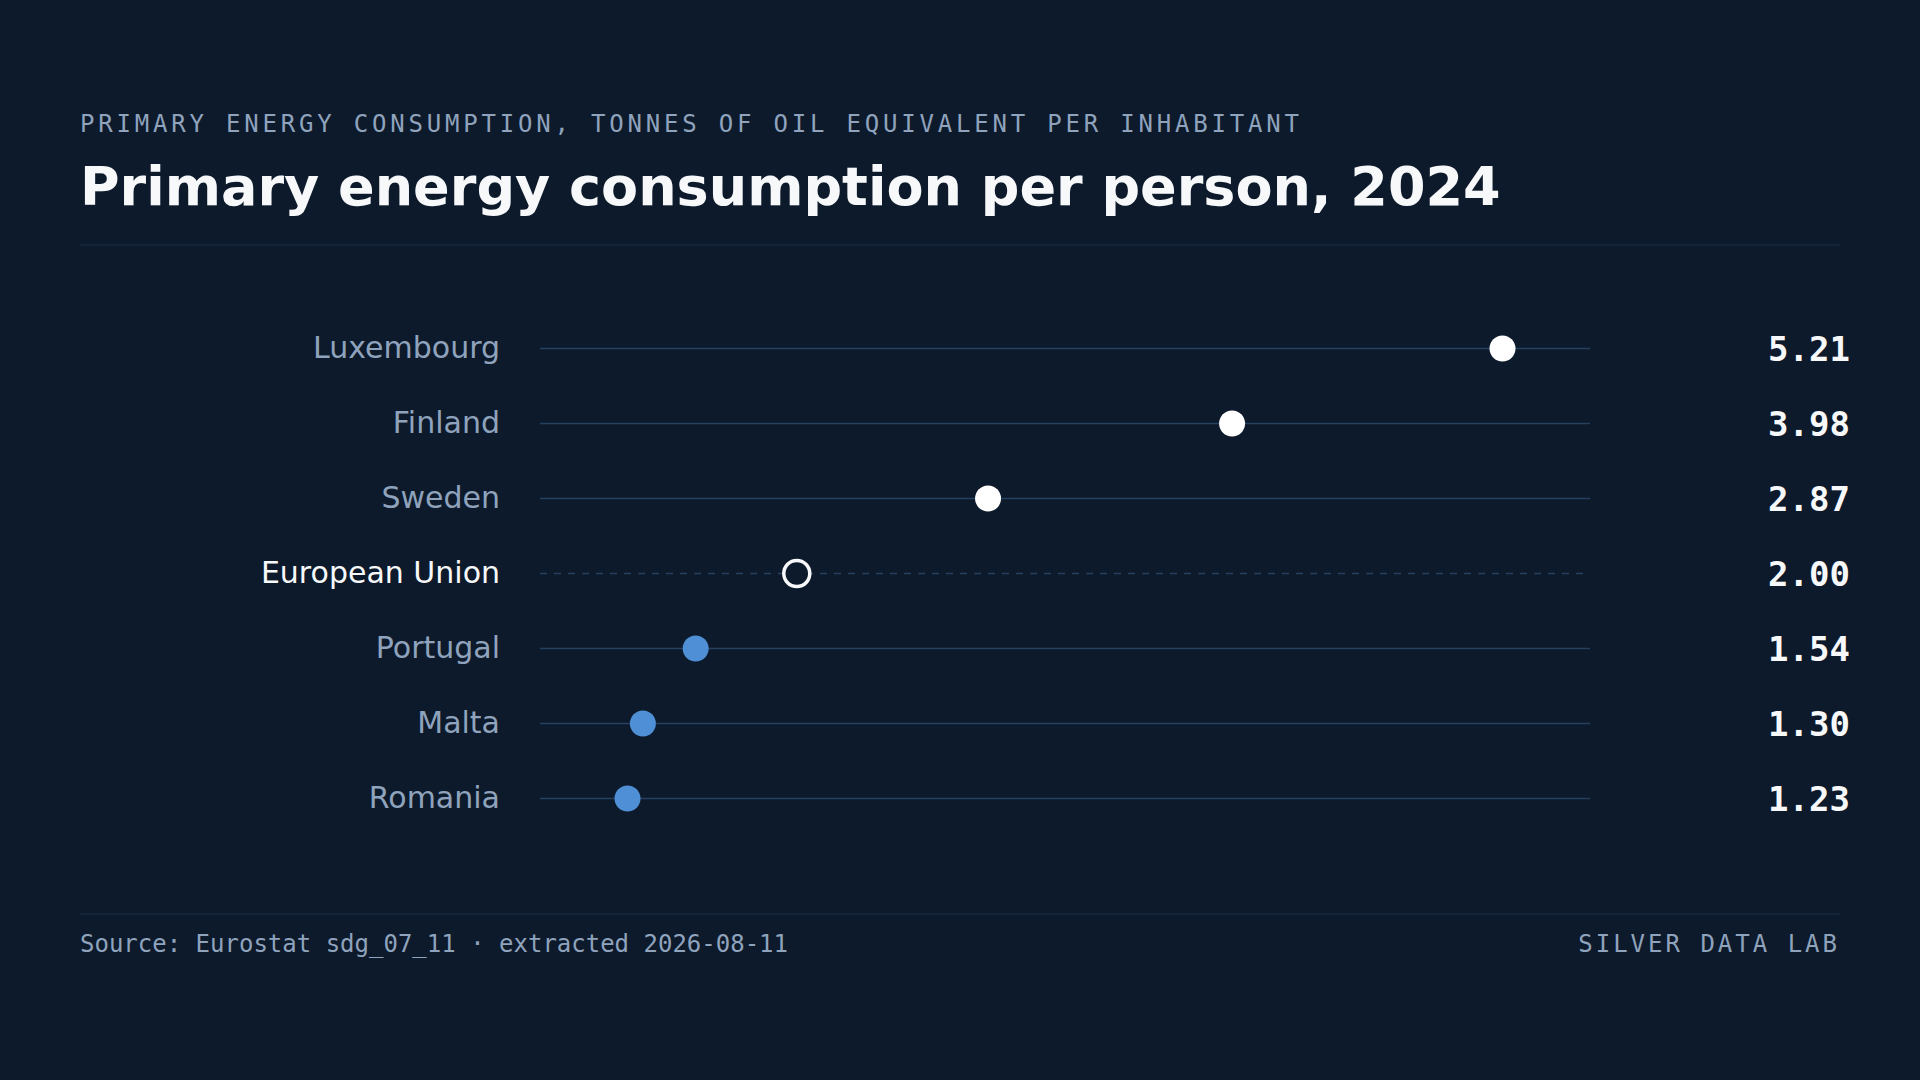
Romania Uses Less Energy per Person Than Any Other EU Country
The EU consumed 2.0 tonnes of oil equivalent per inhabitant in final energy in 2024.
Studies where the same country leads or trails
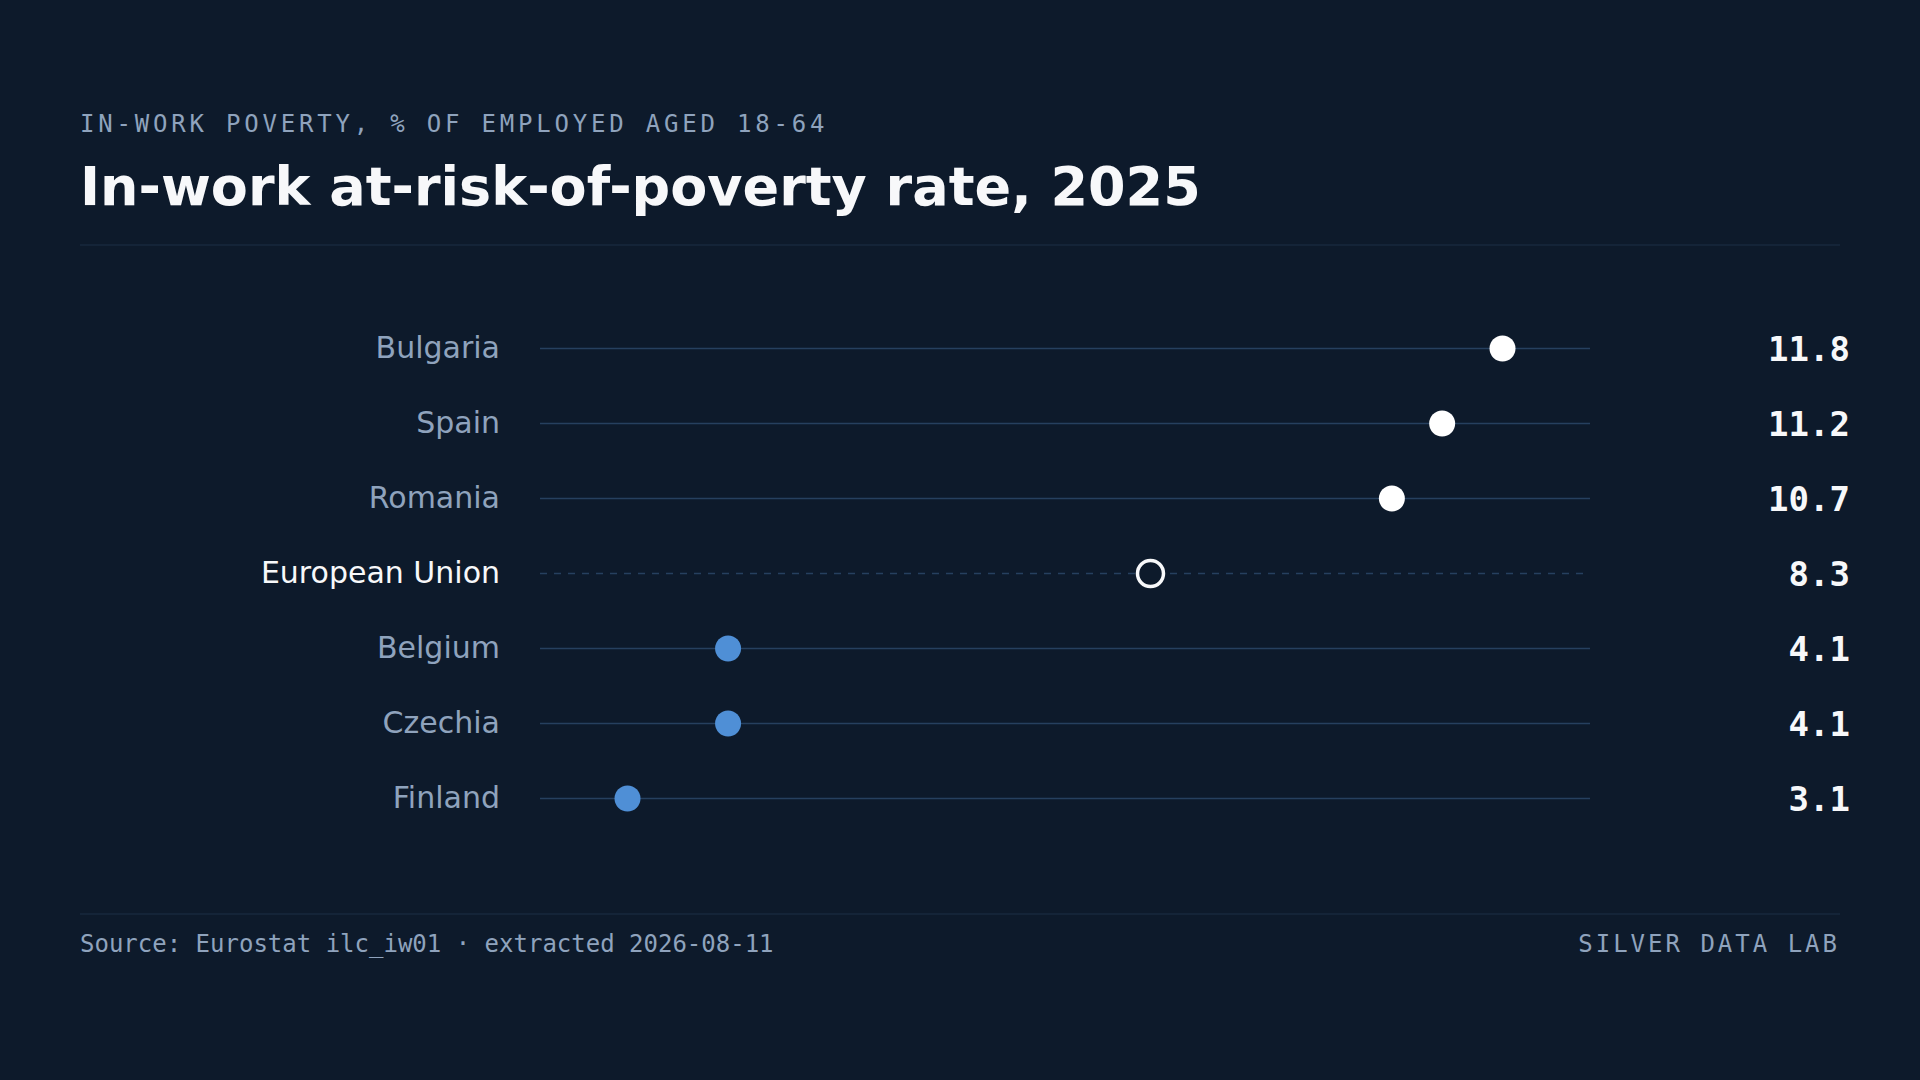
11.8% of Bulgarians With a Job Are Poor, the Highest Share in the EU
8.3% of employed people aged 18 to 64 in the EU lived below the at-risk-of-poverty line in 2025.
45.9% Fewer Children Sought Asylum Alone in the EU Than a Year Earlier
In 2025, 17,930 children applied for asylum in the EU without a parent or another adult responsible for them, against 33,160 in 2024: a derived fall of 45.9%, to the lowest figure since 2020.
A Quarter of Greeks Spend More Than 40% of Income on Housing
7.7% of the EU population spent more than 40% of disposable income on housing in 2025.