Romania Uses Less Energy per Person Than Any Other EU Country
Silver Data Lab Research Desk · Statistical analysis · Published on 24 July 2026
- Data source
- Eurostat
- Reference period
- 2024
- Last updated
- 19 October 2026
Re-checked against the source on 23 October 2026. 10 values in its datasets moved between snapshots, 1 of them figures stated on this page. Every revision we have observed →
Key estimates
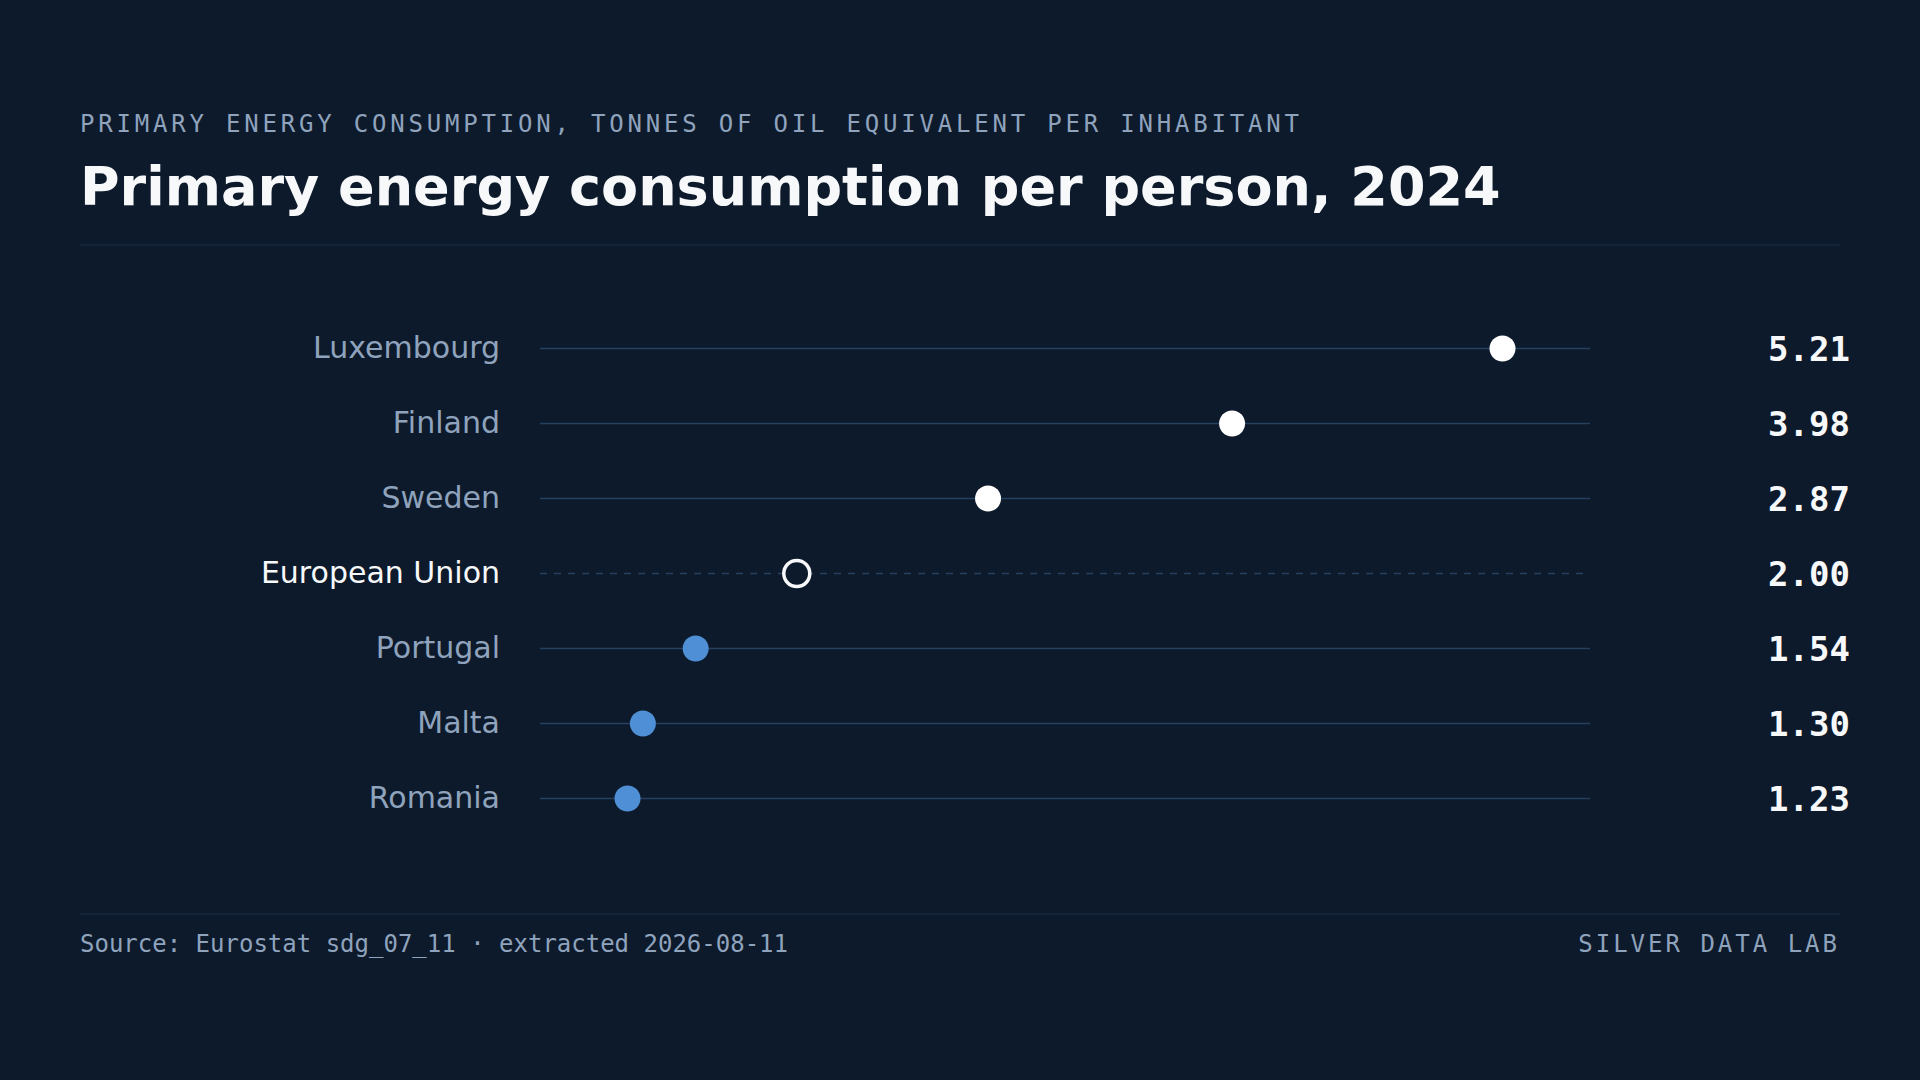
- The EU consumed 2.0 tonnes of oil equivalent per inhabitant in final energy in 2024.
- Luxembourg records 5.21, Finland 3.98 and Sweden 2.87.
- Romania records 1.23 and Malta 1.30; Bulgaria and Portugal are level at 1.54.
- The Luxembourg figure is 4.2 times the Romanian one.
- Thirteen Member States are above the EU average and fourteen below it.
Energy as it reaches the people using it
Final energy consumption counts the energy delivered to the people and firms that use it — industry, transport, households, services and agriculture — and stops there. It leaves out what the energy industries burn to do their own work, the heat lost in generating electricity, and what is lost again in moving energy to where it is wanted. It also leaves out energy carriers put to a use that is not energy, such as gas turned into chemicals.
For the EU in 2024 it was 2.0 tonnes of oil equivalent per inhabitant.
Luxembourg
Luxembourg records 5.21, more than two and a half times the EU average and the highest in the Union by a wide margin.
Part of that is genuine: Luxembourg is wealthy and cold in winter. Most of it is not about people living in Luxembourg at all.
Fuel sold in Luxembourg is consumed by drivers who live elsewhere. Excise duty is lower than in the neighbouring countries, so road fuel is bought there and burnt in Belgium, France and Germany. It is counted against an average population of 677,012 in 2024, taken from Eurostat's demographic balance and declared below, because that population is what this indicator divides by.
The country also hosts a large cross-border commuting workforce, whose energy use at work is Luxembourg's and whose residence is not. How large is not quantified here: no series this study declares measures cross-border commuting, and a figure for it would need an extraction of its own.
Per-capita energy figures for a small country with an open border and cheaper fuel do not measure what they appear to measure.
Finland and Sweden
Finland records 3.98 and Sweden 2.87.
These are the figures that do reflect real conditions. Both have long cold winters, energy-intensive forest and metal industries, low population density and long distances. The regional density extraction declared below puts Övre Norrland in northern Sweden at 3.5 inhabitants per square kilometre, Mellersta Norrland at 5.3 and Pohjois- ja Itä-Suomi, in northern and eastern Finland, at 6.2.
Finland is also the Member State with the lowest share of people unable to keep their home adequately warm, at 2.6% in 2025. High energy consumption and low energy poverty sit together here: Finland is near the top of this ranking and at the bottom of that one. Final energy counts industry and transport as well as homes, so the two figures are not two readings of one quantity.
The low end
Romania records 1.23 and Malta 1.30. Bulgaria and Portugal are level at 1.54, so four Member States share the three lowest places.
Mild winters explain part of it. Income explains part of it, but less than this end of the ranking suggests. Real GDP per head for the same year was extracted for this comparison and is declared below. Across the Union as a whole the two orders match closely: on a rank correlation, where one means they are identical and zero that they are unrelated, they score 0.72. Among the fourteen Member States below the EU average they score 0.22.
Romania and Bulgaria are the Union's two poorest Member States on that measure, and both sit near the bottom here. Malta is the case that does not follow: the second-lowest energy consumer in the Union is eleventh of the twenty-seven on GDP per head.
Malta and Portugal are the Mediterranean cases, where mild winters lower the heating a home needs.
Reading it as a sustainability measure
Low energy consumption per head is not automatically a good outcome, and this is where the indicator needs care.
Romania consumes little energy and records the Union's second-highest rate of material and social deprivation, 26.8% in 2025 against the EU's 12.0%. Portugal consumes little and has mild winters — and yet 15.6% of people there could not keep their home adequately warm that year, against 8.8% across the Union, the fifth-highest share of the twenty-seven. The two hardship series, both declared below, do not rank the same countries: Portugal is eleventh on the first and fifth on the second. Low consumption at this end of the ranking is not one thing: it can be a mild climate, a household that cannot afford more, or both at once.
Dividing by population is what makes countries of different sizes comparable, and it is also what makes the result turn on industrial structure and climate. The indicator measures neither efficiency nor sufficiency directly, and a fall in it can mean a more efficient economy or a smaller one.
Final energy consumption per person, 2024
| Country | tonnes of oil equivalent per inhabitant | Gap to EU averagederived |
|---|---|---|
| Luxembourg | 5.21 | +3.2 |
| Finland | 3.98 | +2.0 |
| Sweden | 2.87 | +0.9 |
| European Unionaggregate | 2.00ep | — |
| Portugal | 1.54 | −0.5 |
| Malta | 1.30 | −0.7 |
| Romania | 1.23e | −0.8 |
Flags carried by the source on these values: e estimated · ep estimated, provisional
This table as data: CSV · JSON
Every Member State for this indicator+
Members see every Member State for this indicator here, not only the rows the ranking prints. Become a Member
Embed this chart
Paste this code into a page. The frame carries the source and the extraction date, and links back to the study.
What these figures cannot tell you
- Cross-border fuel sales distort small countries
- Energy is counted where it is sold. Luxembourg's figure includes road fuel bought there and burnt abroad, and the energy use of a commuting workforce that lives outside its borders. Its position is largely an artefact of geography and fuel duty.
- Final, not primary energy
- The measure counts energy reaching end users and excludes both the energy sector's own consumption and the losses in transforming and distributing energy, so the heat a power station discards is not counted against the country that discards it. A country that imports its electricity and one that generates the same electricity at home therefore sit closer together here than they would on a measure taken earlier in the chain. France records 1.90 on this measure, below the EU's 2.0, on a value Eurostat flags as provisional; what it would record on a measure of primary energy is not shown by this series and is not stated here.
- Low consumption is not necessarily good
- Romania's low figure reflects low incomes as much as efficiency, and it coexists with high material deprivation. That holds for Romania rather than for the bottom of the ranking as a whole: among the Member States below the EU average, income barely tells you where a country sits on this ranking.
- Per person, not per unit of output
- The indicator divides by population. Energy used per unit of economic activity is a different measure, not reported here and free to move the other way: a country with heavy industry or long winters records more energy per inhabitant without being any less efficient.
- Romania's value is an estimate
- Eurostat flags Romania's 1.23 as estimated and the EU figure of 2.0 as estimated and provisional. Romania sits 0.07 tonnes below Malta, under six per cent of its own figure, so the order at the bottom of this ranking rests on a value the source has not observed directly.
Frequently asked questions
- How much energy does the average European use?
- 2.0 tonnes of oil equivalent per inhabitant in final energy in 2024. National figures range from 5.21 in Luxembourg to 1.23 in Romania.
- Why is Luxembourg's energy consumption so high?
- Because energy is counted where it is sold. Fuel duty in Luxembourg is lower than in its neighbours, so road fuel is bought there and burnt in Belgium, France and Germany, and is counted against an average population of 677,012. A large cross-border commuting workforce adds to the same effect.
- Which EU countries genuinely use the most energy?
- Finland at 3.98 and Sweden at 2.87 tonnes of oil equivalent per inhabitant. Both have long cold winters, energy-intensive forest and metal industries, and very low population density in their northern regions.
- Is low energy consumption a good sign?
- Not automatically. Romania and Bulgaria consume little partly because they are the Union's two poorest Member States, but income orders the bottom of this ranking only loosely: Malta is the second-lowest consumer and eleventh of the twenty-seven on GDP per head. And the indicator does not measure efficiency, which is energy per unit of economic activity rather than per person.
Methodological note
Eurostat publishes final energy consumption in tonnes of oil equivalent per inhabitant: the energy delivered to end users, excluding the energy sector's own consumption, the losses in transformation and distribution, and all non-energy uses of energy carriers.
Values are for 2024, the most recent year with complete coverage of the 27 Member States at the extraction date.
The counts of Member States above and below the EU average, the ratio between the highest and lowest, the margin between Romania and Malta, Malta's position on GDP per head, the identification of Romania and Bulgaria as the two lowest on it, and the positions of Romania and Portugal on the two hardship series are derived by Silver Data Lab. Luxembourg's average population for 2024 comes from Eurostat's demographic balance, extracted separately and declared below, because a per-inhabitant construction makes the denominator part of what the figure means. The explanation of the Luxembourg figure by cross-border fuel sales and commuting is offered as a well-established characteristic of that market rather than as a finding from this extraction, and the size of the commuting flow is deliberately not quantified: no series declared here measures it. The two hardship rates and the regional densities come from three further extractions declared below, the same files the companion studies on this site read. They measure different things and are not interchangeable: one counts people who cannot keep their home adequately warm, the other a broader set of things a household cannot afford. The comparison with income uses real GDP per head for 2024, extracted to match this indicator's year, and the two rank correlations are computed by Silver Data Lab across the 27 Member States and across the 14 below the EU average. They are reported as a correspondence between two orders and nothing more: neither series is said to cause the other.
Source data
This study draws on 6 datasets from Eurostat. Each can be inspected and re-downloaded from its catalogue, and the filters below are the ones applied.
Final energy consumption
sdg_07_11
- Filters applied:
- freq=A · unit=TOE_HAB · time=2024
- Extracted:
- 2026-10-01
- Source last updated:
- 2026-09-30
Population change — demographic balance, average population
demo_gind
- Filters applied:
- freq=A · indic_de=AVG · time=2024
- Extracted:
- 2026-10-01
- Source last updated:
- 2026-09-30
Inability to keep home adequately warm by poverty status
ilc_mdes01
- Filters applied:
- freq=A · hhcomp=TOTAL · rskpovth=TOTAL · unit=PC · time=2025
- Extracted:
- 2026-10-21
- Source last updated:
- 2026-10-20
Material and social deprivation rate by age and sex
ilc_mdsd07
- Filters applied:
- freq=A · age=TOTAL · sex=T · unit=PC · time=2025
- Extracted:
- 2026-10-21
- Source last updated:
- 2026-10-20
Population density by region
demo_r_d3dens
- Filters applied:
- freq=A · unit=PER_KM2 · time=2024
- Extracted:
- 2026-08-11
- Source last updated:
- 2026-02-25
Real GDP per capita
sdg_08_10
- Filters applied:
- freq=A · unit=CLV20_EUR_HAB · na_item=B1GQ · time=2024
- Extracted:
- 2026-10-23
- Source last updated:
- 2026-10-22
Download the data
The data the study you have just read is built on, exactly as it was downloaded and archived.
Yours as a Member.
Data downloadable by Members
How to cite
Record the vintage as well as the study: the figures on this page are the ones extracted on the dates below.
Silver Data Lab Research Desk (2026). Romania Uses Less Energy per Person Than Any Other EU Country. Silver Data Lab, published 24 July 2026, last updated 19 October 2026. https://www.silverdatalab.com/studies/energy-consumption-in-the-eu
- Data: Eurostat, Final energy consumption (sdg_07_11), filters freq=A, unit=TOE_HAB, time=2024; extracted 2026-10-01; source last updated 2026-09-30. https://doi.org/10.2908/sdg_07_11
- Data: Eurostat, Population change — demographic balance, average population (demo_gind), filters freq=A, indic_de=AVG, time=2024; extracted 2026-10-01; source last updated 2026-09-30. https://doi.org/10.2908/demo_gind
- Data: Eurostat, Inability to keep home adequately warm by poverty status (ilc_mdes01), filters freq=A, hhcomp=TOTAL, rskpovth=TOTAL, unit=PC, time=2025; extracted 2026-10-21; source last updated 2026-10-20. https://doi.org/10.2908/ilc_mdes01
- Data: Eurostat, Material and social deprivation rate by age and sex (ilc_mdsd07), filters freq=A, age=TOTAL, sex=T, unit=PC, time=2025; extracted 2026-10-21; source last updated 2026-10-20. https://doi.org/10.2908/ilc_mdsd07
- Data: Eurostat, Population density by region (demo_r_d3dens), filters freq=A, unit=PER_KM2, time=2024; extracted 2026-08-11; source last updated 2026-02-25. https://doi.org/10.2908/demo_r_d3dens
- Data: Eurostat, Real GDP per capita (sdg_08_10), filters freq=A, unit=CLV20_EUR_HAB, na_item=B1GQ, time=2024; extracted 2026-10-23; source last updated 2026-10-22. https://doi.org/10.2908/sdg_08_10
Silver Data Lab's analysis is licensed CC BY 4.0. The statistics remain their publisher's and keep its terms of reuse.
Ask the research desk
A question about this study — a definition, a filter, a break in the series, what the figures can and cannot support — answered by the desk that made the extraction.
Members can write to the research desk
Other studies on the same dataset
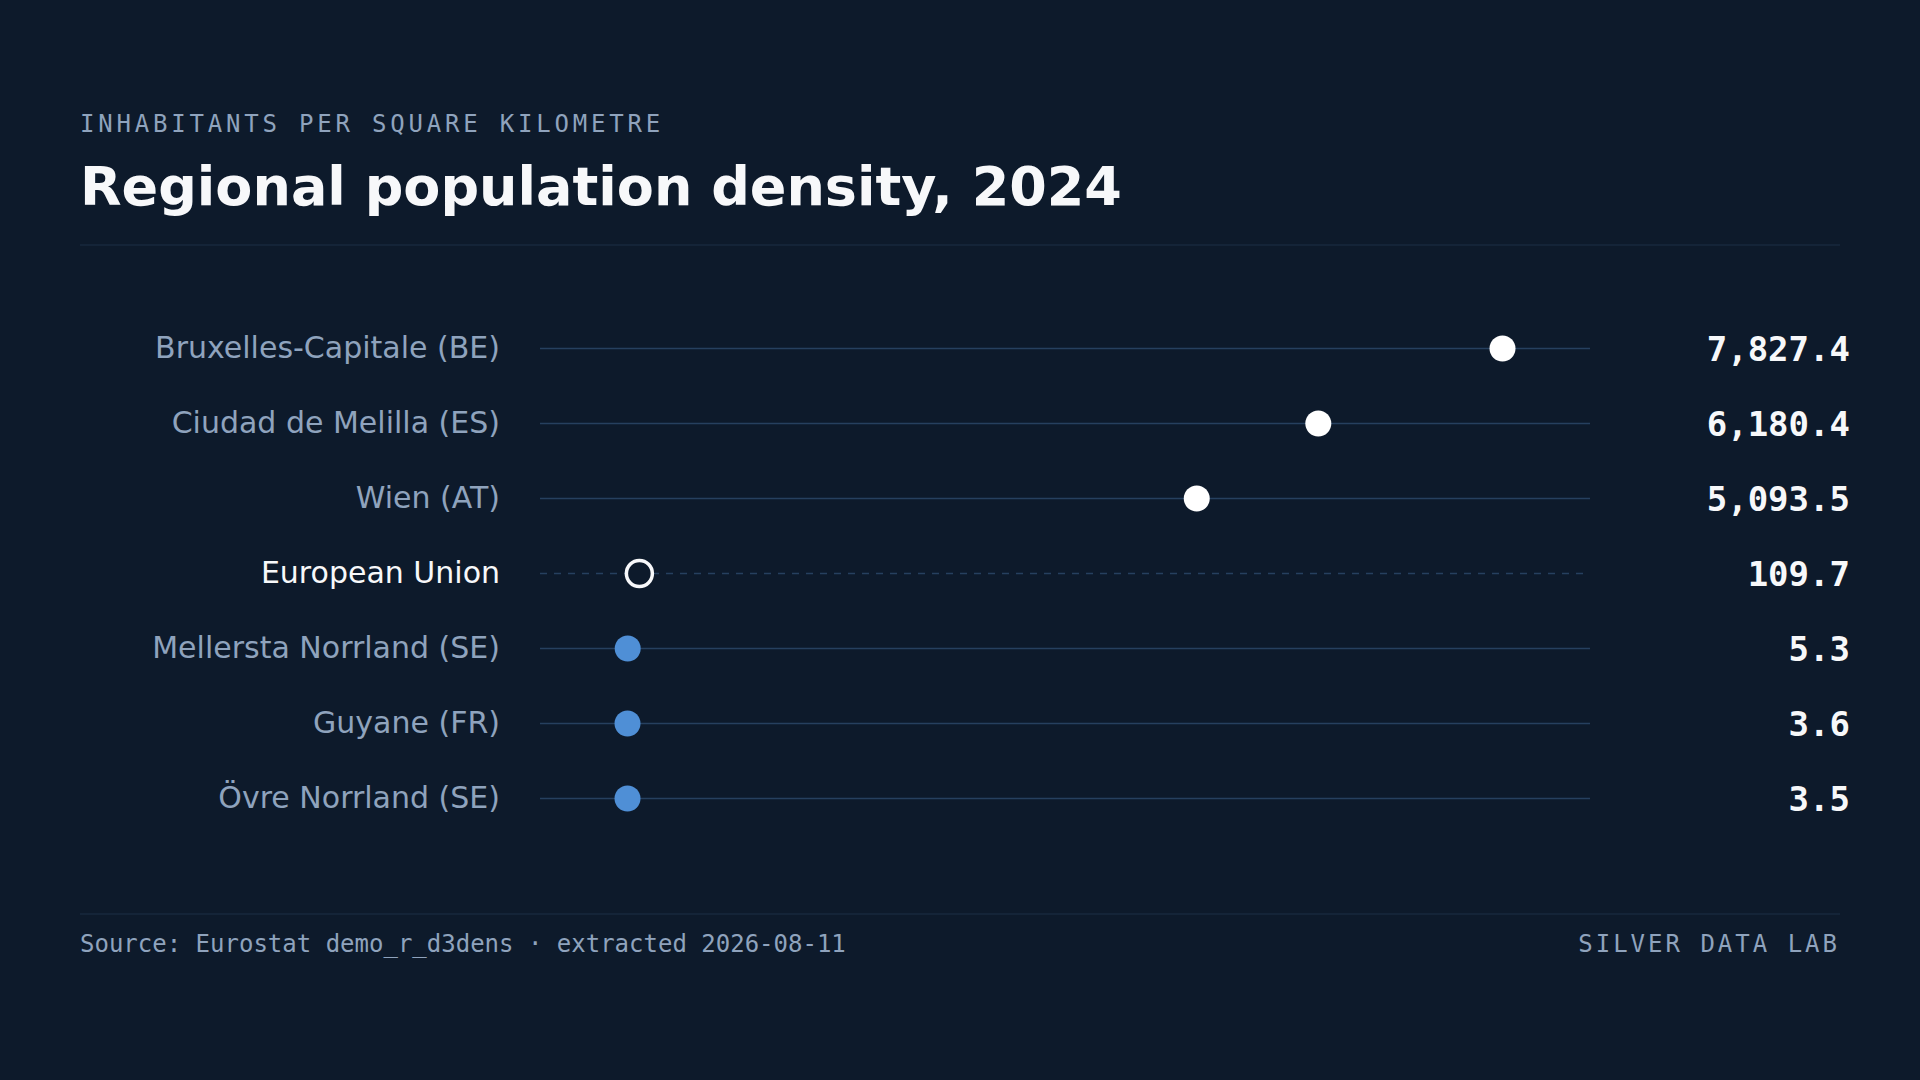
Brussels Is 2,200 Times More Crowded Than Northern Sweden
The EU averages 109.7 inhabitants per square kilometre.
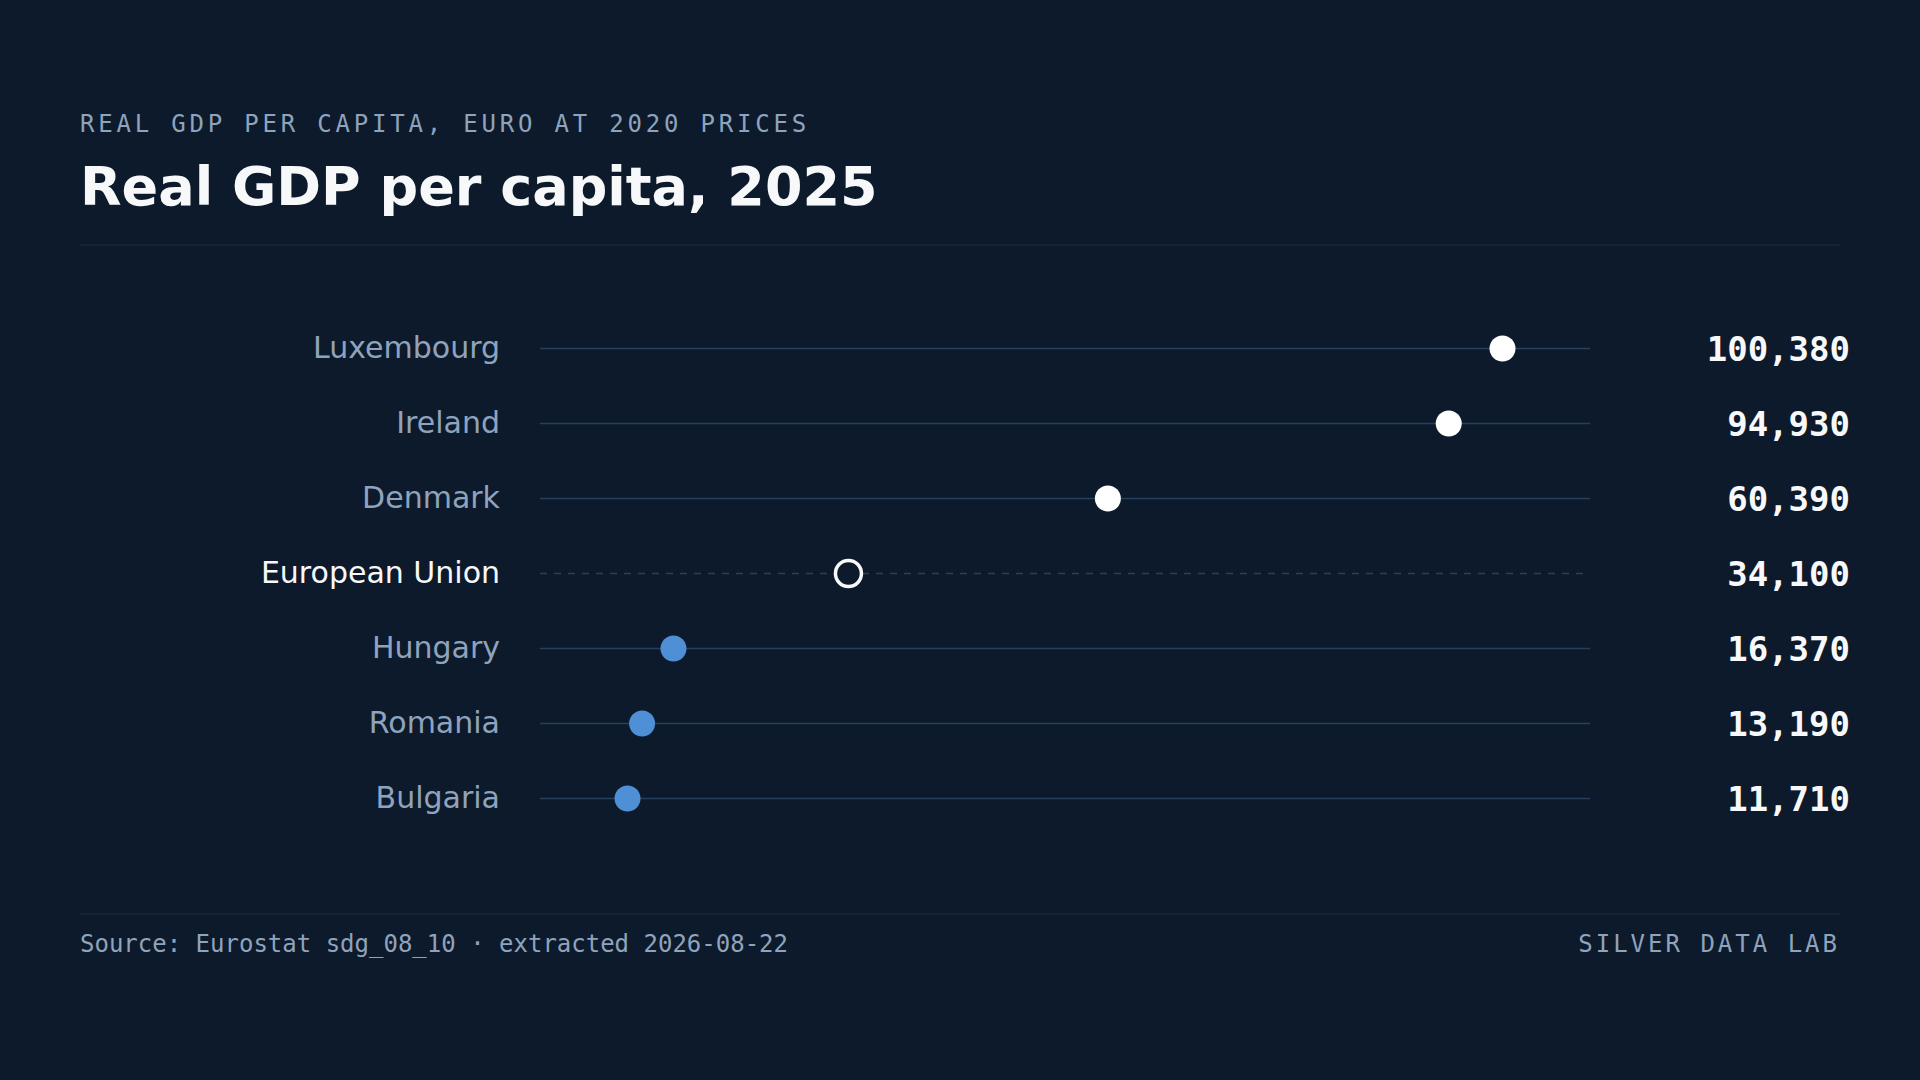
Bulgaria's GDP per Person Is About a Third of the EU Average
EU real GDP per capita was 34,250 euro in 2025, at 2020 prices.
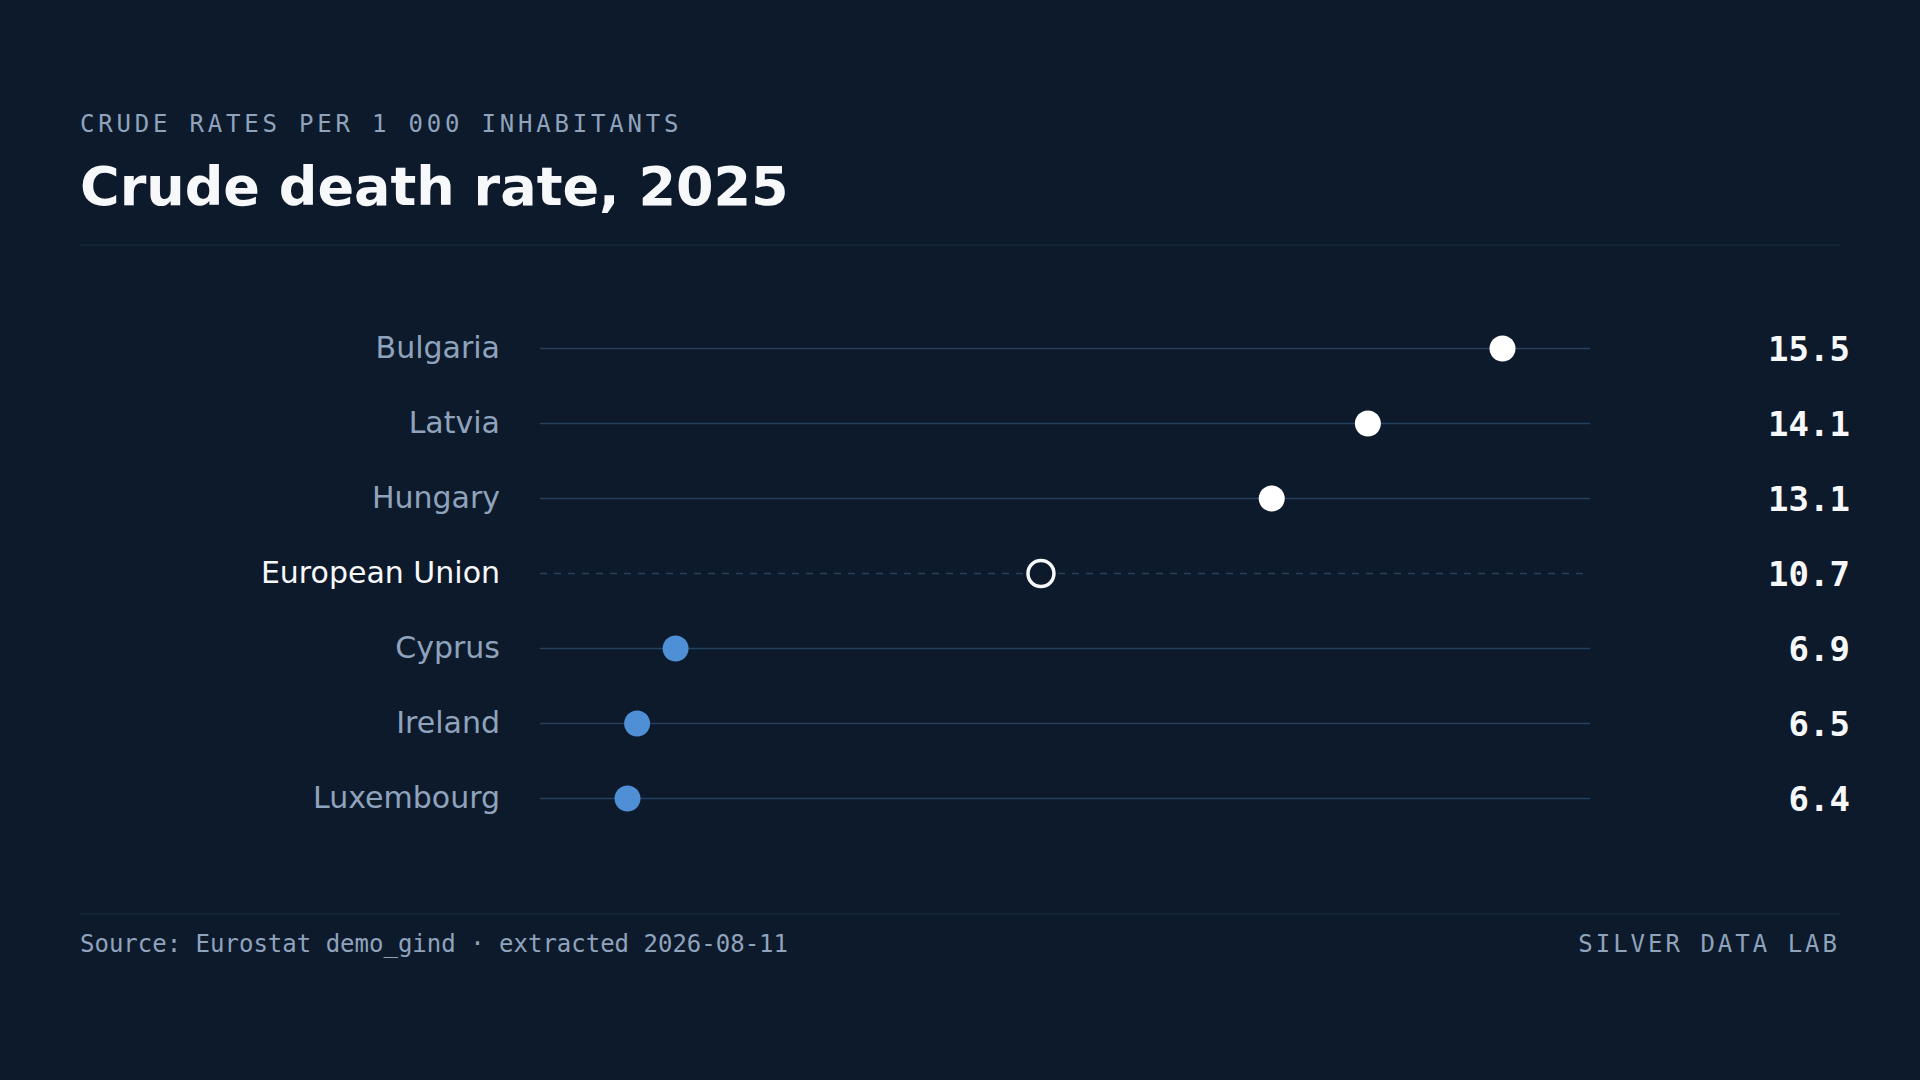
Deaths Outnumber Births in Twenty-One EU Countries
The EU recorded 7.7 births and 10.7 deaths per thousand inhabitants in 2025: a natural change of −3.0.
Studies where the same country leads or trails
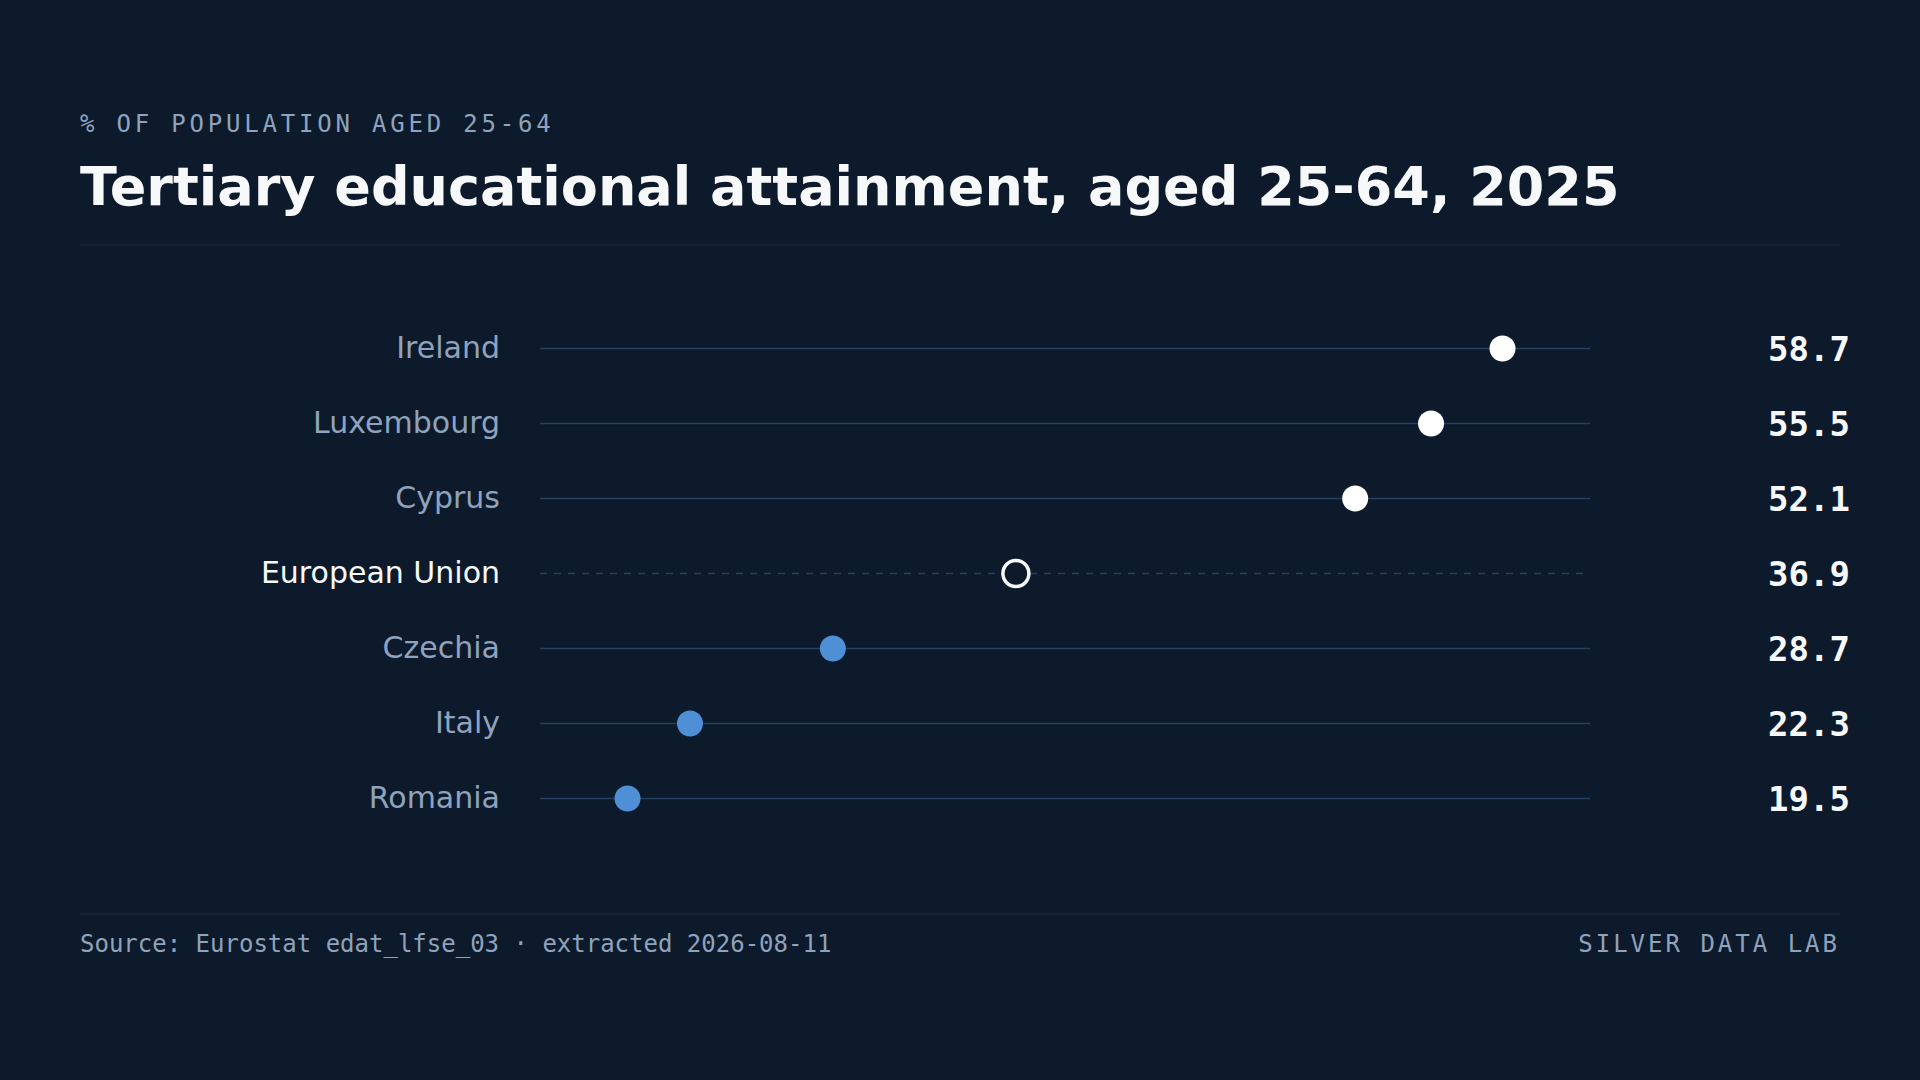
A Degree Is Three Times as Common Among Adults in Ireland as in Romania
36.9% of people aged 25 to 64 in the EU held a tertiary qualification in 2025.
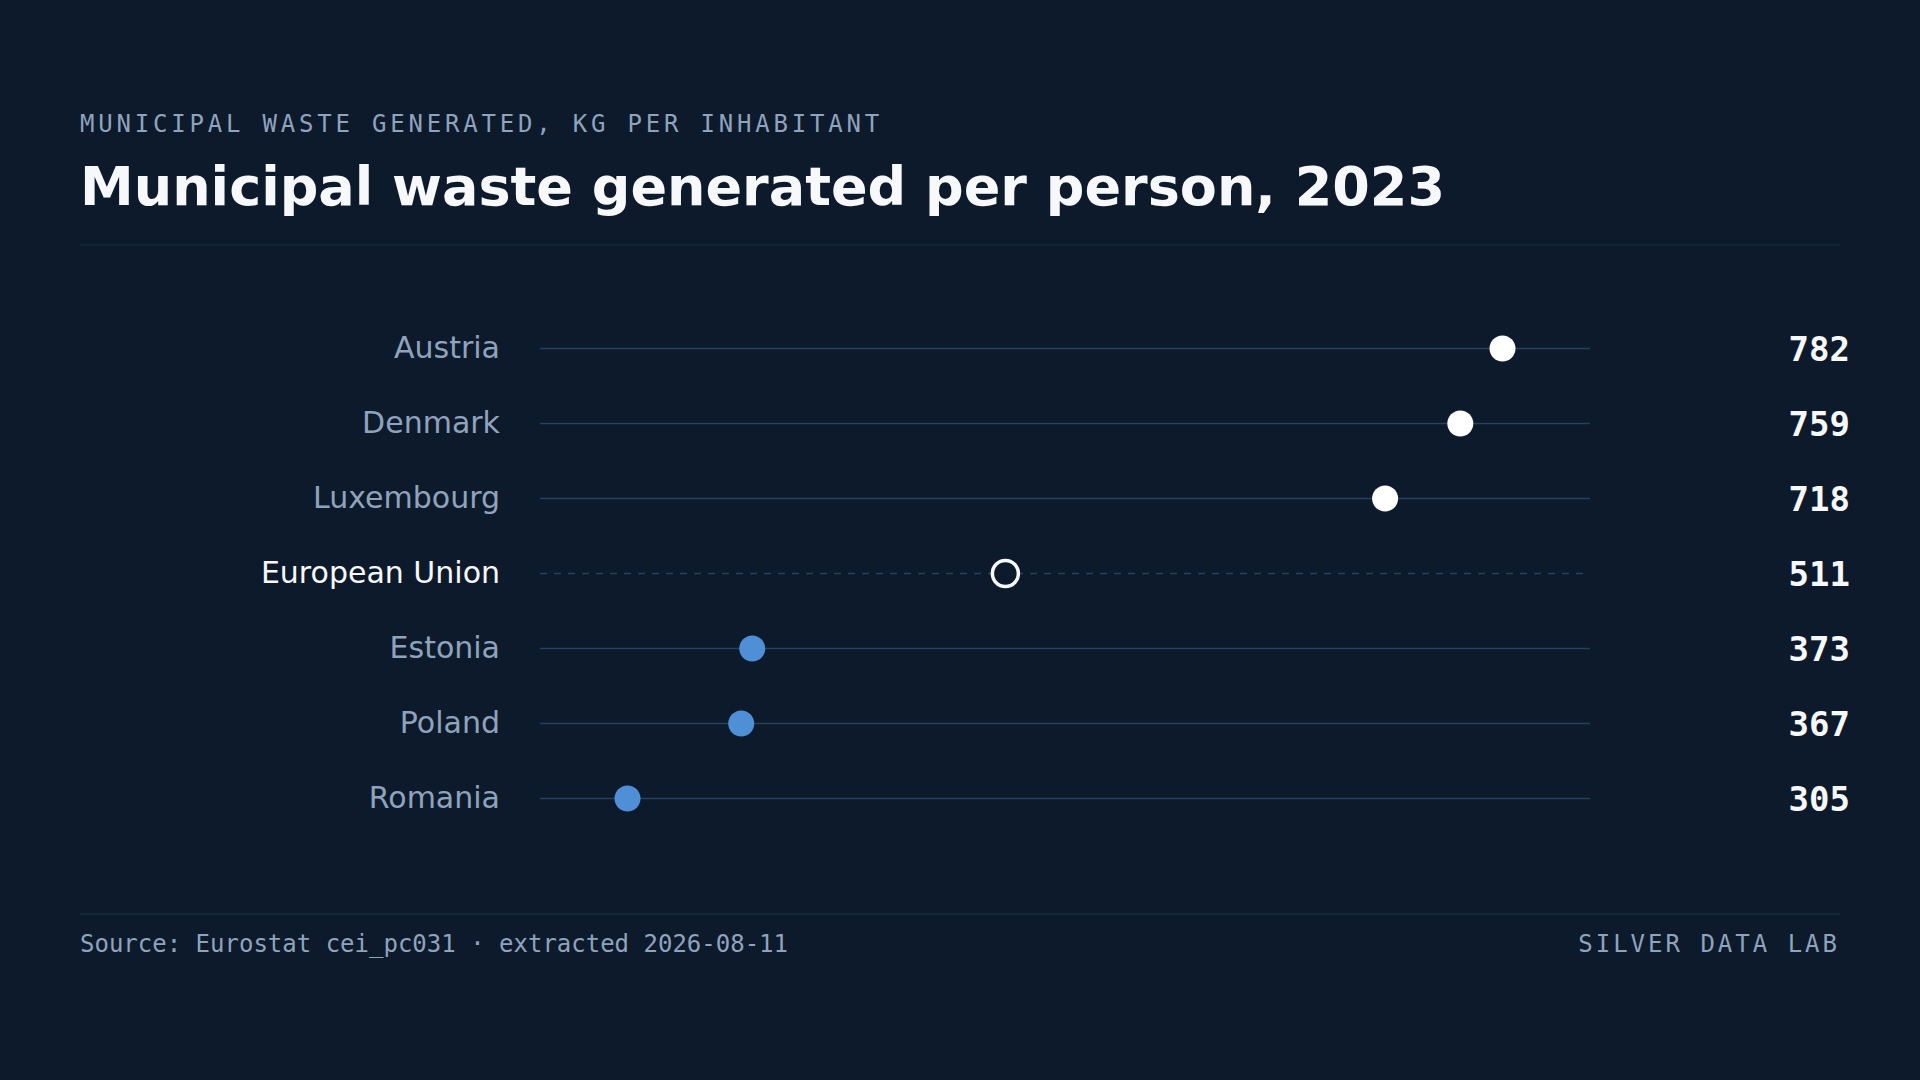
Austria Produces More Rubbish per Person Than Any Other EU Country
The EU generated 510 kg of municipal waste per inhabitant in 2023 — about 1.4 kg per person per day.
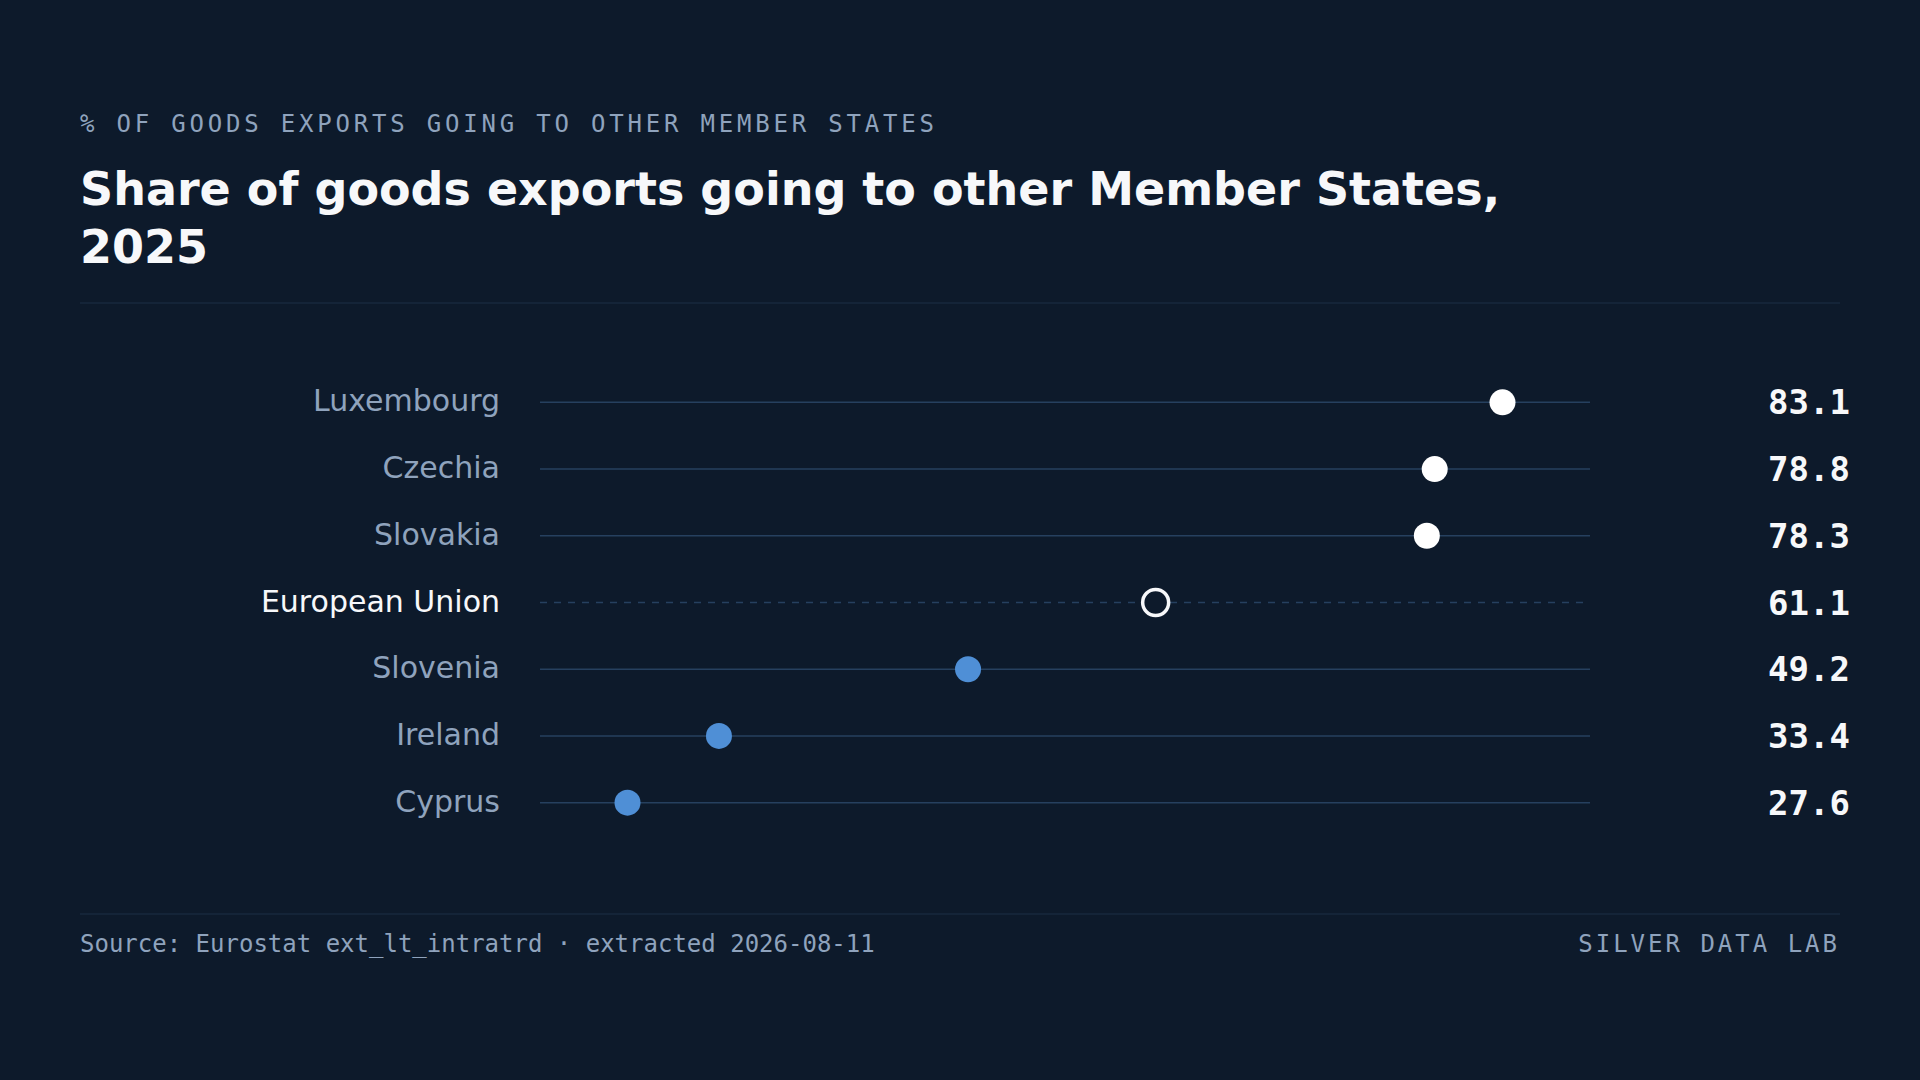
EU Countries Sell 61.1% of Their Goods Exports to Each Other
61.1% of the goods exported by EU Member States in 2025 went to other Member States.