A Degree Is Three Times as Common Among Adults in Ireland as in Romania
Silver Data Lab Research Desk · Statistical analysis · Published on 14 June 2026
- Data source
- Eurostat
- Reference period
- 2025
- Last updated
- 11 October 2026
Re-checked against the source on 11 September 2026. 1 values in its datasets moved between snapshots, 1 of them figures stated on this page. Every revision we have observed →
Key estimates
- 36.9% of people aged 25 to 64 in the EU held a tertiary qualification in 2025.
- Ireland records 58.7%, the highest in the Union, ahead of Luxembourg at 55.7% and Cyprus at 52.1%.
- Romania records 19.5% and Italy 22.3% — the two lowest in the Union.
- Italy is the only one of the EU's four largest economies below 30%.
- Eight Member States are above 45% and four below 30%.
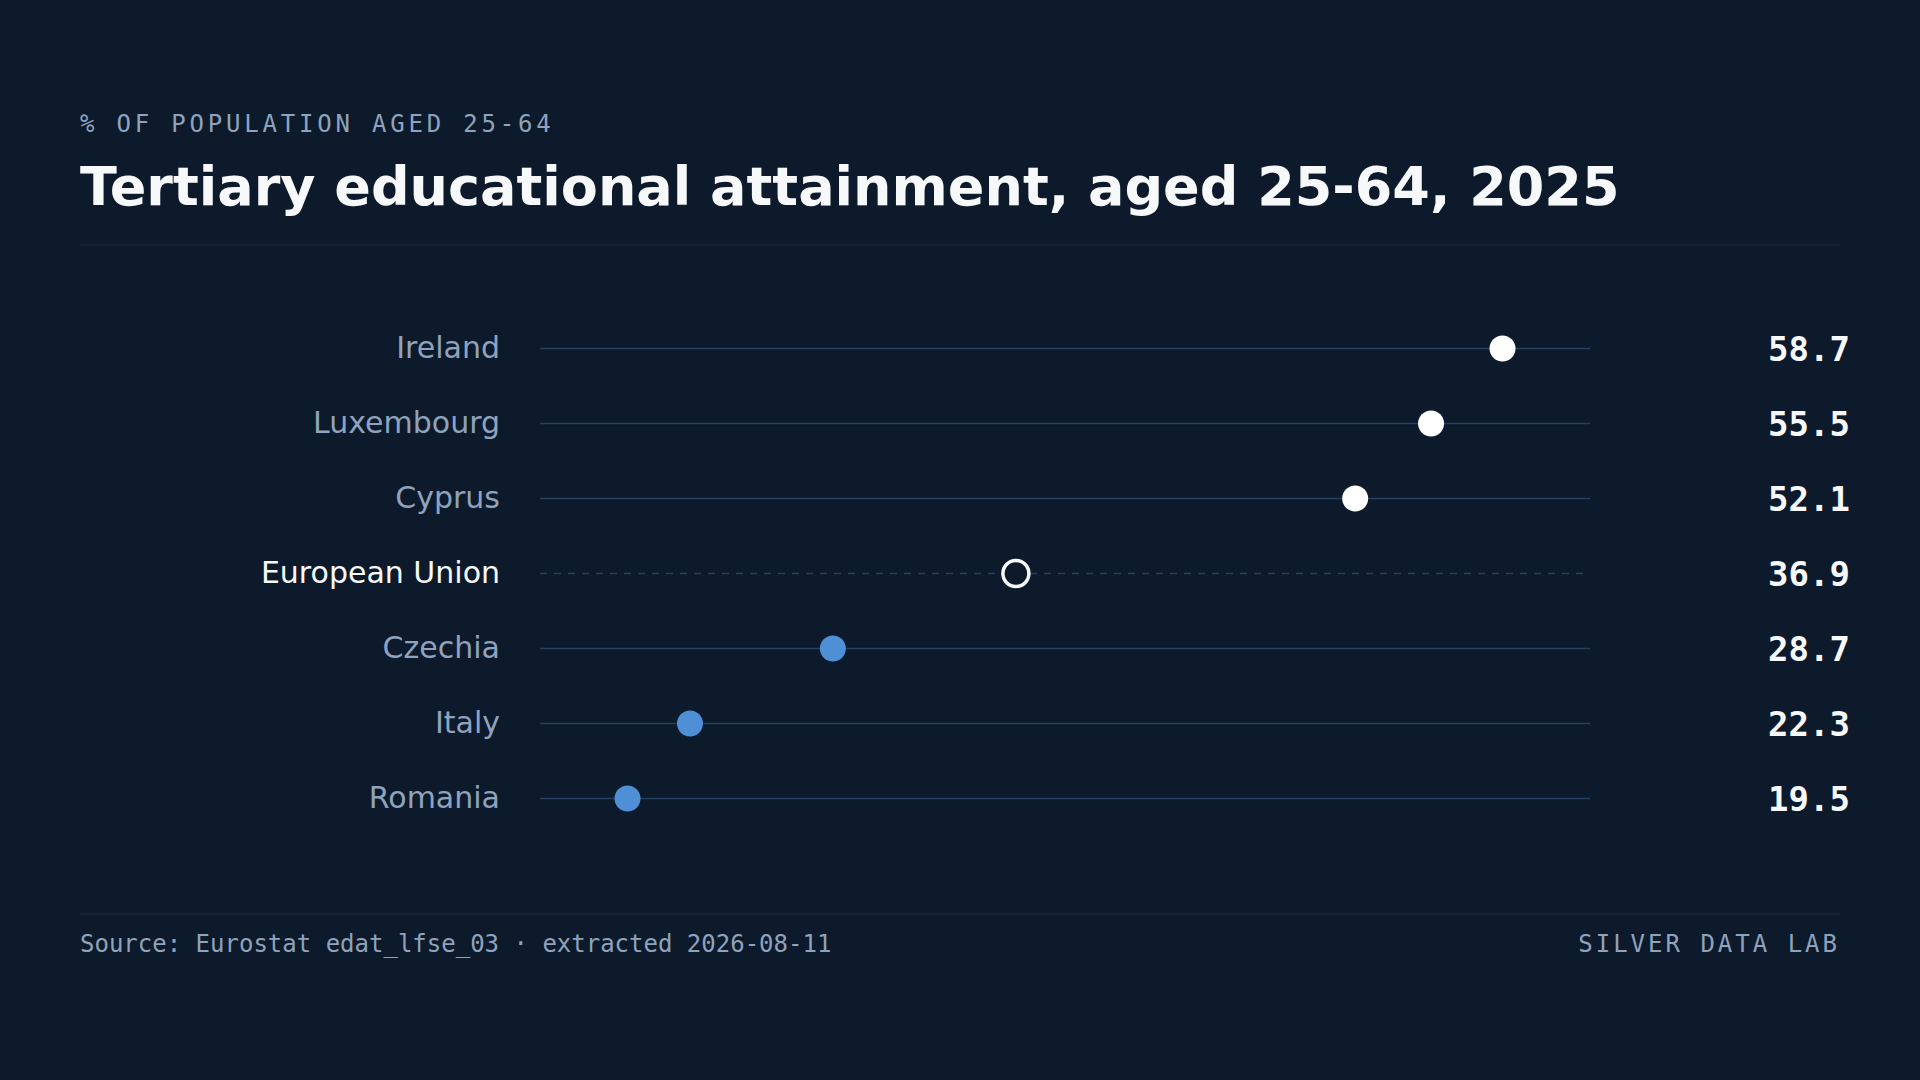
A qualification level, measured across four decades of adults
Tertiary attainment counts the share of people aged 25 to 64 holding a qualification above upper secondary level: a degree, or an equivalent higher vocational qualification. Because the age band spans forty years, the figure describes decades of past education policy rather than the current output of a school system.
Across the EU, 36.9% of that population held such a qualification in 2025.
The top of the ranking
Ireland records 58.7%, the highest in the Union — close to three adults in five. Luxembourg follows at 55.7%, Cyprus at 52.1%, Sweden at 50.8% and Lithuania at 49.9%.
Lithuania in fifth place is the observation that separates this ranking from a ranking of income. It records a higher graduate share than Denmark, the Netherlands, France or Germany, on a GDP per capita of 87 against the EU's 100.
The bottom, and Italy
Romania records 19.5%, the lowest in the Union, and Italy 22.3%.
Italy is the finding. It is the Union's third-largest economy, its GDP per capita sits at 96 on the EU index, and fewer than a quarter of its working-age adults hold a tertiary qualification — a lower share than Bulgaria at 35.7%, Poland at 40.0% or Latvia at 40.7%.
Czechia at 28.7% and Slovakia at 29.8% complete the group below 30%. Both have strong upper-secondary vocational systems, which is a structural explanation available to them and less available to Italy.
Why the measure is slow
An adult who left education in 1985 counts in the 2025 figure. A country that expanded higher education twenty years ago is still adding those cohorts to its stock, and a country that expands it today will not see the effect in this indicator for decades.
That makes tertiary attainment a poor measure of current education policy and a good measure of accumulated position. For the current output of education systems, early school leaving and the attainment of younger age bands are the appropriate indicators, and they are published separately.
Tertiary educational attainment, aged 25-64, 2025
| Country | % of population aged 25-64 | Gap to EU averagepercentage points, derived |
|---|---|---|
| Ireland | 58.7 | +21.8 |
| Luxembourg | 55.7 | +18.8 |
| Cyprus | 52.1 | +15.2 |
| European Unionaggregate | 36.9 | — |
| Czechia | 28.7 | −8.2 |
| Italy | 22.3 | −14.6 |
| Romania | 19.5 | −17.4 |
This table as data: CSV · JSON
Every Member State for this indicator+
Members see every Member State for this indicator here, not only the rows the ranking prints. Become a Member
Embed this chart
Paste this code into a page. The frame carries the source and the extraction date, and links back to the study.
What these figures cannot tell you
- A stock, not a flow
- The measure covers everyone aged 25 to 64, so it reflects education decisions taken up to forty years ago. It cannot show whether a country's current education system is improving.
- Tertiary is not only university
- ISCED levels 5 to 8 include short-cycle higher vocational qualifications as well as degrees. Member States differ in how much of their post-secondary provision falls inside that boundary, which affects comparability.
- Attainment is not skill
- Holding a qualification and possessing the competences it implies are different things, and this indicator measures only the first. Adult skill surveys measure the second and rank countries differently.
- Migration moves the figure
- A country receiving highly qualified migrants raises its attainment rate without educating anyone, and one losing graduates lowers it. Ireland and Luxembourg both have large foreign-born populations in high-skill employment.
Frequently asked questions
- What share of Europeans have a university degree?
- 36.9% of people aged 25 to 64 held a tertiary qualification in 2025. The measure covers short-cycle higher vocational qualifications as well as degrees, so it is broader than university graduation alone.
- Which EU country has the most graduates?
- Ireland, at 58.7% of adults aged 25 to 64 in 2025, ahead of Luxembourg at 55.7% and Cyprus at 52.1%.
- Which EU country has the fewest graduates?
- Romania, at 19.5% in 2025, followed by Italy at 22.3%. Italy is the only one of the Union's four largest economies below 30%.
- Does this measure current education policy?
- No. The age band spans forty years, so the figure reflects decisions taken decades ago. Early school leaving and attainment among younger cohorts are the indicators for current performance.
Methodological note
Tertiary educational attainment is published by Eurostat as the share of the population aged 25 to 64 whose highest completed level is ISCED 5 to 8, covering short-cycle tertiary, bachelor, master and doctoral qualifications.
Values are for 2025, the most recent year with complete coverage of the 27 Member States at the extraction date.
The comparisons with GDP per capita draw on the companion study in the economy and finance category, which uses a separate extraction.
Source data
The underlying series can be inspected and re-downloaded from the Eurostat data browser. The filters below are the ones applied.
Population by educational attainment level
edat_lfse_03
- Filters applied:
- freq=A · sex=T · age=Y25-64 · isced11=ED5-8 · unit=PC · time=2025
- Extracted:
- 2026-09-11
- Source last updated:
- 2026-09-10
Download the data
The data the study you have just read is built on, exactly as it was downloaded and archived.
Yours as a Member.
Data downloadable by Members
How to cite
Record the vintage as well as the study: the figures on this page are the ones extracted on the dates below.
Silver Data Lab Research Desk (2026). A Degree Is Three Times as Common Among Adults in Ireland as in Romania. Silver Data Lab, published 14 June 2026, last updated 11 October 2026. https://www.silverdatalab.com/studies/tertiary-education-in-the-eu
- Data: Eurostat, Population by educational attainment level (edat_lfse_03), filters freq=A, sex=T, age=Y25-64, isced11=ED5-8, unit=PC, time=2025; extracted 2026-09-11; source last updated 2026-09-10. https://doi.org/10.2908/edat_lfse_03
Silver Data Lab's analysis is licensed CC BY 4.0. The statistics remain their publisher's and keep its terms of reuse.
Ask the research desk
A question about this study — a definition, a filter, a break in the series, what the figures can and cannot support — answered by the desk that made the extraction.
Members can write to the research desk
Studies where the same country leads or trails
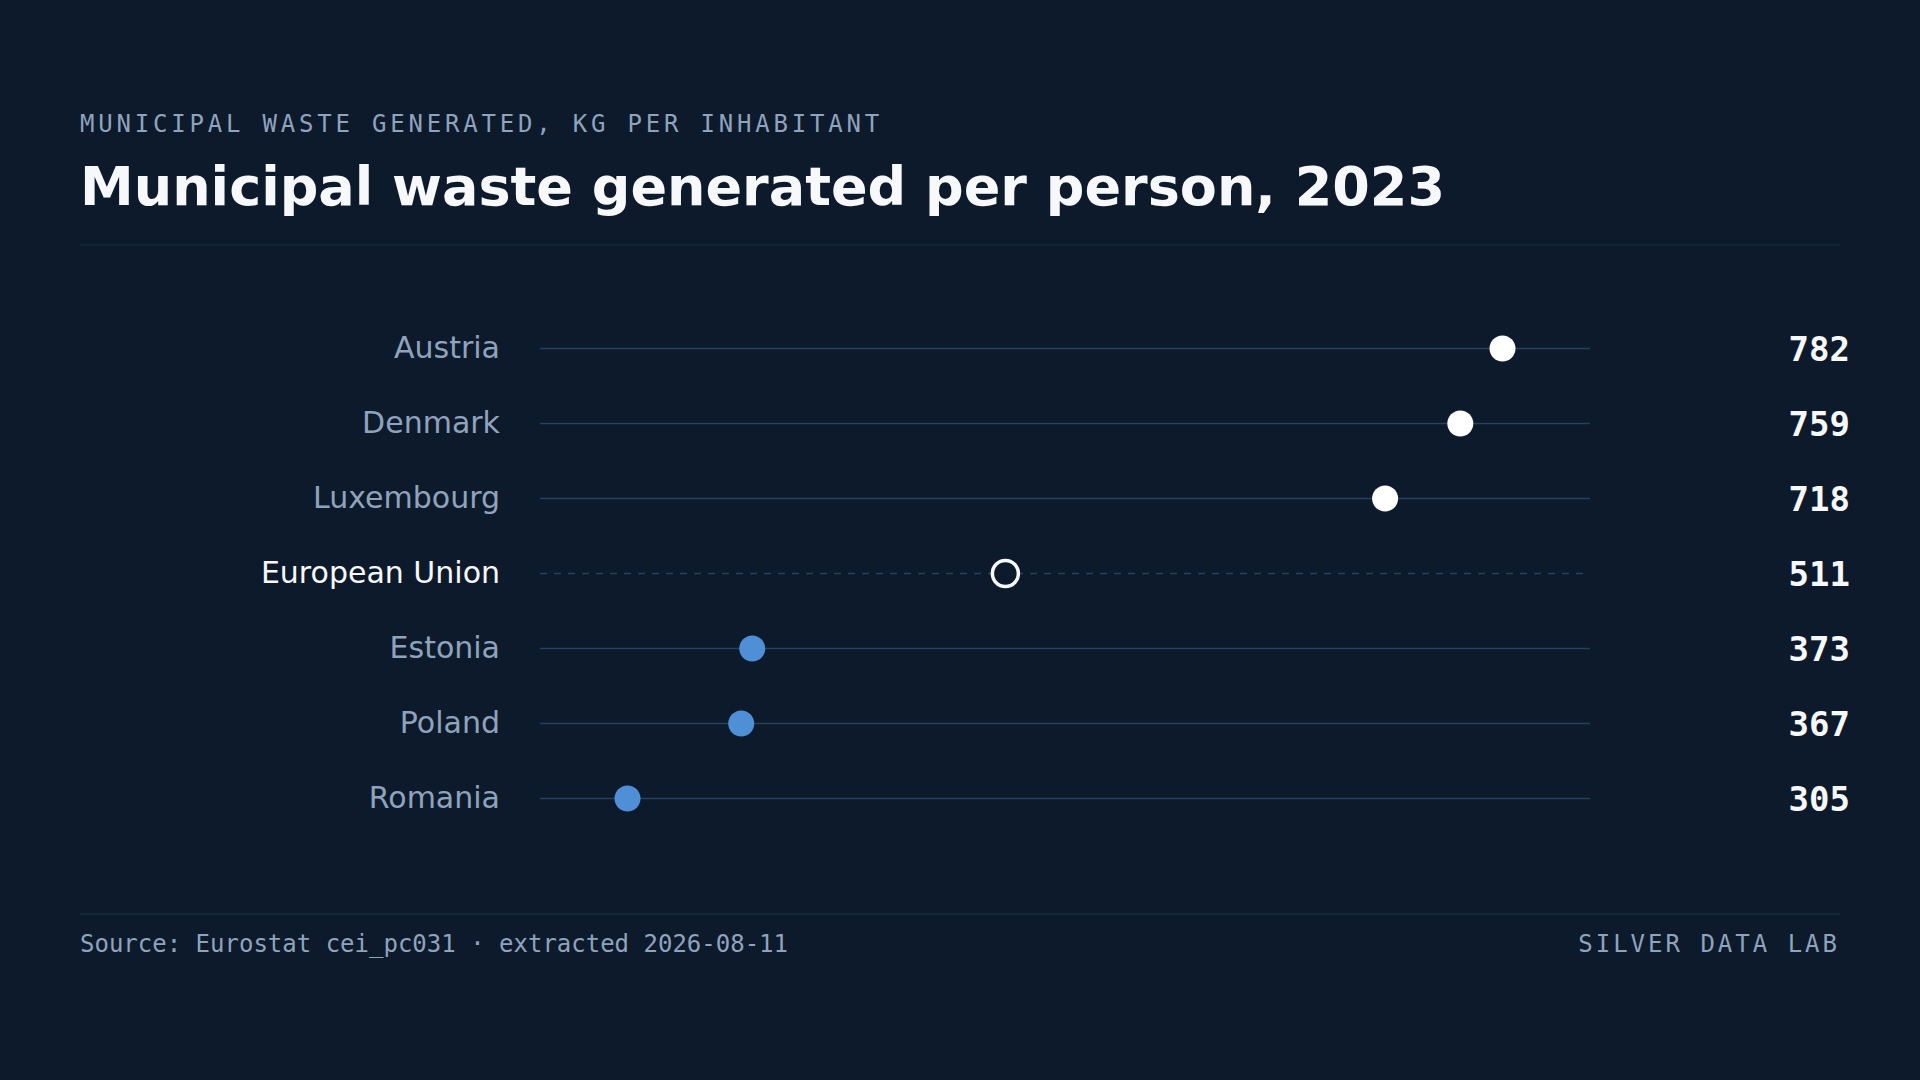
Austria Produces More Rubbish per Person Than Any Other EU Country
The EU generated 510 kg of municipal waste per inhabitant in 2023 — about 1.4 kg per person per day.
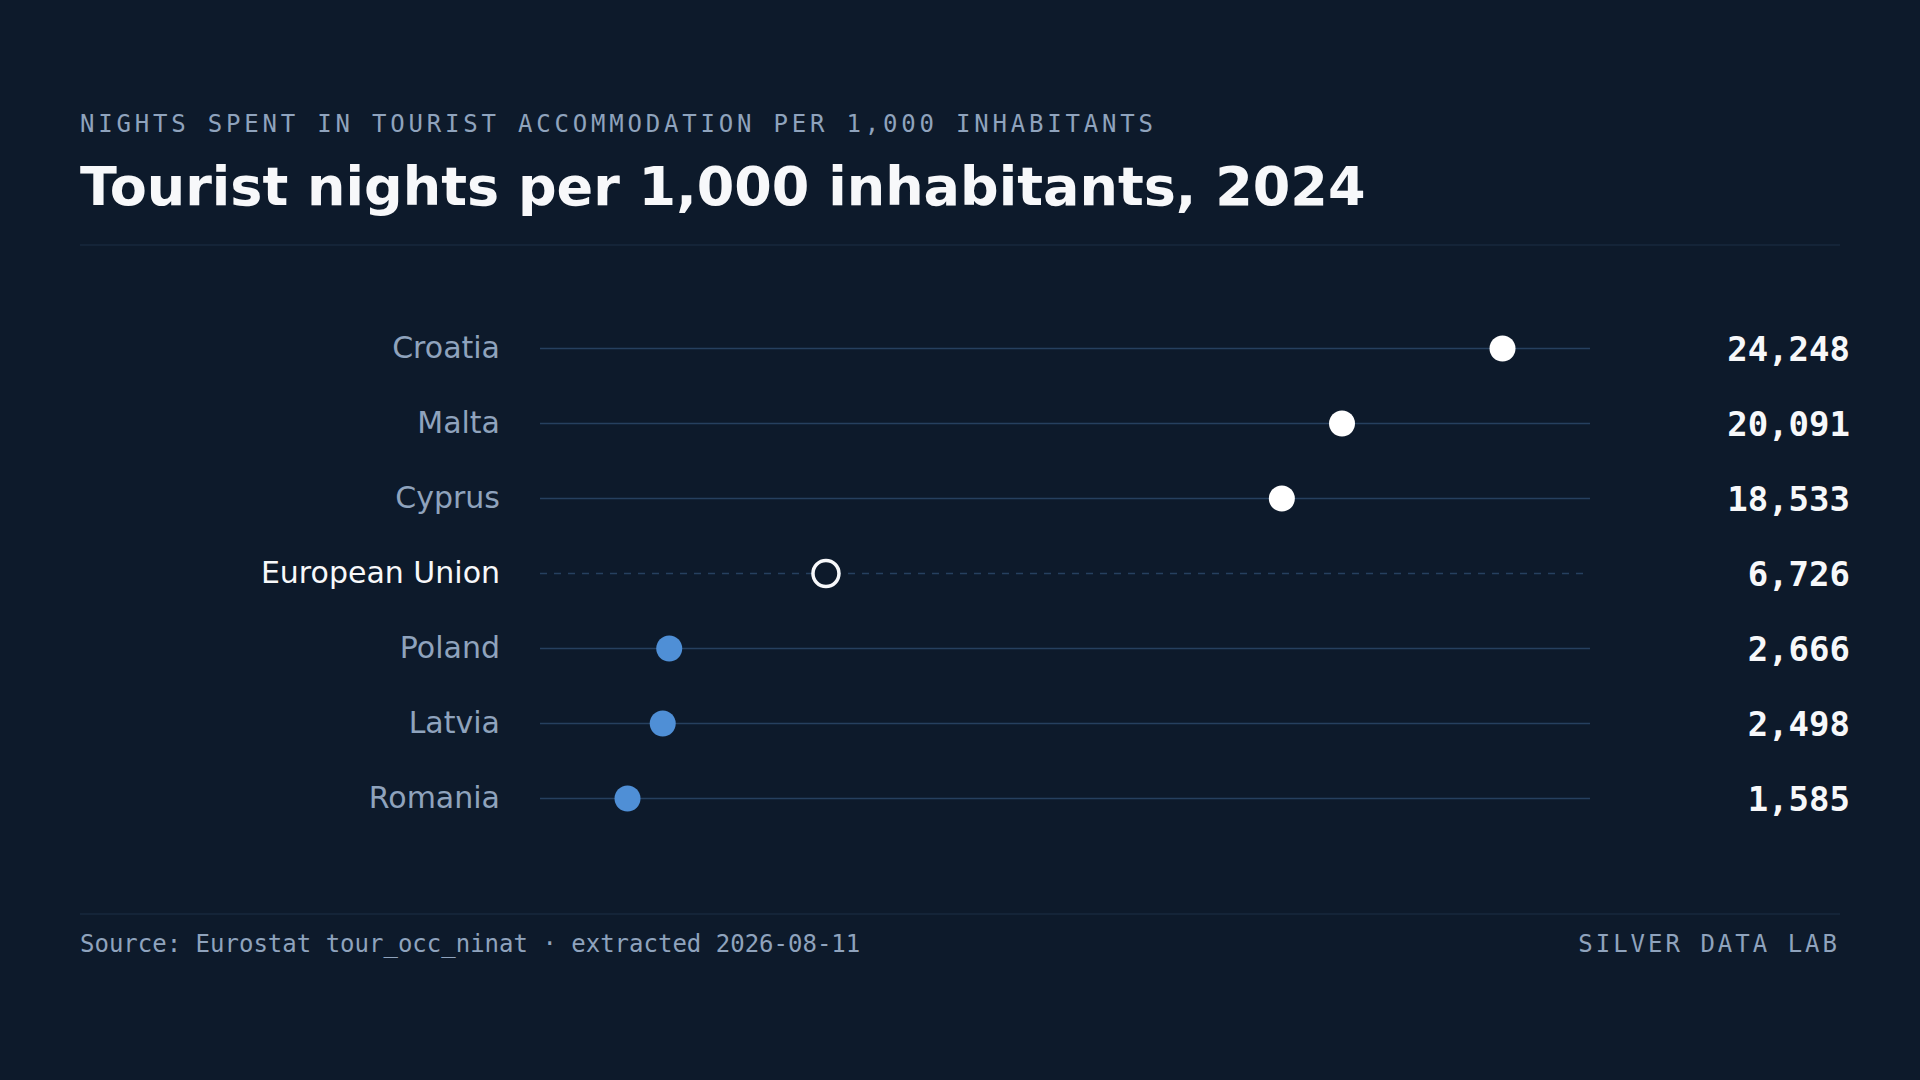
For Its Population, Croatia Has the Most Tourist Overnight Stays in the EU
The EU recorded 6,978 tourist nights per 1,000 inhabitants in 2025, about 7.0 nights per resident.
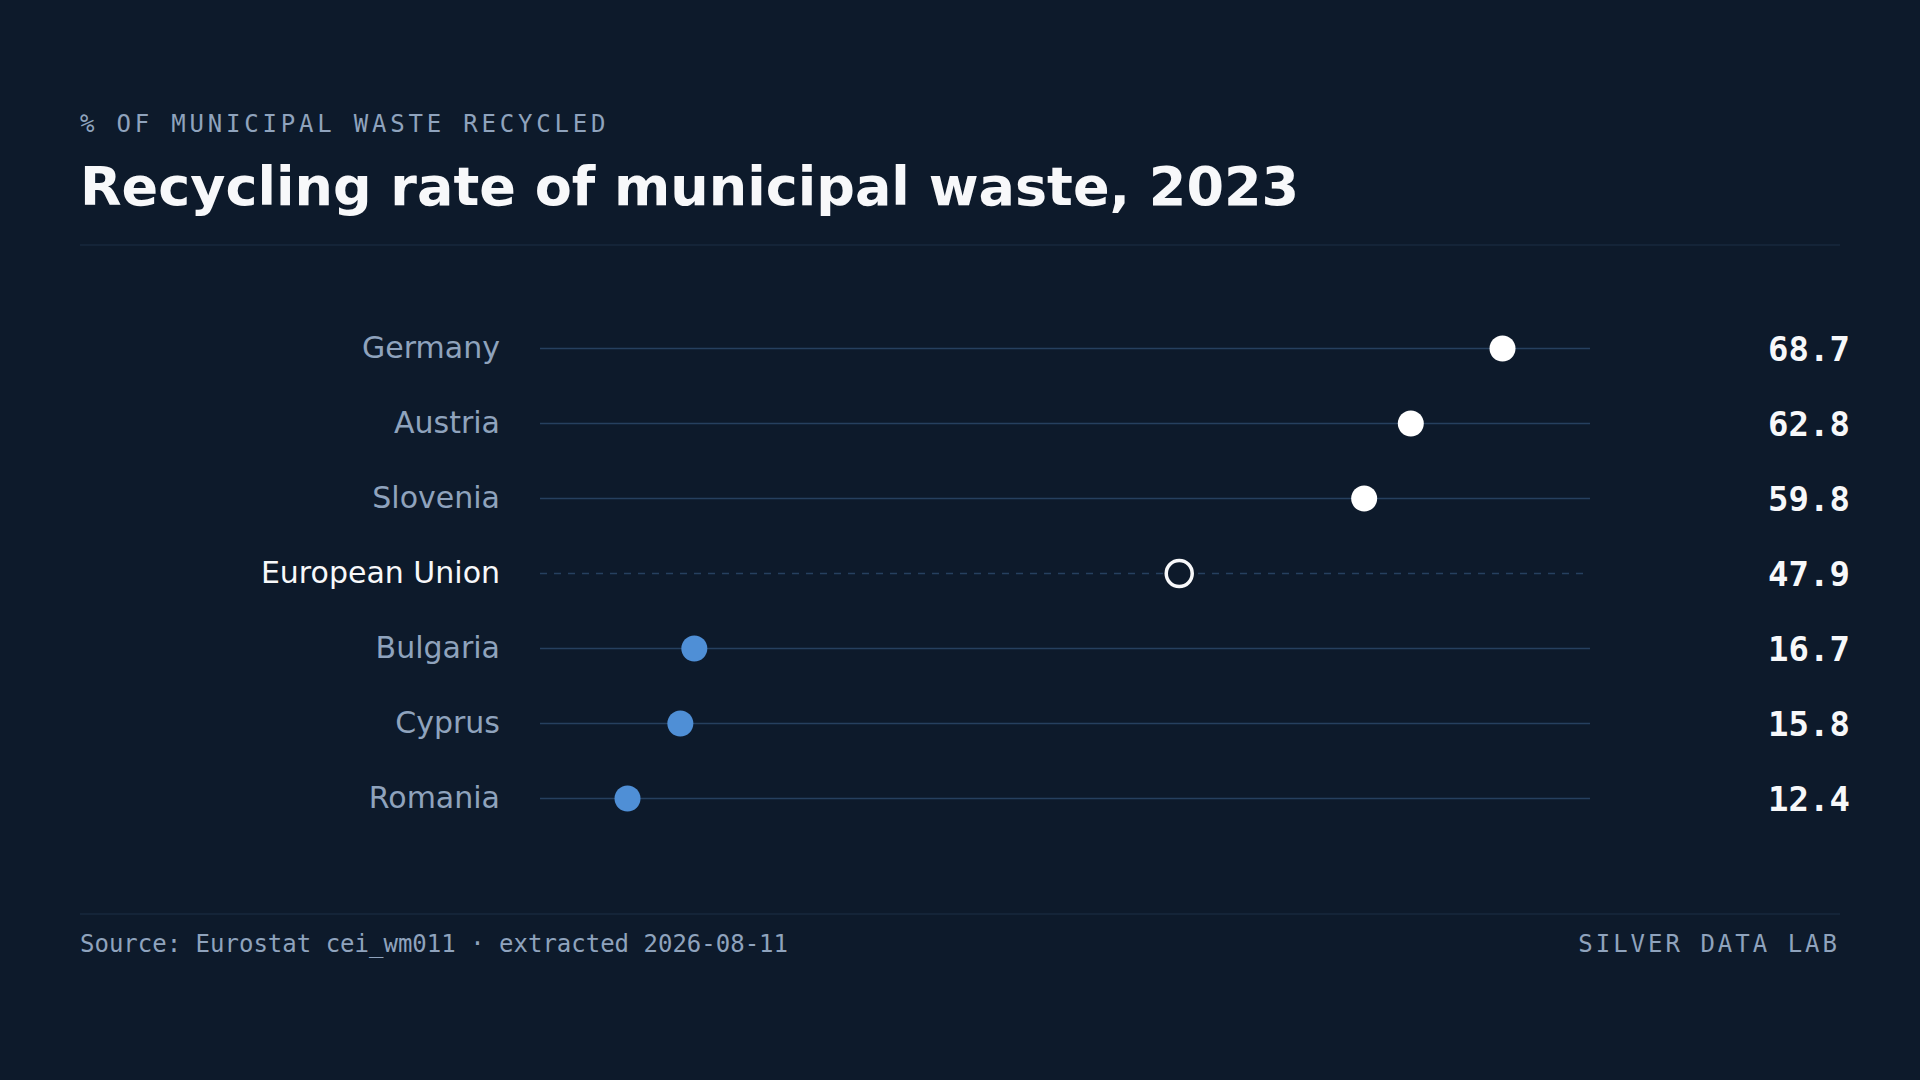
Germany's Recycling Rate Is 5.5 Times Romania's
The EU recycled 47.9% of its municipal waste in 2023, slightly under half.