Austria Produces More Rubbish per Person Than Any Other EU Country
Silver Data Lab Research Desk · Statistical analysis · Published on 02 April 2026
- Data source
- Eurostat
- Reference period
- 2023
- Last updated
- 16 October 2026
Re-checked against the source on 16 October 2026. 23 values in its datasets moved between snapshots, 1 of them figures stated on this page. Every revision we have observed →
Key estimates
- The EU generated 510 kg of municipal waste per inhabitant in 2023 — about 1.4 kg per person per day.
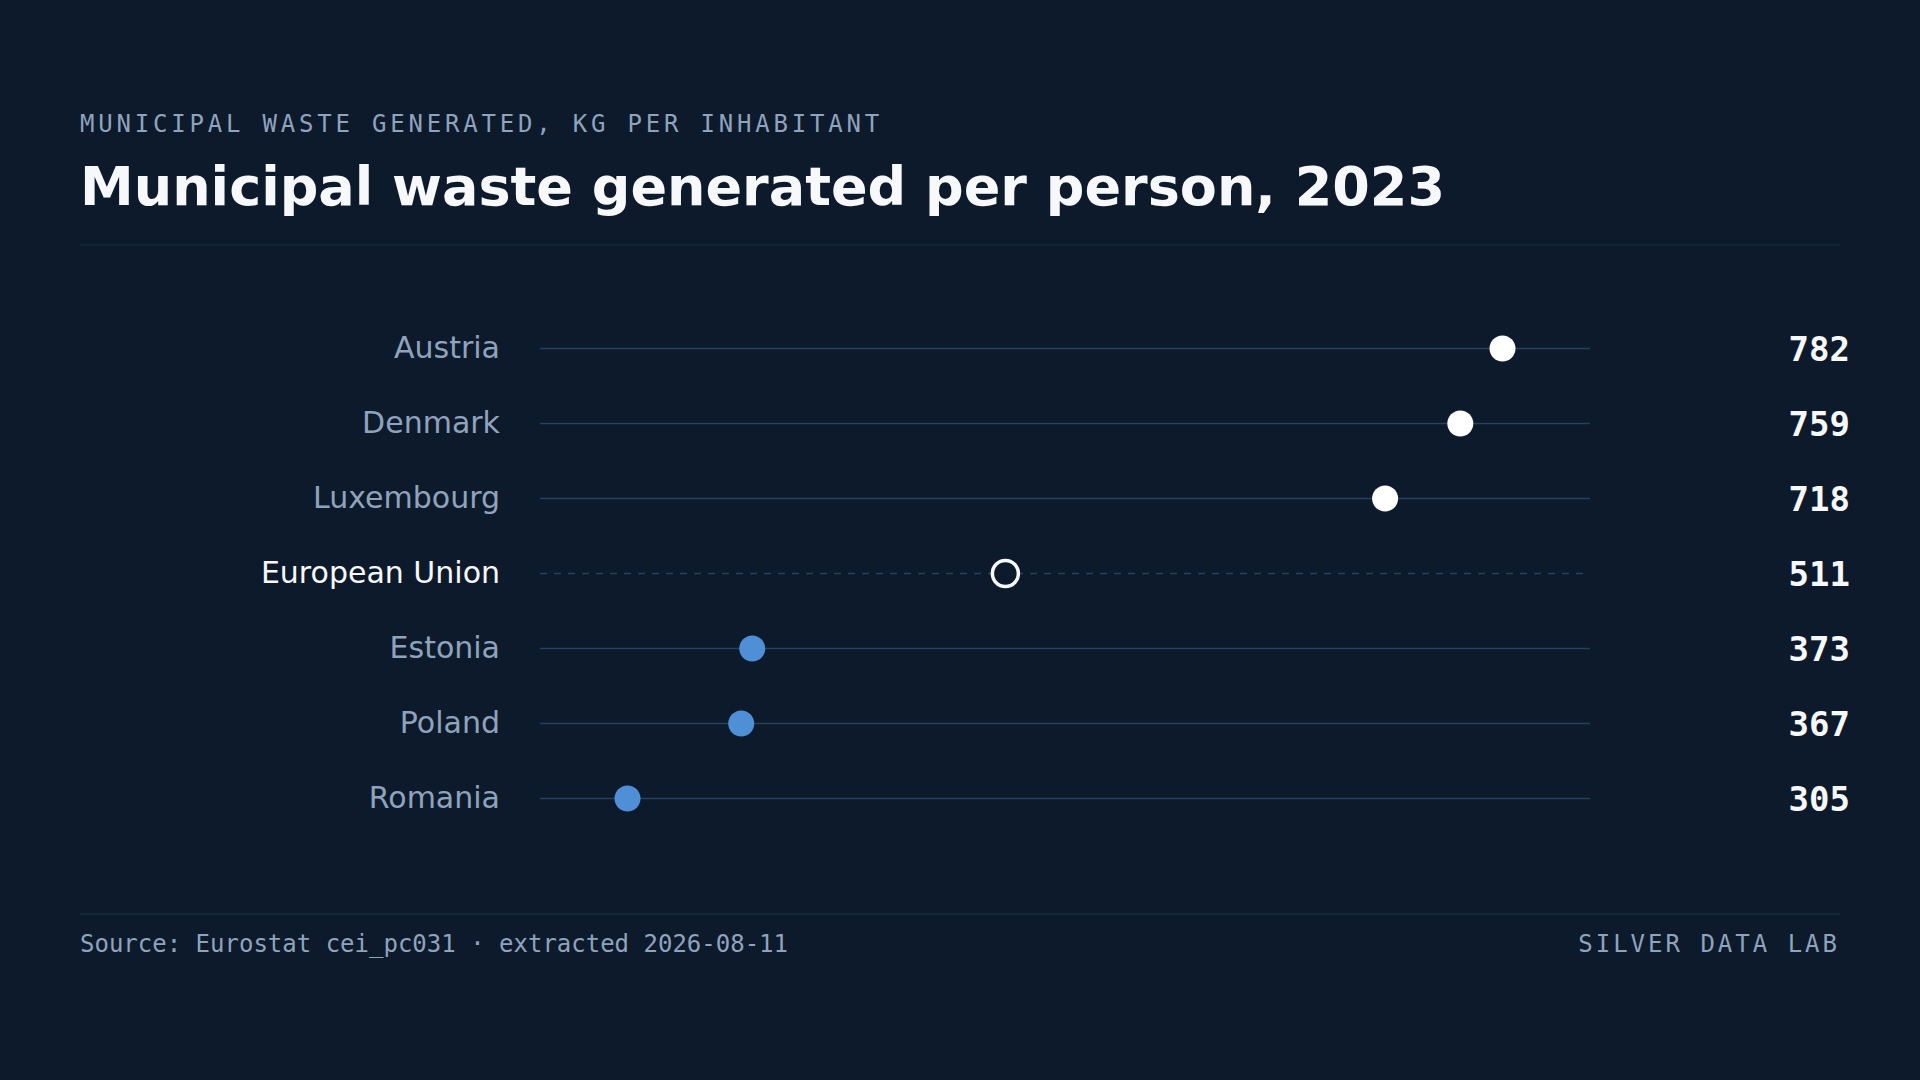
- Austria records 782 kg per person, Denmark 759 kg and Luxembourg 718 kg.
- Romania records 305 kg, Poland 367 kg and Estonia 373 kg.
- Seven Member States exceed 600 kg per person; none of the seven is a lower-income Member State.
- Austria generates 2.6 times as much municipal waste per person as Romania and recycles a much larger share of it.
How much a household throws away
Municipal waste is what households and similar small producers discard: the bins outside homes, not the output of factories. Measured per inhabitant it is one of the closest things European statistics offer to a direct measure of consumption.
Across the EU in 2023 the figure was 510 kg per person — roughly 1.4 kg every day, for every resident of the Union.
The ranking follows income
Austria records 782 kg per person, Denmark 759, Luxembourg 718, Belgium 688, Cyprus 661, Germany 613 and Malta 603. Seven Member States above 600 kg, and none of them is among the Union's lower-income members.
At the other end, Romania records 305 kg, Poland 367, Estonia 373 and Sweden 392.
Sweden at 392 is the entry that breaks the pattern, and it is worth naming rather than smoothing over: a high-income Nordic Member State generating less municipal waste per head than Hungary or Slovakia. Whatever produces the Austrian and Danish figures, it is not simply being rich.
The uncomfortable pairing
Some of the countries at the top of this ranking are also at the top of the recycling ranking, and others are near the bottom of it. Austria generates the most municipal waste per person in the Union and recycles 62.8% of it. Romania generates the least and recycles 12.4%.
Both facts are true and they pull in opposite directions. Austria recycles more of a much larger pile; Romania recycles very little of a much smaller one.
In absolute terms an Austrian sends roughly 291 kg per year to landfill or incineration and a Romanian roughly 267 kg — figures derived here by applying each country's recycling rate to its waste generation, and close enough that the two ends of this ranking nearly meet once recycling is taken out.
What this means for how the two indicators are used
A recycling rate is a measure of waste management. Waste generated per person is a measure of consumption. A country can look excellent on the first while sitting at the top of the second, and Austria does.
Reducing what is discarded and improving what happens to it afterwards are separate policy problems with separate rankings, and the Union's stronger performers on the second are frequently its weaker performers on the first.
Municipal waste generated per person, 2023
| Country | kg per inhabitant | Gap to EU averagederived |
|---|---|---|
| Austria | 782 | +272.0 |
| Denmark | 759 | +249.0 |
| Luxembourg | 718 | +208.0 |
| European Unionaggregate | 510 | — |
| Estonia | 373 | −137.0 |
| Poland | 367 | −143.0 |
| Romania | 305 | −205.0 |
This table as data: CSV · JSON
Every Member State for this indicator+
Members see every Member State for this indicator here, not only the rows the ranking prints. Become a Member
Embed this chart
Paste this code into a page. The frame carries the source and the extraction date, and links back to the study.
What these figures cannot tell you
- Municipal waste is a small share of all waste
- This covers household and similar waste only. Construction, mining, industrial and agricultural waste together account for the large majority of material discarded in the Union and are not included here.
- Collection coverage differs
- Countries differ in what enters the municipal stream and in how completely waste is collected and weighed. Where collection coverage is incomplete, generation is understated, which may affect the lower end of this ranking.
- Tourism inflates some figures
- Waste generated by visitors is counted against the resident population of the country they visit. For Cyprus, Malta, Croatia and Austria, which host large numbers of visitors relative to their populations, this raises the per-inhabitant figure.
- The unrecycled comparison is derived
- The kilogram figures for waste not recycled are computed by Silver Data Lab by applying each country's published recycling rate to its published generation figure. Eurostat does not publish that product, and the two series it multiplies are separate extractions for the same reference year, each declared below.
Frequently asked questions
- How much waste does the average European throw away?
- 510 kg of municipal waste per person in 2023, or about 1.4 kg a day. National figures range from 782 kg in Austria to 305 kg in Romania.
- Which EU country generates the most waste?
- Austria, at 782 kg of municipal waste per person in 2023, followed by Denmark at 759 kg and Luxembourg at 718 kg. Seven Member States exceed 600 kg per person.
- Which EU country generates the least waste?
- Romania, at 305 kg per person in 2023, followed by Poland at 367 kg and Estonia at 373 kg. Sweden at 392 kg is the one high-income Member State near the bottom.
- Do countries that recycle more also throw away more?
- Some do and some do not, which is what makes the pairing worth stating. Austria generates the most municipal waste per person in the Union and recycles 62.8% of it; Romania generates the least and recycles 12.4%. Reducing waste and recycling it are separate achievements with different rankings.
Methodological note
Eurostat publishes municipal waste generated in kilograms per inhabitant. This study uses the generation operation for 2023, the most recent year with complete coverage of the 27 Member States at the extraction date.
The recycling rates quoted for comparison come from the companion study in the environment and energy category, which uses a separate extraction for the same reference year.
The count of Member States above 600 kg, the ratio between Austria and Romania, and the estimates of waste not recycled are derived by Silver Data Lab and are labelled as derived where they appear.
Source data
This study draws on 2 datasets from Eurostat. Each can be inspected and re-downloaded from its catalogue, and the filters below are the ones applied.
Generation of municipal waste per capita
cei_pc031
- Filters applied:
- freq=A · wst_oper=GEN · unit=KG_HAB · time=2023
- Extracted:
- 2026-10-16
- Source last updated:
- 2026-10-15
Recycling rate of municipal waste
cei_wm011
- Filters applied:
- freq=A · wst_oper=RCY · unit=PC · time=2023
- Extracted:
- 2026-10-16
- Source last updated:
- 2026-10-15
Download the data
The data the study you have just read is built on, exactly as it was downloaded and archived.
Yours as a Member.
Data downloadable by Members
How to cite
Record the vintage as well as the study: the figures on this page are the ones extracted on the dates below.
Silver Data Lab Research Desk (2026). Austria Produces More Rubbish per Person Than Any Other EU Country. Silver Data Lab, published 02 April 2026, last updated 16 October 2026. https://www.silverdatalab.com/studies/waste-generation-in-the-eu
- Data: Eurostat, Generation of municipal waste per capita (cei_pc031), filters freq=A, wst_oper=GEN, unit=KG_HAB, time=2023; extracted 2026-10-16; source last updated 2026-10-15. https://doi.org/10.2908/cei_pc031
- Data: Eurostat, Recycling rate of municipal waste (cei_wm011), filters freq=A, wst_oper=RCY, unit=PC, time=2023; extracted 2026-10-16; source last updated 2026-10-15. https://doi.org/10.2908/cei_wm011
Silver Data Lab's analysis is licensed CC BY 4.0. The statistics remain their publisher's and keep its terms of reuse.
Ask the research desk
A question about this study — a definition, a filter, a break in the series, what the figures can and cannot support — answered by the desk that made the extraction.
Members can write to the research desk
Other studies on the same dataset
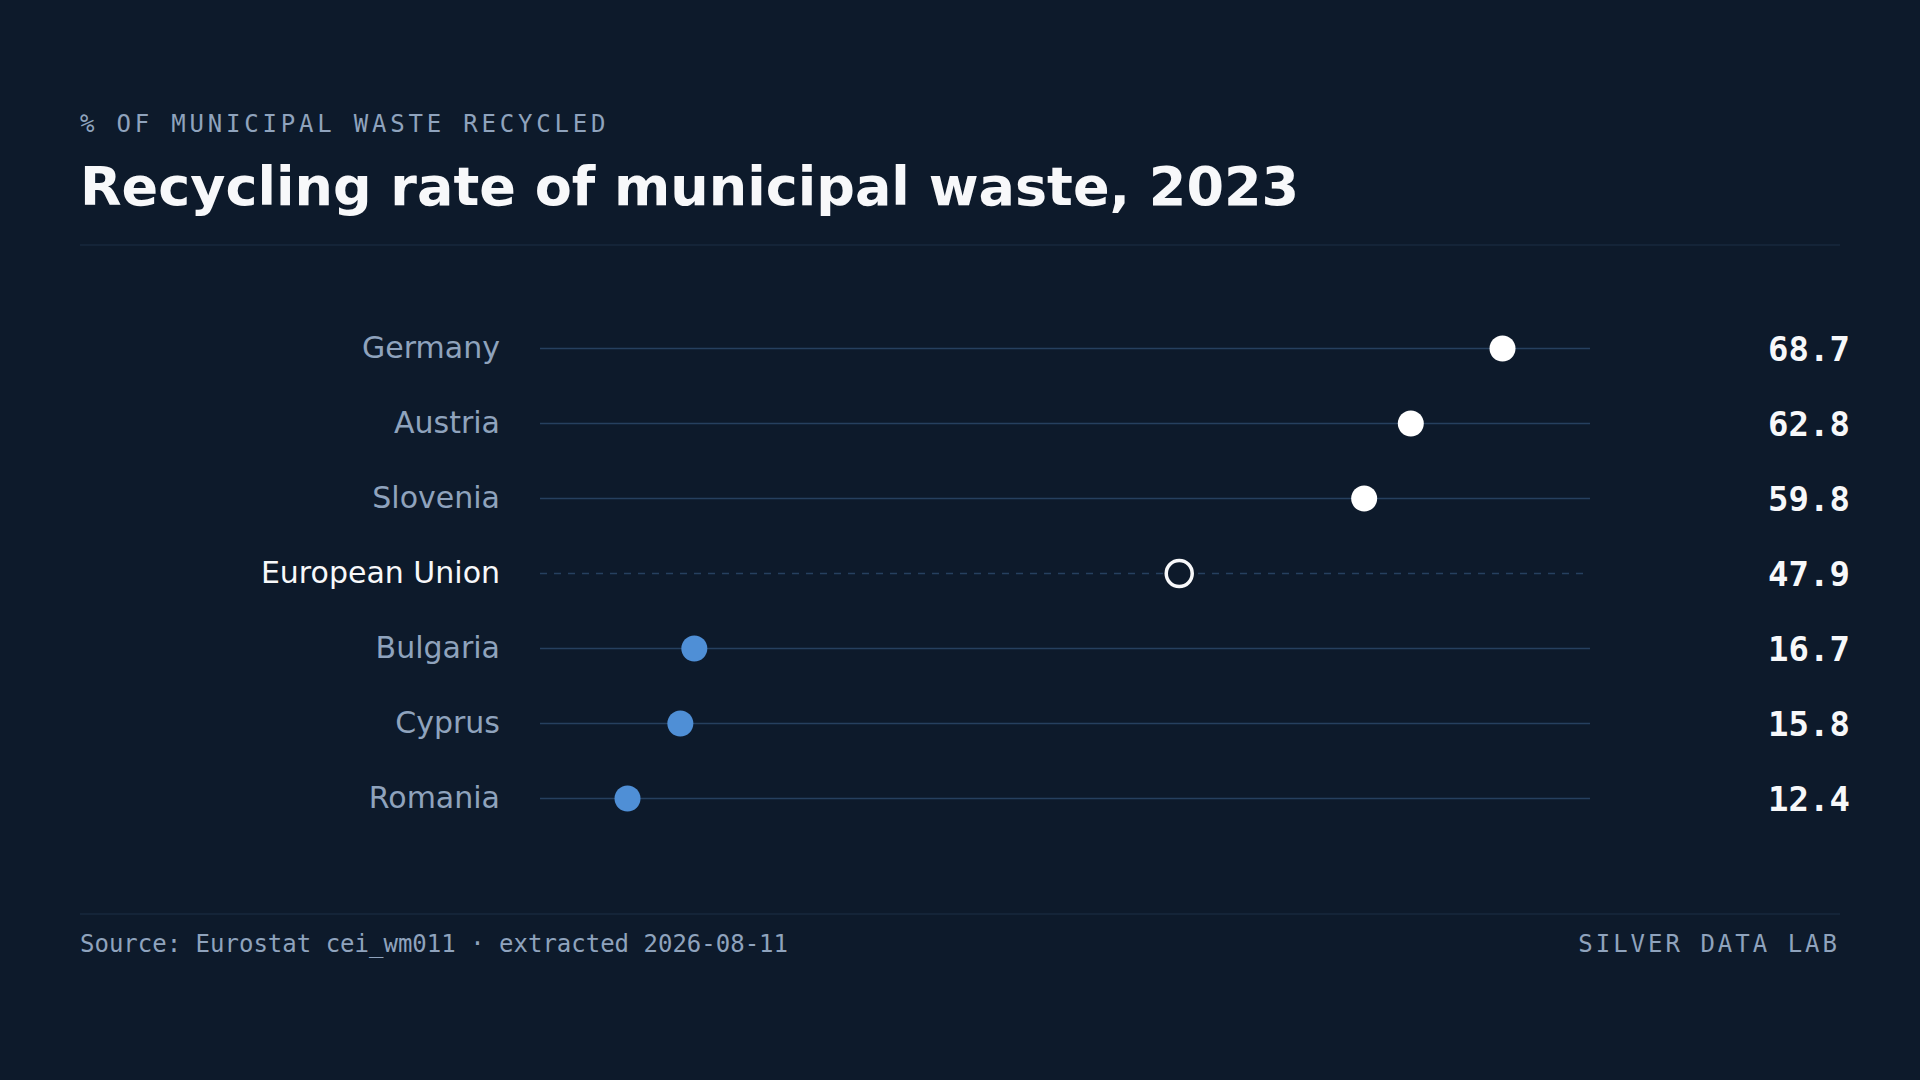
Germany's Recycling Rate Is 5.5 Times Romania's
The EU recycled 47.9% of its municipal waste in 2023, slightly under half.
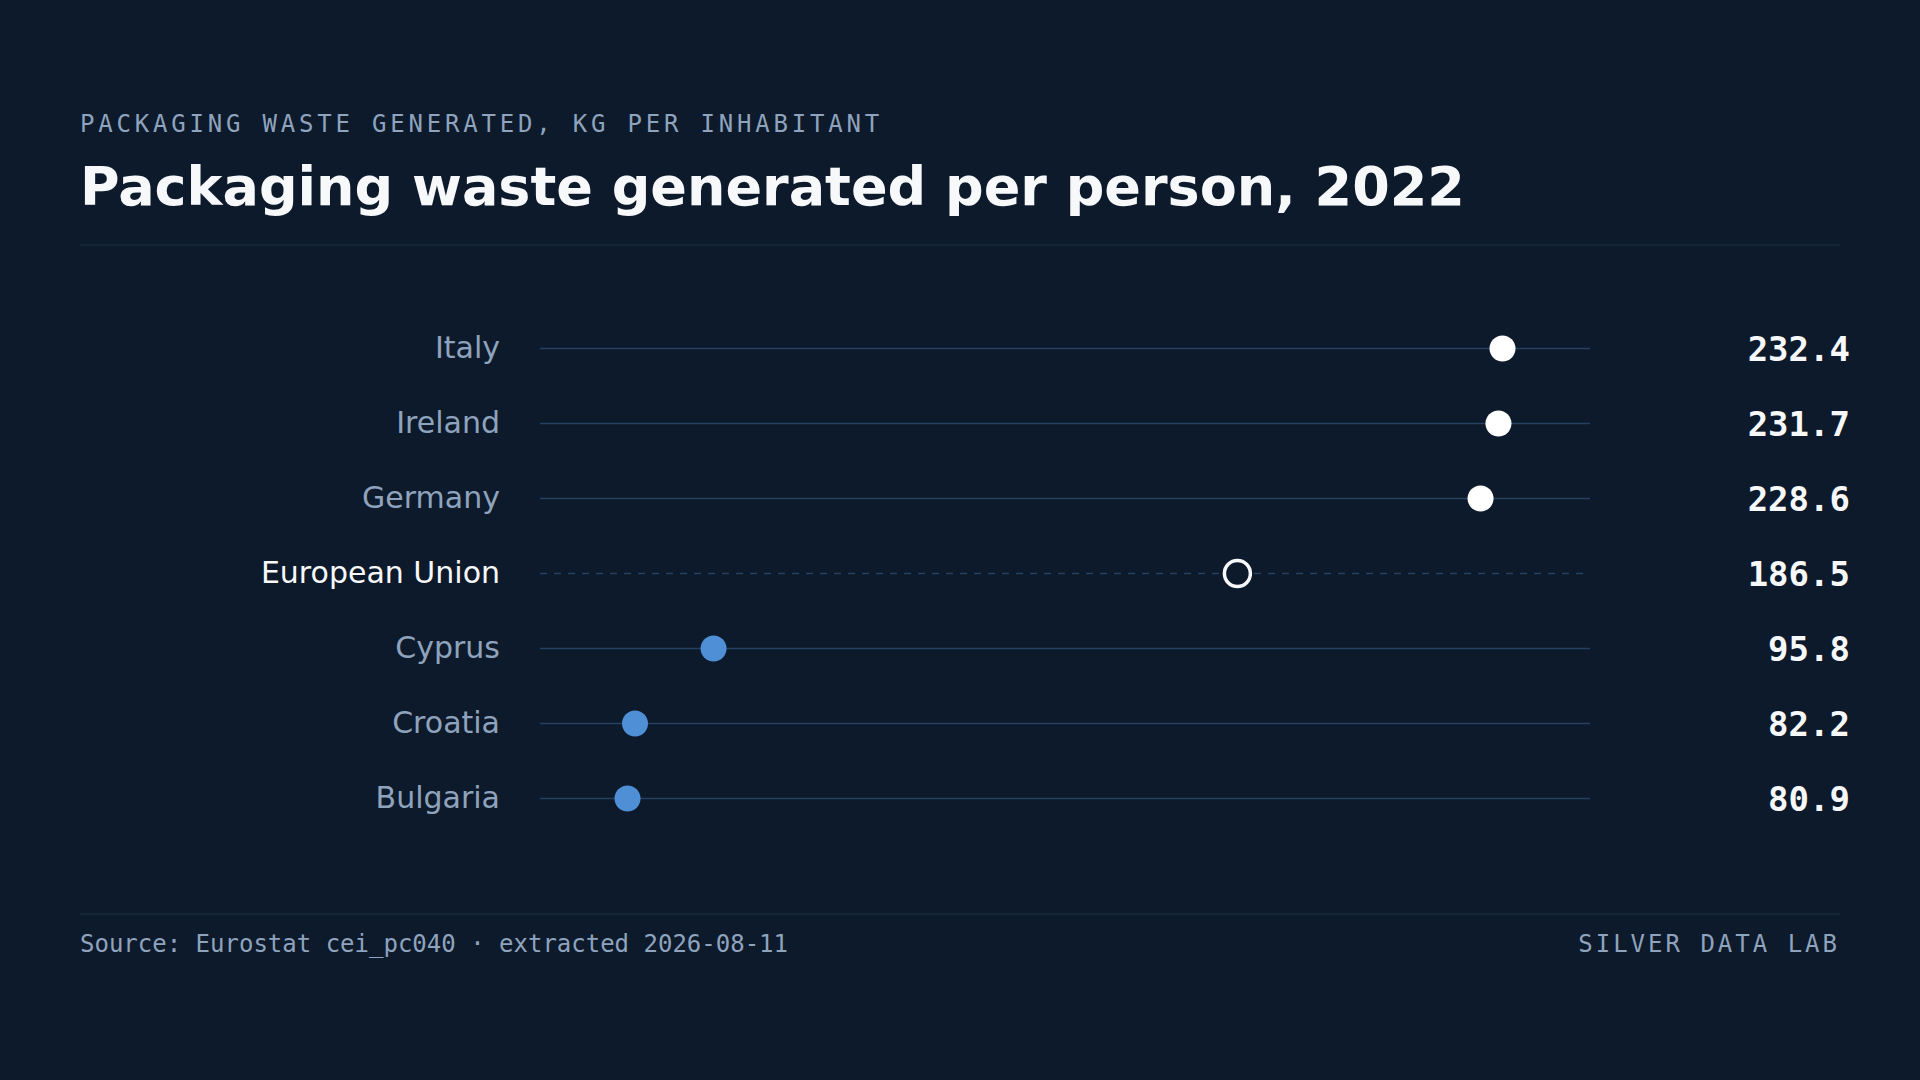
Italy's Packaging Waste per Person Is 2.9 Times Bulgaria's
The EU generated 186.6 kg of packaging waste per inhabitant in 2022.
Studies where the same country leads or trails
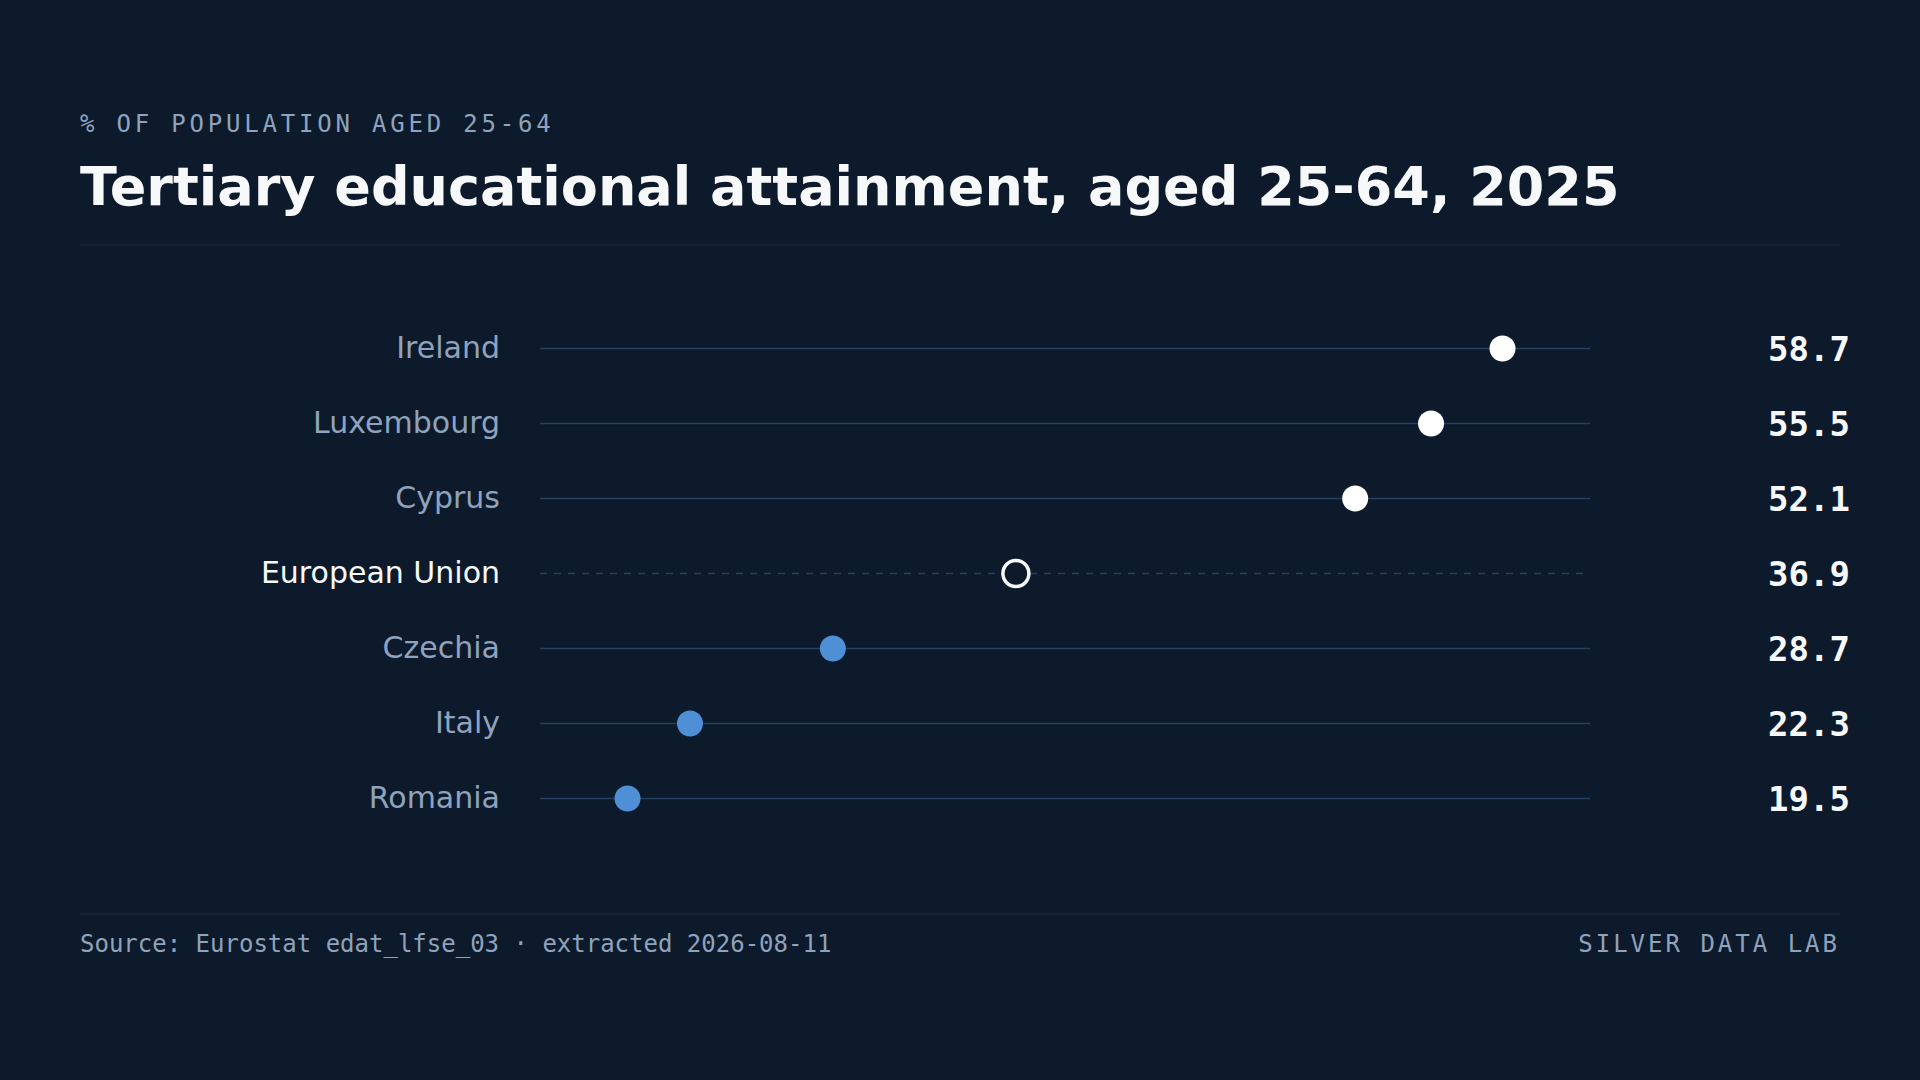
A Degree Is Three Times as Common Among Adults in Ireland as in Romania
36.9% of people aged 25 to 64 in the EU held a tertiary qualification in 2025.
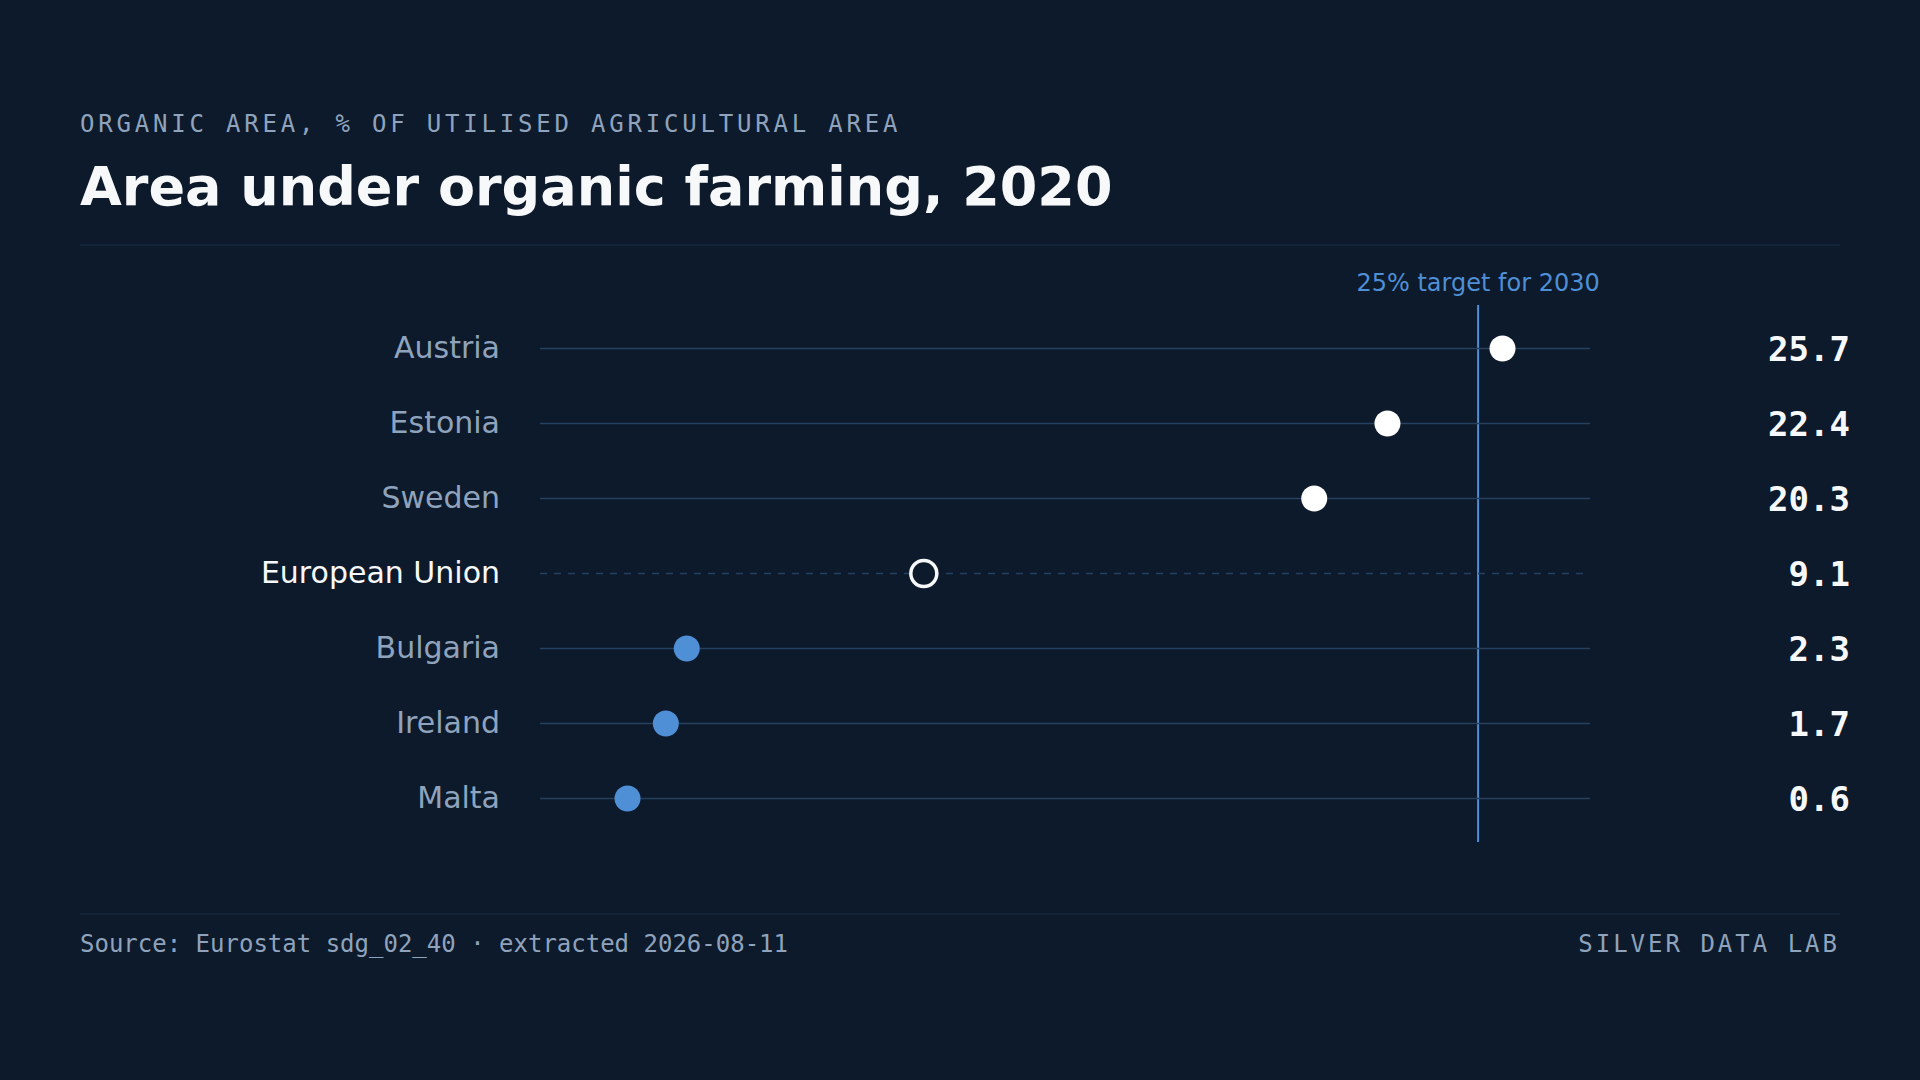
Austria Already Farms a Quarter of Its Farmland Organically
9.1% of the EU's utilised agricultural area was under organic management in 2020, against a target of 25% by 2030.
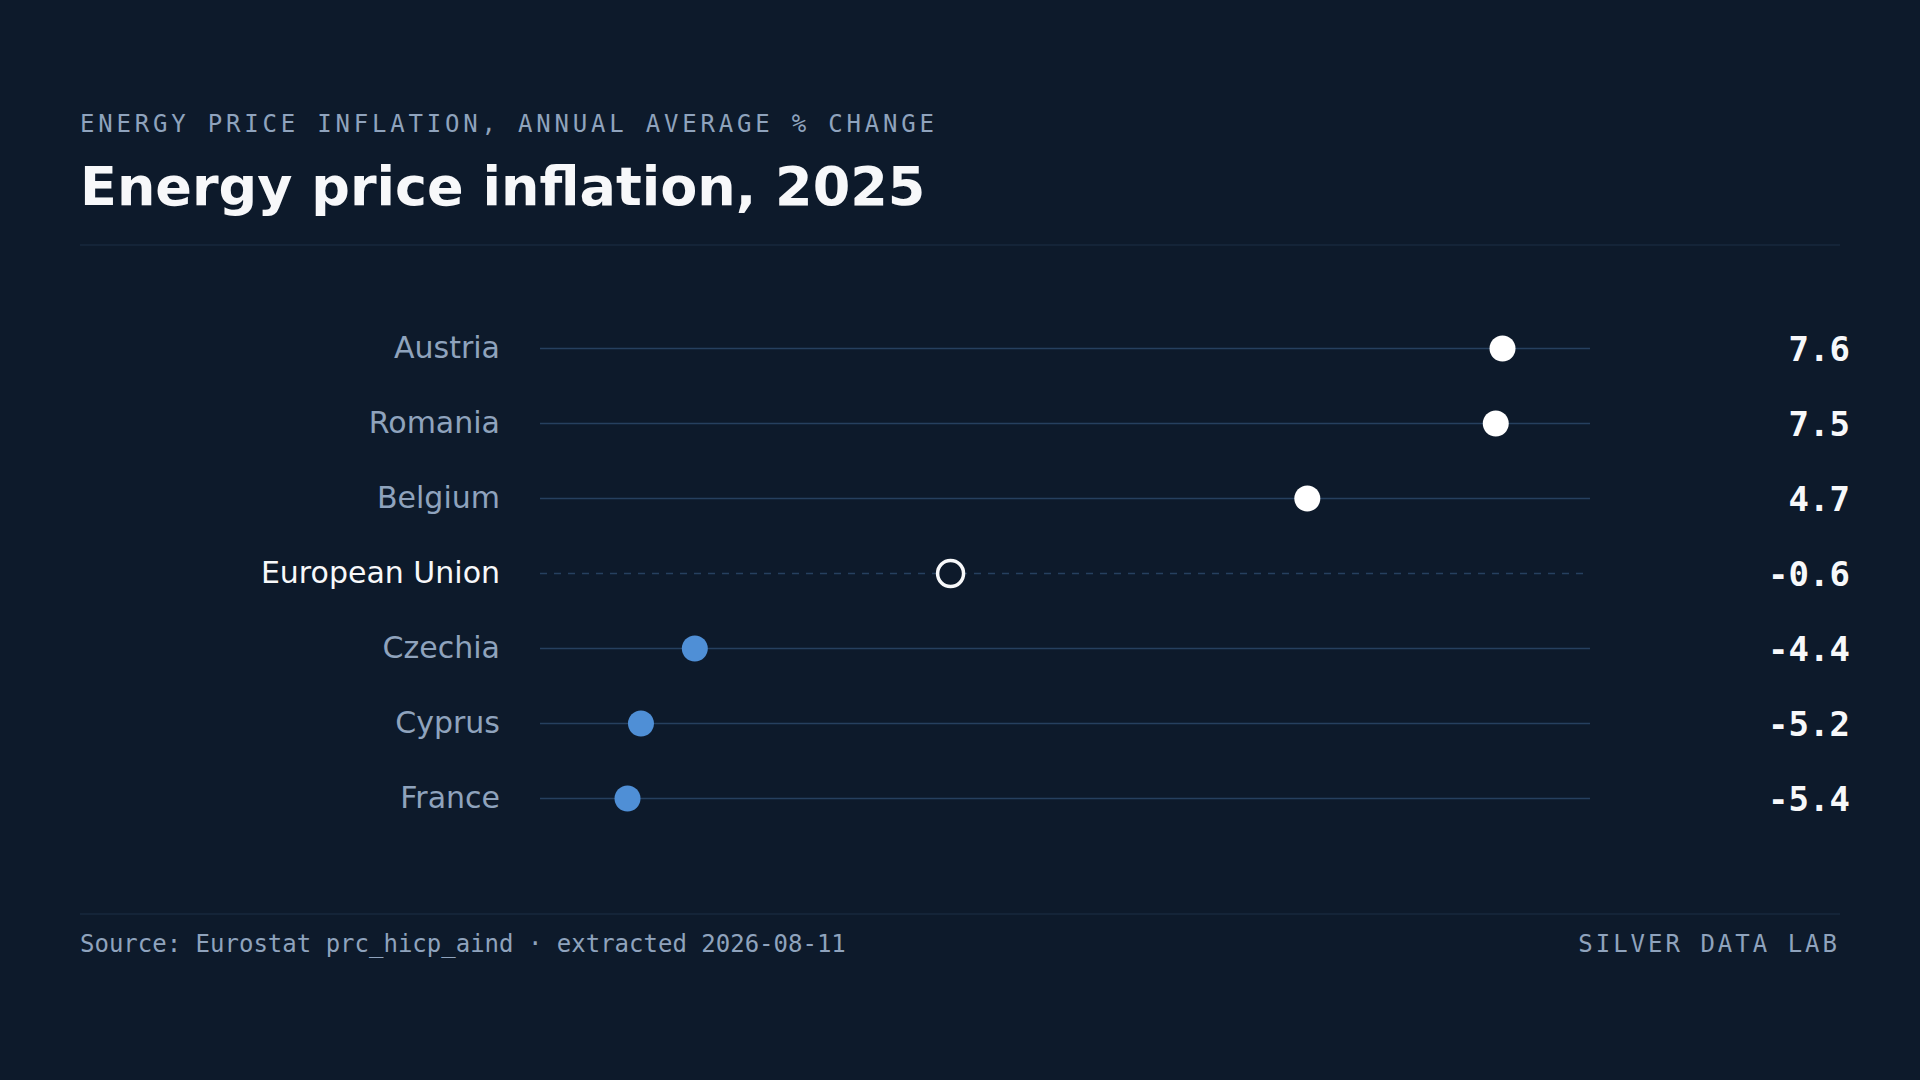
Energy Prices Fell on Average in the EU but Rose 7.6% in Austria
Energy prices in the EU fell 0.6% on average in 2025.