Austria Already Farms a Quarter of Its Farmland Organically
Silver Data Lab Research Desk · Statistical analysis · Published on 10 August 2026
- Data source
- Eurostat
- Reference period
- 2020
- Last updated
- 11 October 2026
Re-checked against the source on 07 October 2026. 1 values in its datasets moved between snapshots; none is a figure stated on this page. Every revision we have observed →
Key estimates
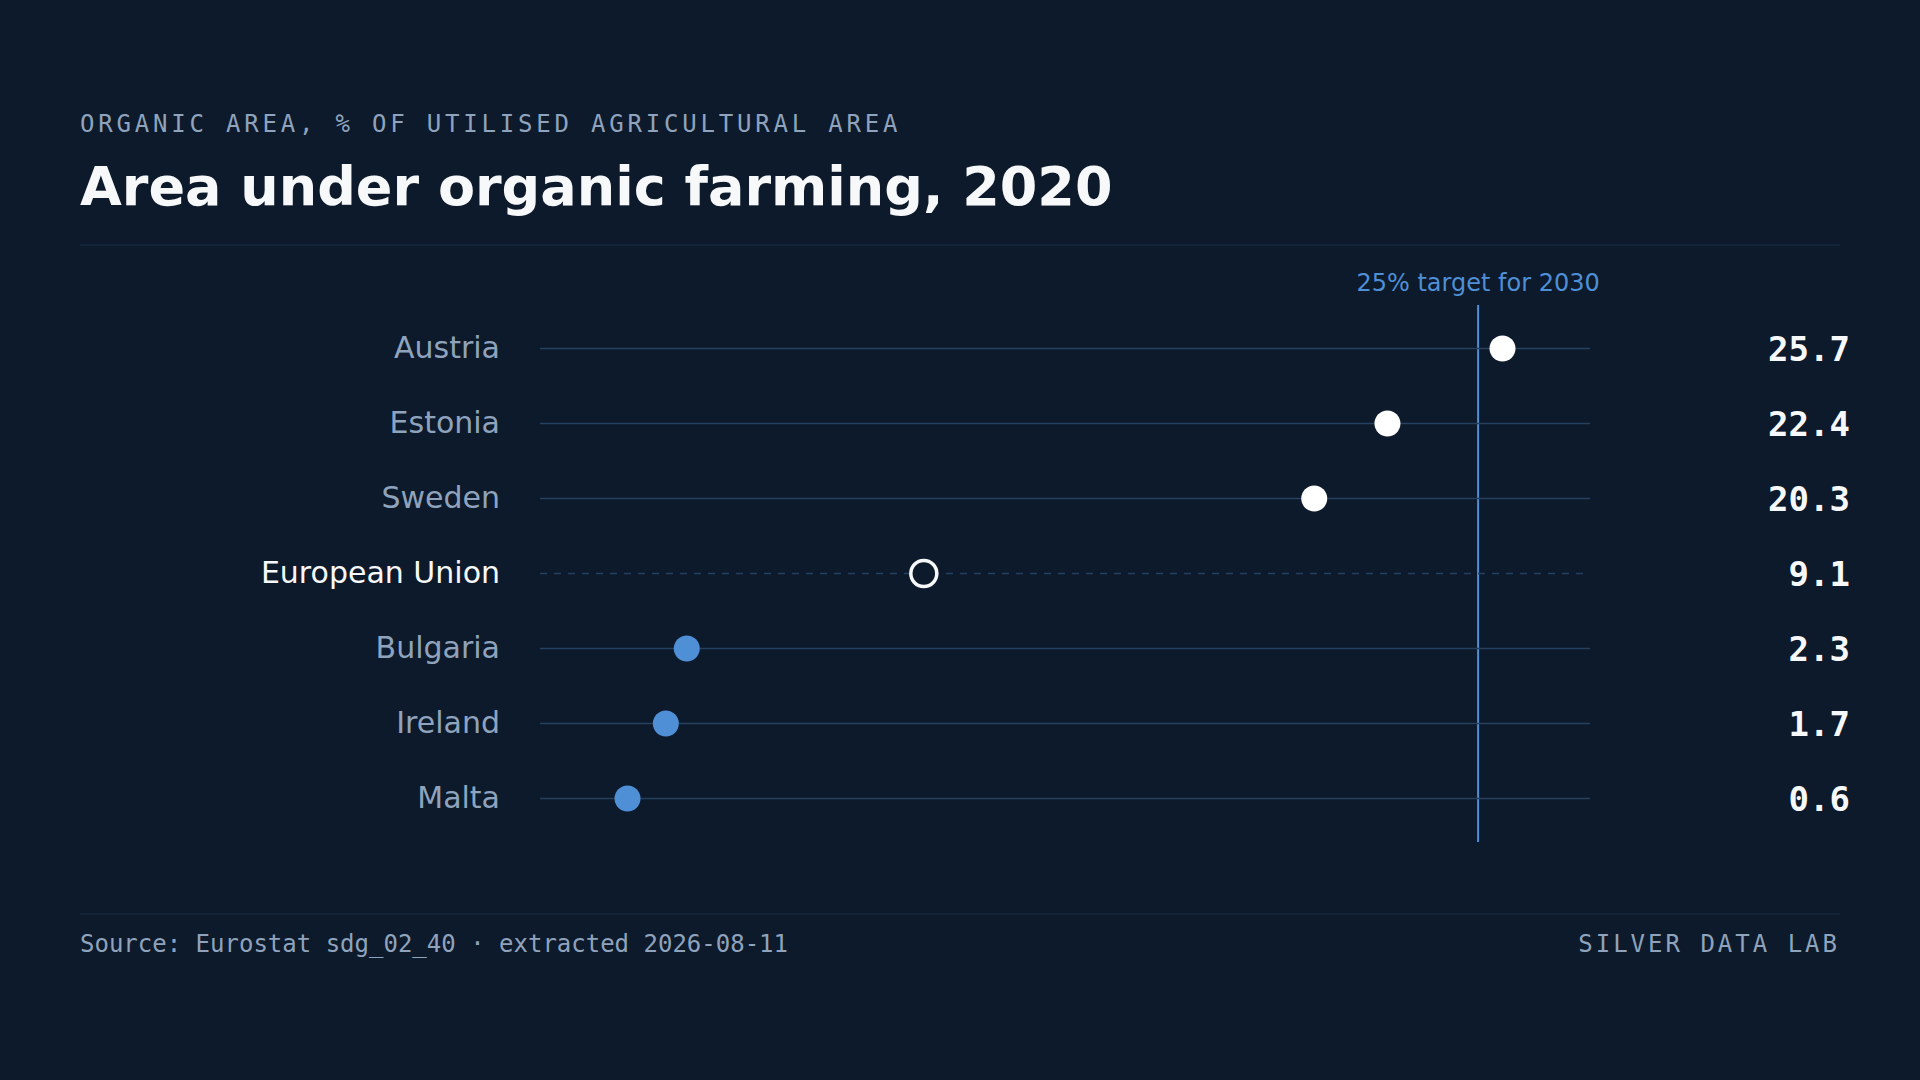
- 9.1% of the EU's utilised agricultural area was under organic management in 2020, against a target of 25% by 2030.
- Austria records 25.7%, already past the 2030 target a decade early.
- Estonia records 22.4%, Sweden 20.3%, Italy 16.0% and Czechia 15.3%.
- Malta records 0.6%, Ireland 1.7% and Bulgaria 2.3%.
- Reaching 25% across the Union would require organic area to nearly triple from its 2020 level.
Why this study reports 2020
Eurostat's organic area series runs to 2024, and this study does not use it.
From 2021 onwards the release stops publishing a value for Austria, for Greece and for the EU aggregate. Austria recorded 25.7% in 2020, the highest share in the Union by three percentage points.
A ranking built on the 2024 release would therefore report Estonia as the Union's leading organic producer and omit both the actual leader and the EU figure to compare against. That would be wrong in a way a reader could not detect, so this study uses 2020 — the most recent year in which every Member State and the aggregate are present — and says so rather than publishing a more recent number that is missing the country at the top.
The target and the distance to it
The EU's farm strategy sets a target of 25% of agricultural land under organic management by 2030. In 2020 the figure was 9.1%.
Meeting it would require organic area across the Union to nearly triple within a decade. Whatever the merits of the objective, that is the arithmetic it implies.
Austria
Austria records 25.7%, which is to say it met the 2030 target in 2020.
No other Member State is close to that position. Estonia at 22.4% and Sweden at 20.3% are within reach of it; Italy at 16.0%, Czechia at 15.3% and Latvia at 14.8% are not.
Austria's share rests on a long-standing national support framework and on an agricultural sector dominated by small mountain holdings, where the yield penalty from organic methods is smaller than on intensive lowland arable land. The topography that makes Austrian farming unproductive by other measures makes organic conversion comparatively cheap.
The bottom
Malta records 0.6%, Ireland 1.7%, Bulgaria 2.3%, Poland 3.5% and Romania 3.6%.
Ireland at 1.7% is the entry worth naming. It is the Union's most livestock-oriented agricultural sector, with three quarters of output coming from animals, and it has among the lowest organic shares. The two facts are connected: organic livestock certification imposes stocking and feed requirements that are demanding for a grass-based export industry built on volume.
The Netherlands at 4.0% is in a similar position for the same underlying reason, with intensity rather than volume as the constraint.
What a share of area does and does not measure
Organic area is measured in hectares, not in output or in value. A Member State can have a high organic share concentrated in extensive grassland producing comparatively little, and a low share on intensive land producing a great deal.
The indicator is a good measure of how much land is under a particular management regime. It is a poor measure of how much organic food a country produces, and it should not be read as one.
Area under organic farming, 2020
| Country | % of utilised agricultural area | Gap to EU averagepercentage points, derived |
|---|---|---|
| Austria | 25.7 | +16.6 |
| Estonia | 22.4 | +13.3 |
| Sweden | 20.3 | +11.2 |
| European Unionaggregate | 9.1e | — |
| Bulgaria | 2.3 | −6.8 |
| Ireland | 1.7 | −7.4 |
| Malta | 0.6 | −8.5 |
Flags carried by the source on these values: e estimated
This table as data: CSV · JSON
Every Member State for this indicator+
Members see every Member State for this indicator here, not only the rows the ranking prints. Become a Member
Embed this chart
Paste this code into a page. The frame carries the source and the extraction date, and links back to the study.
What these figures cannot tell you
- The reference year is 2020, deliberately
- Later releases omit Austria, Greece and the EU aggregate. Austria is the highest-ranked Member State, so a ranking from the 2024 data would name the wrong leader. This study uses the most recent complete year instead.
- Area, not output
- The measure counts hectares under organic management, not the quantity or value of organic food produced. Extensive grassland and intensive horticulture count the same per hectare and produce very differently.
- Fully converted and in-conversion land
- National figures combine land that is certified organic with land in the conversion period, which lasts two to three years. The mix differs between Member States and affects comparisons at the margin.
- The 25% target is Union-wide
- The target applies to the EU as a whole, not to each Member State individually. Comparing national shares against it, as this study does, is a benchmark rather than a compliance measure.
Frequently asked questions
- How much EU farmland is organic?
- 9.1% of utilised agricultural area in 2020, against an EU target of 25% by 2030. Reaching the target would require organic area to nearly triple.
- Which EU country farms the most land organically?
- Austria, at 25.7% of its agricultural area in 2020 — already past the 2030 target a decade early. Estonia at 22.4% and Sweden at 20.3% follow.
- Which EU country has the least organic farming?
- Malta at 0.6%, Ireland at 1.7% and Bulgaria at 2.3%. Ireland's position is connected to its heavily livestock-based agriculture, where organic certification imposes stocking and feed requirements that are demanding for a volume export industry.
- Why does this study use 2020 rather than a more recent year?
- Because from 2021 onwards Eurostat stops publishing values for Austria, Greece and the EU aggregate in this series. Austria has the highest organic share in the Union, so a ranking built on recent data would name the wrong leader and offer no EU figure to compare against.
Methodological note
Eurostat publishes area under organic farming as a percentage of utilised agricultural area, combining fully converted land and land under conversion.
Values are for 2020. That year is used because it is the most recent for which the source publishes a value for all 27 Member States and for the EU aggregate: releases from 2021 onwards omit Austria, Greece and the EU figure, and Austria holds the highest share in the Union.
The count of Member States below 10%, and the calculation of how far organic area would have to grow to reach the 25% target, are derived by Silver Data Lab. The comparison with the livestock share of agricultural output draws on the companion study in the agriculture category.
Source data
The underlying series can be inspected and re-downloaded from the Eurostat data browser. The filters below are the ones applied.
Area under organic farming
sdg_02_40
- Filters applied:
- freq=A · unit=PC_UAA · crops=UAAXK0000 · agprdmet=TOTAL · time=2020
- Extracted:
- 2026-10-07
- Source last updated:
- 2026-10-06
Download the data
The data the study you have just read is built on, exactly as it was downloaded and archived.
Yours as a Member.
Data downloadable by Members
How to cite
Record the vintage as well as the study: the figures on this page are the ones extracted on the dates below.
Silver Data Lab Research Desk (2026). Austria Already Farms a Quarter of Its Farmland Organically. Silver Data Lab, published 10 August 2026, last updated 11 October 2026. https://www.silverdatalab.com/studies/organic-farming-in-the-eu
- Data: Eurostat, Area under organic farming (sdg_02_40), filters freq=A, unit=PC_UAA, crops=UAAXK0000, agprdmet=TOTAL, time=2020; extracted 2026-10-07; source last updated 2026-10-06. https://doi.org/10.2908/sdg_02_40
Silver Data Lab's analysis is licensed CC BY 4.0. The statistics remain their publisher's and keep its terms of reuse.
Ask the research desk
A question about this study — a definition, a filter, a break in the series, what the figures can and cannot support — answered by the desk that made the extraction.
Members can write to the research desk
Studies where the same country leads or trails
Austria Produces More Rubbish per Person Than Any Other EU Country
The EU generated 510 kg of municipal waste per inhabitant in 2023 — about 1.4 kg per person per day.
Energy Prices Fell on Average in the EU but Rose 7.6% in Austria
Energy prices in the EU fell 0.6% on average in 2025.
In No EU Country Are Enough Babies Born to Replace Their Parents
The EU total fertility rate was 1.34 children per woman in 2024, against the 2.1 conventionally taken as replacement level.