In No EU Country Are Enough Babies Born to Replace Their Parents
Silver Data Lab Research Desk · Statistical analysis · Published on 27 June 2026
- Data source
- Eurostat
- Reference period
- 2024
- Last updated
- 11 October 2026
Re-checked against the source on 01 October 2026. No value in its datasets has moved between the snapshots we hold. Every revision we have observed →
Key estimates
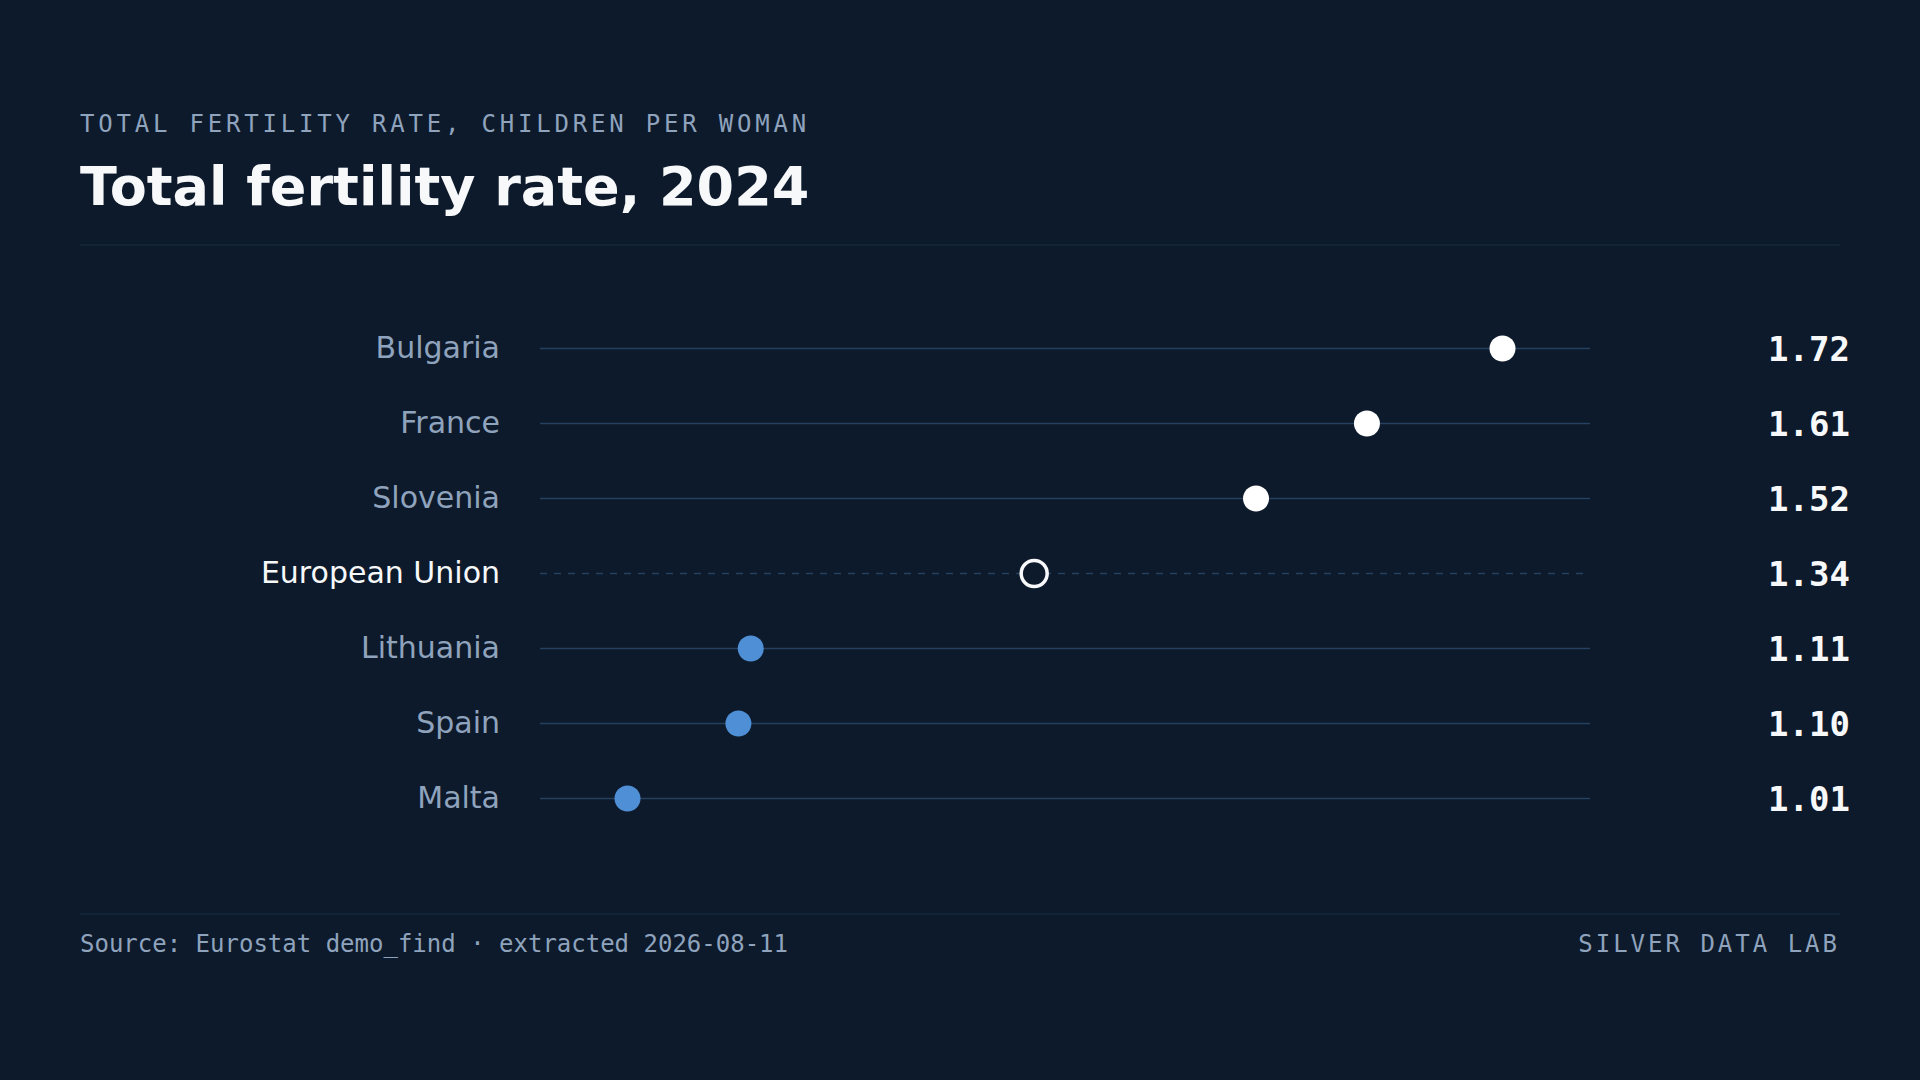
- The EU total fertility rate was 1.34 children per woman in 2024, against the 2.1 conventionally taken as replacement level.
- Zero of 27 Member States reach replacement. The highest, Bulgaria at 1.72, is a fifth short of it.
- Ten Member States sit below 1.3, the threshold demographers call lowest-low fertility.
- Malta records 1.01, Spain 1.10 and Lithuania 1.11 — close to half the replacement rate.
- The distance between the highest and lowest Member State is 0.71 children per woman.
A threshold nobody clears
The total fertility rate estimates how many children a woman would have across her life if she experienced the fertility rates observed in a given year. Roughly 2.1 is the level at which a population replaces itself without migration, the extra tenth covering childhood mortality and the sex ratio at birth.
In 2024 the European Union recorded 1.34. The interesting fact is not that the average falls short; it is that the ranking contains no exceptions. Every one of the twenty-seven Member States is below replacement, and the highest of them is not close.
The top of a ranking that has no winners
Bulgaria records the highest rate in the Union at 1.72, followed by France at 1.61 and Slovenia at 1.52.
Bulgaria's position is worth stating carefully. It is first among twenty-seven, and it is still 0.38 children per woman below replacement — around a fifth short. A country topping this table is not maintaining its population; it is declining more slowly than the others.
Below the lowest-low threshold
Demographers use 1.3 as a conventional marker for lowest-low fertility, the level at which cohort sizes halve within a couple of generations absent migration. Ten Member States sit below it.
Malta records 1.01, the lowest in the Union — a rate at which each generation is roughly half the size of the one before. Spain follows at 1.10 and Lithuania at 1.11. Poland at 1.14, Italy and Estonia at 1.18, Greece and Latvia at 1.24, and Finland and Luxembourg at 1.25 complete the group.
The composition of that group resists the usual story. It contains the Mediterranean economies where low fertility has been discussed for decades, and it also contains Finland and Luxembourg, which have neither the labour market nor the housing conditions usually invoked to explain the Mediterranean case.
What the spread does and does not show
The distance between Bulgaria at 1.72 and Malta at 1.01 is 0.71 children per woman. Against a European average of 1.34, that is a very wide relative spread: the highest rate is seventy per cent above the lowest.
But the spread is the less important number here. When the entire distribution sits below the replacement threshold, differences within it determine the speed of decline rather than its direction. This is one of the few indicators on this site where the ranking is secondary to the fact that every observation falls on the same side of a line.
Total fertility rate, 2024
| Country | Children per woman | Gap to EU averagederived |
|---|---|---|
| Bulgaria | 1.72 | +0.4 |
| France | 1.61p | +0.3 |
| Slovenia | 1.52 | +0.2 |
| European Unionaggregate | 1.34ep | — |
| Lithuania | 1.11 | −0.2 |
| Spain | 1.10 | −0.2 |
| Malta | 1.01 | −0.3 |
Flags carried by the source on these values: ep estimated, provisional · p provisional
This table as data: CSV · JSON
Every Member State for this indicator+
Members see every Member State for this indicator here, not only the rows the ranking prints. Become a Member
Embed this chart
Paste this code into a page. The frame carries the source and the extraction date, and links back to the study.
What these figures cannot tell you
- The total fertility rate is a synthetic measure
- It combines the fertility rates of women of different ages observed in one year into a hypothetical lifetime total. No actual cohort of women experiences it. When the age at which women have children is rising, as it has been across Europe, the period measure understates the number of children those women will eventually have.
- Replacement level is a convention, not a constant
- The 2.1 figure assumes mortality and sex ratios typical of a developed country. The exact replacement rate differs slightly between Member States, and this study uses the conventional value because it is the one against which the indicator is universally read.
- Fertility is not population change
- A country below replacement can still grow, through migration or because its age structure produces more births than deaths for a period. Fertility describes one input to population change, not the outcome; the demographic balance is a separate indicator.
- One year, and a volatile one at these levels
- At rates near 1.0 a small absolute change in births moves the rate materially. A single year's reading should not be read as a country's settled position, particularly for the smallest Member States where annual birth counts are low.
Frequently asked questions
- What is the fertility rate in the EU?
- 1.34 children per woman in 2024, against a replacement level of approximately 2.1. Not one of the 27 Member States reaches replacement.
- Which EU country has the highest fertility rate?
- Bulgaria, at 1.72 children per woman in 2024, ahead of France at 1.61 and Slovenia at 1.52. Even the highest rate in the Union falls about a fifth short of replacement level.
- Which EU country has the lowest fertility rate?
- Malta, at 1.01 children per woman in 2024, followed by Spain at 1.10 and Lithuania at 1.11. Ten Member States sit below 1.3, the level demographers describe as lowest-low fertility.
- Does a low fertility rate mean the population is shrinking?
- Not on its own. A country below replacement can still grow through migration, or because its age structure produces more births than deaths for a period. Fertility is one input to population change rather than the outcome.
Methodological note
The total fertility rate is Eurostat's TOTFERRT indicator: the mean number of children a woman would bear over her lifetime under the age-specific fertility rates observed in the reference year. Values are for 2024, the most recent year with complete coverage of the 27 Member States at the extraction date.
The replacement level of approximately 2.1 children per woman is a demographic convention rather than a Eurostat publication, and is used here as the reference against which the indicator is conventionally read.
The count of Member States below 1.3, the distance between the highest and lowest rate, and the shortfall of the highest rate against replacement are derived by Silver Data Lab from the published national rates.
Source data
The underlying series can be inspected and re-downloaded from the Eurostat data browser. The filters below are the ones applied.
Fertility indicators
demo_find
- Filters applied:
- freq=A · indic_de=TOTFERRT · time=2024
- Extracted:
- 2026-10-01
- Source last updated:
- 2026-09-30
Download the data
The data the study you have just read is built on, exactly as it was downloaded and archived.
Yours as a Member.
Data downloadable by Members
How to cite
Record the vintage as well as the study: the figures on this page are the ones extracted on the dates below.
Silver Data Lab Research Desk (2026). In No EU Country Are Enough Babies Born to Replace Their Parents. Silver Data Lab, published 27 June 2026, last updated 11 October 2026. https://www.silverdatalab.com/studies/fertility-in-the-eu
- Data: Eurostat, Fertility indicators (demo_find), filters freq=A, indic_de=TOTFERRT, time=2024; extracted 2026-10-01; source last updated 2026-09-30. https://doi.org/10.2908/demo_find
Silver Data Lab's analysis is licensed CC BY 4.0. The statistics remain their publisher's and keep its terms of reuse.
Ask the research desk
A question about this study — a definition, a filter, a break in the series, what the figures can and cannot support — answered by the desk that made the extraction.
Members can write to the research desk
Other studies on the same dataset
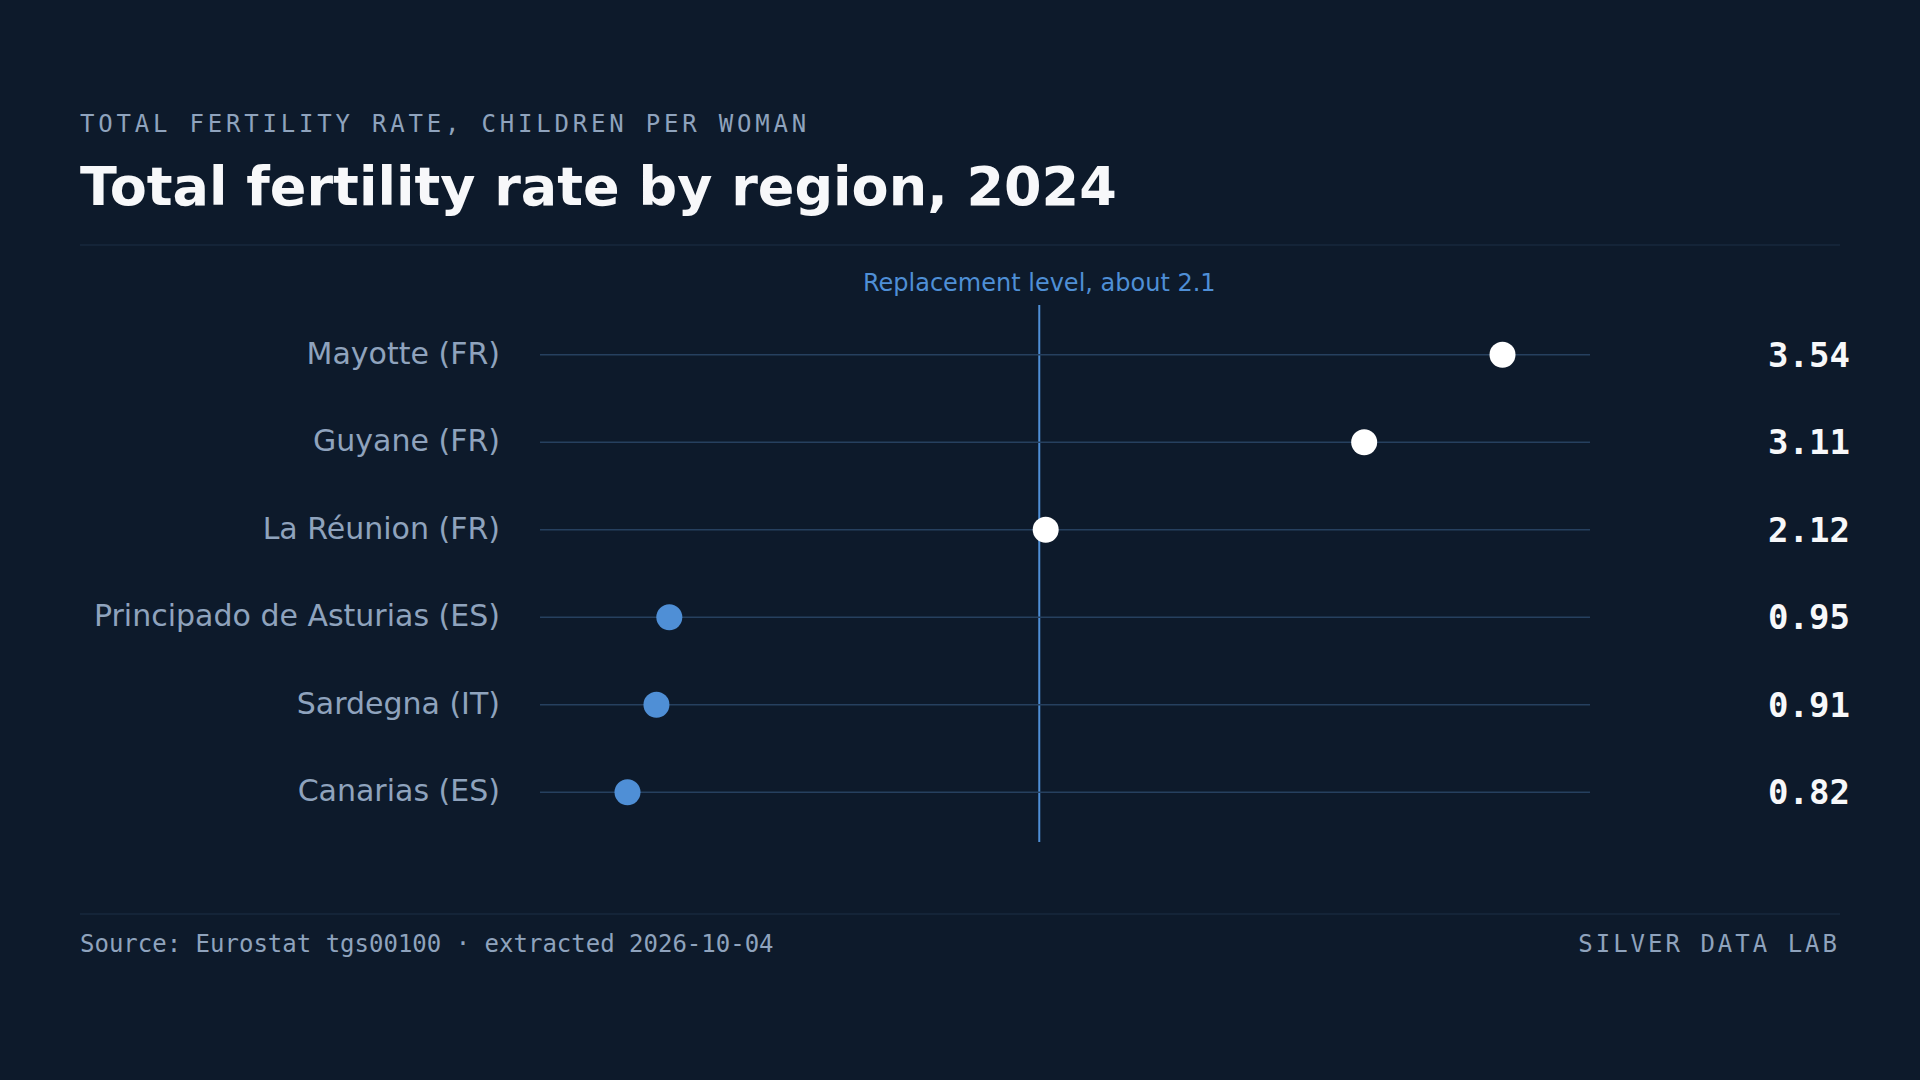
Studies where the same country leads or trails
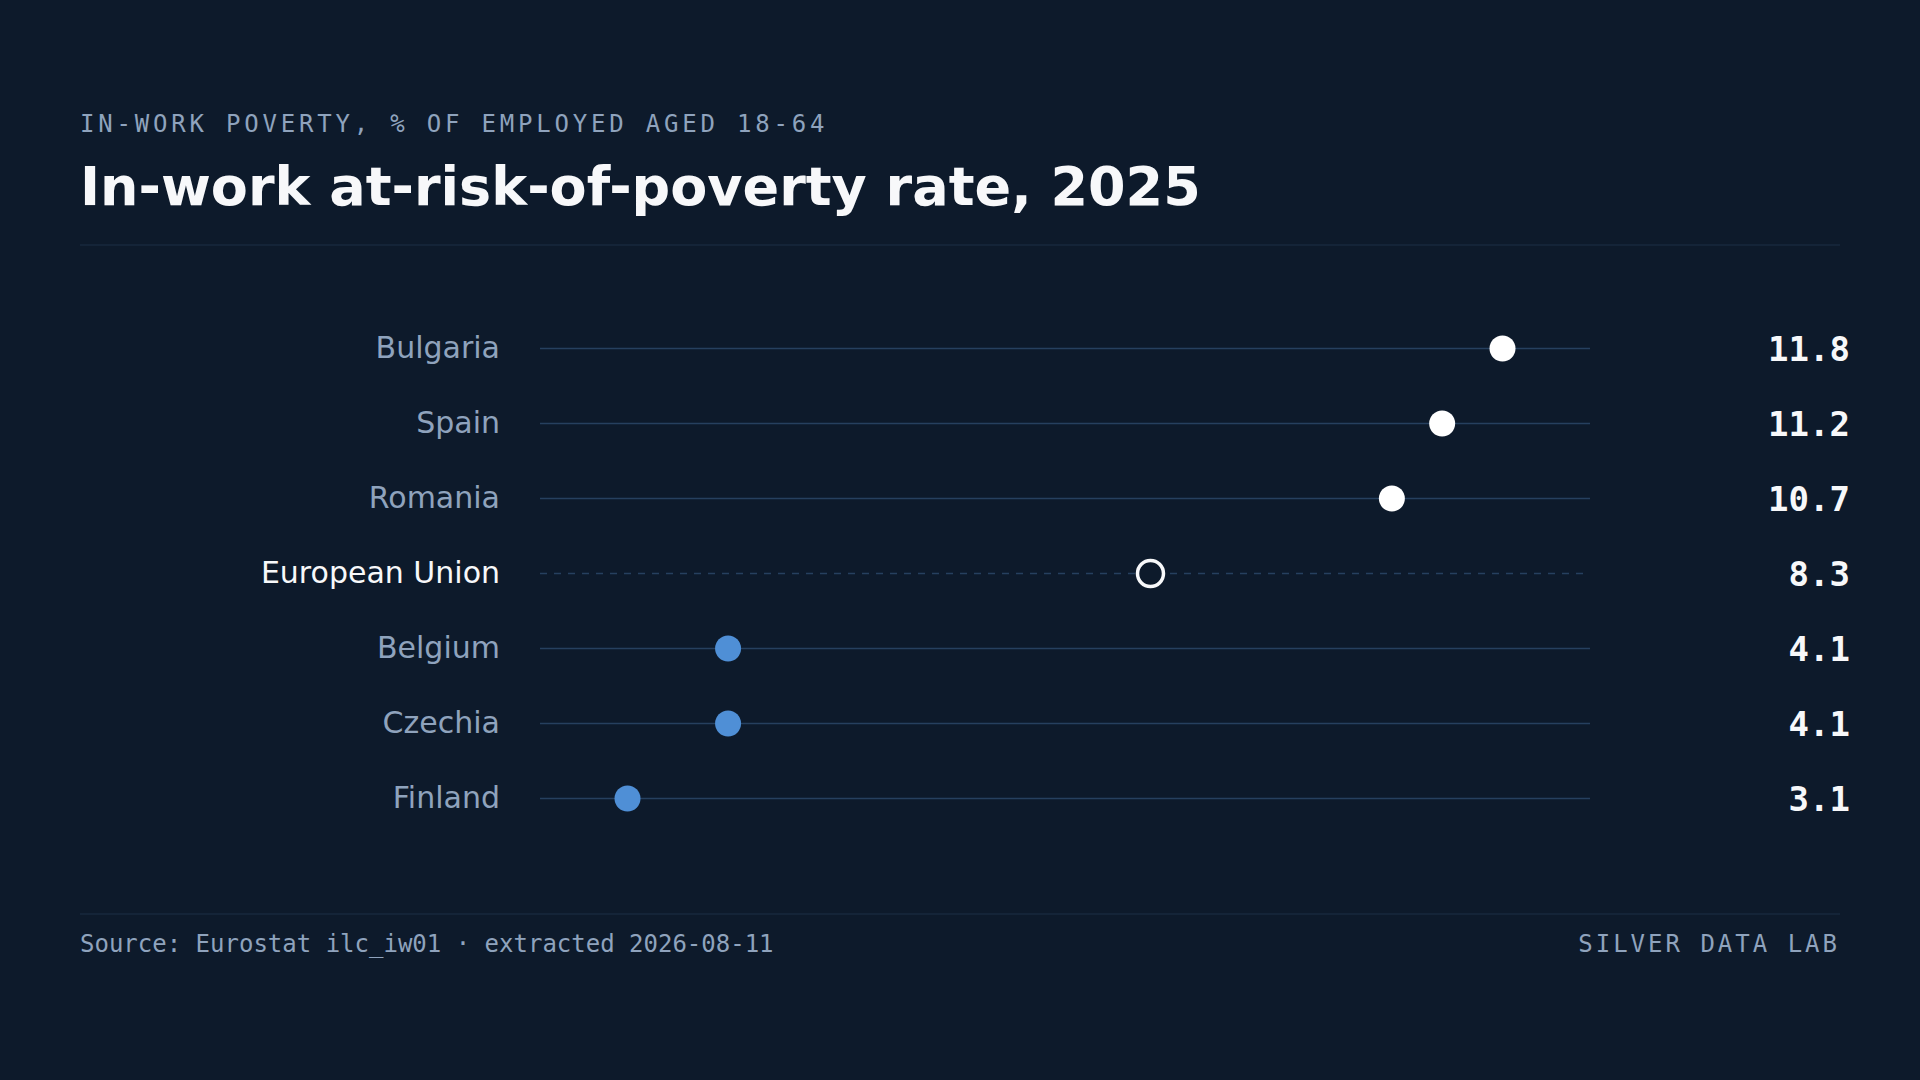
11.8% of Bulgarians With a Job Are Poor, the Highest Share in the EU
8.3% of employed people aged 18 to 64 in the EU lived below the at-risk-of-poverty line in 2025.
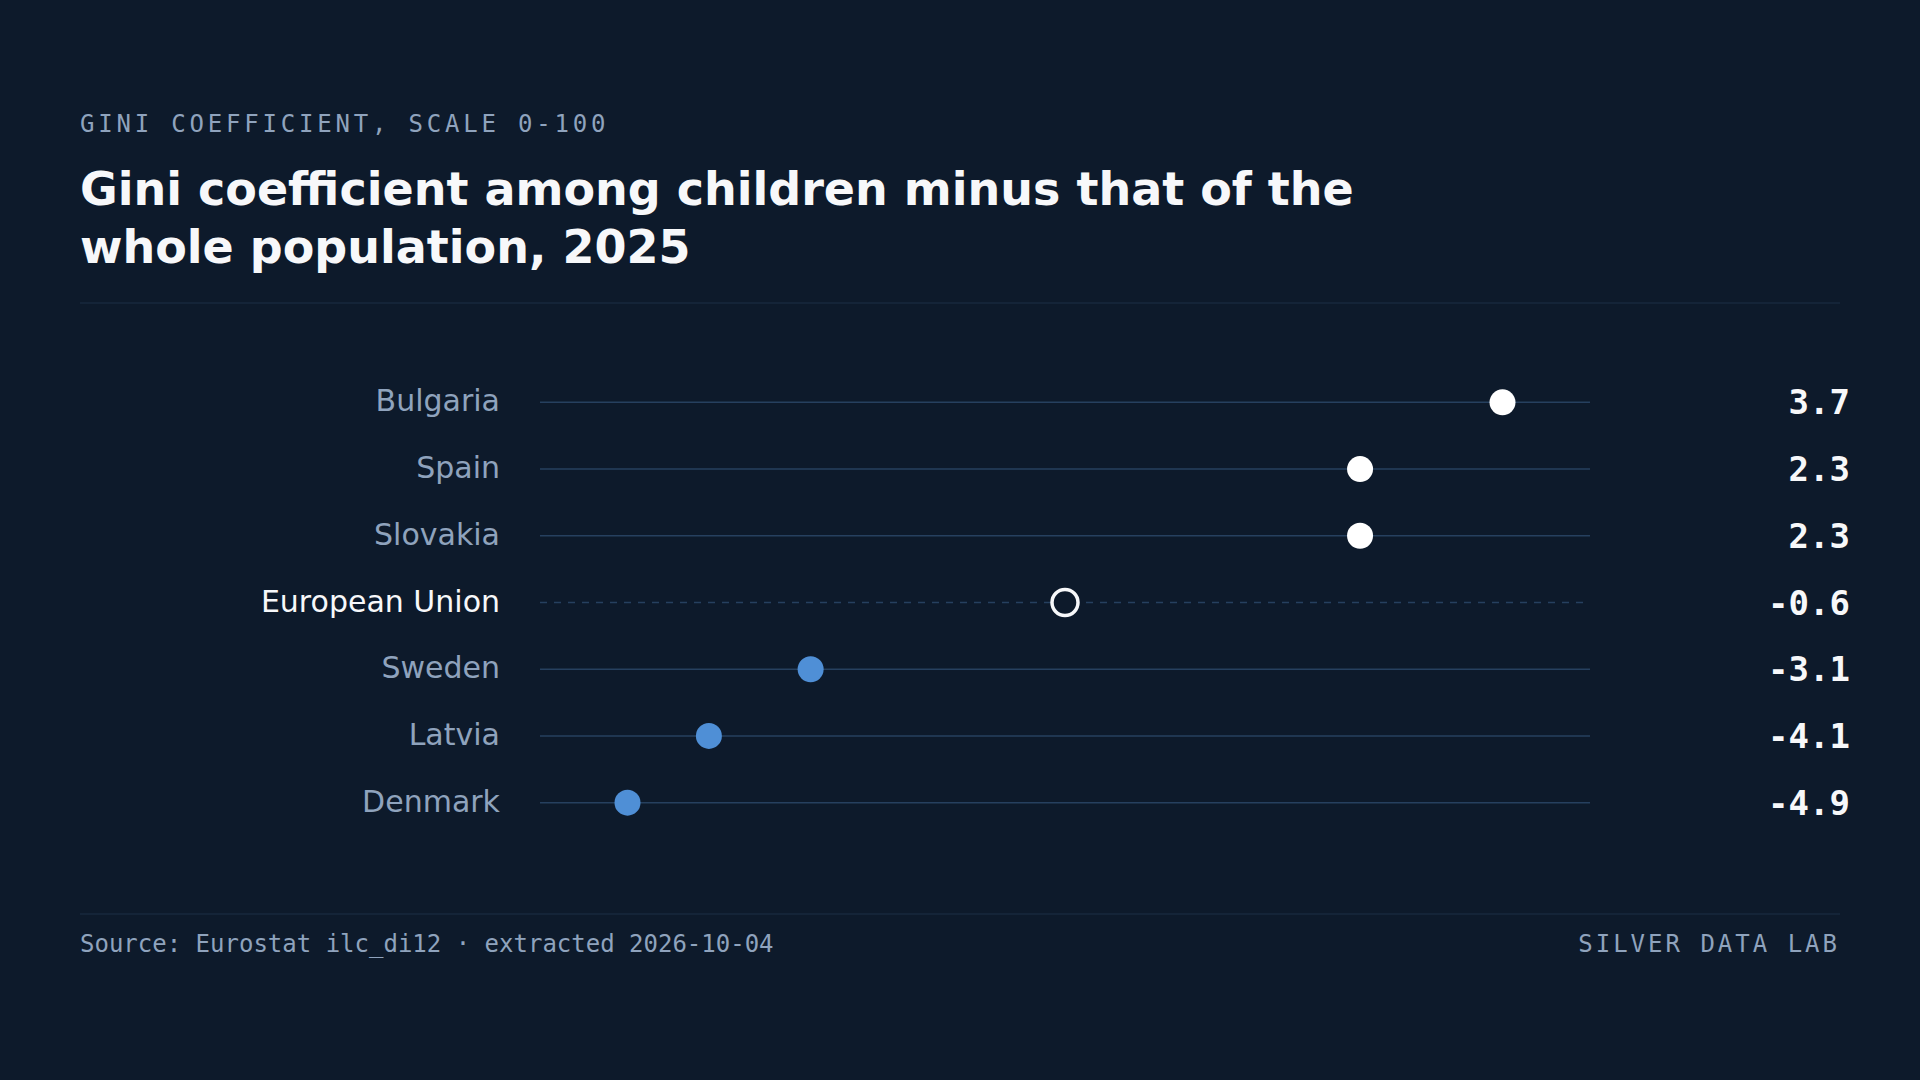
Among EU Children, Family Incomes Are Most Unequal in Bulgaria
Across the EU the Gini coefficient of disposable income among children under 18 was 28.6 in 2025, against 29.2 for the population as a whole.
Austria Already Farms a Quarter of Its Farmland Organically
9.1% of the EU's utilised agricultural area was under organic management in 2020, against a target of 25% by 2030.