Among EU Children, Family Incomes Are Most Unequal in Bulgaria
Silver Data Lab Research Desk · Statistical analysis · Published on 04 October 2026
- Data source
- Eurostat
- Reference period
- 2025
- Last updated
- 11 October 2026
Re-checked against the source on 21 October 2026. 2 values in its datasets moved between snapshots; none is a figure stated on this page. Every revision we have observed →
Key estimates
- Across the EU the Gini coefficient of disposable income among children under 18 was 28.6 in 2025, against 29.2 for the population as a whole.
- In 19 Member States the coefficient is lower for children than for the whole population. Denmark shows the widest difference: 23.3 against 28.2, or 4.9 points, derived by subtraction.
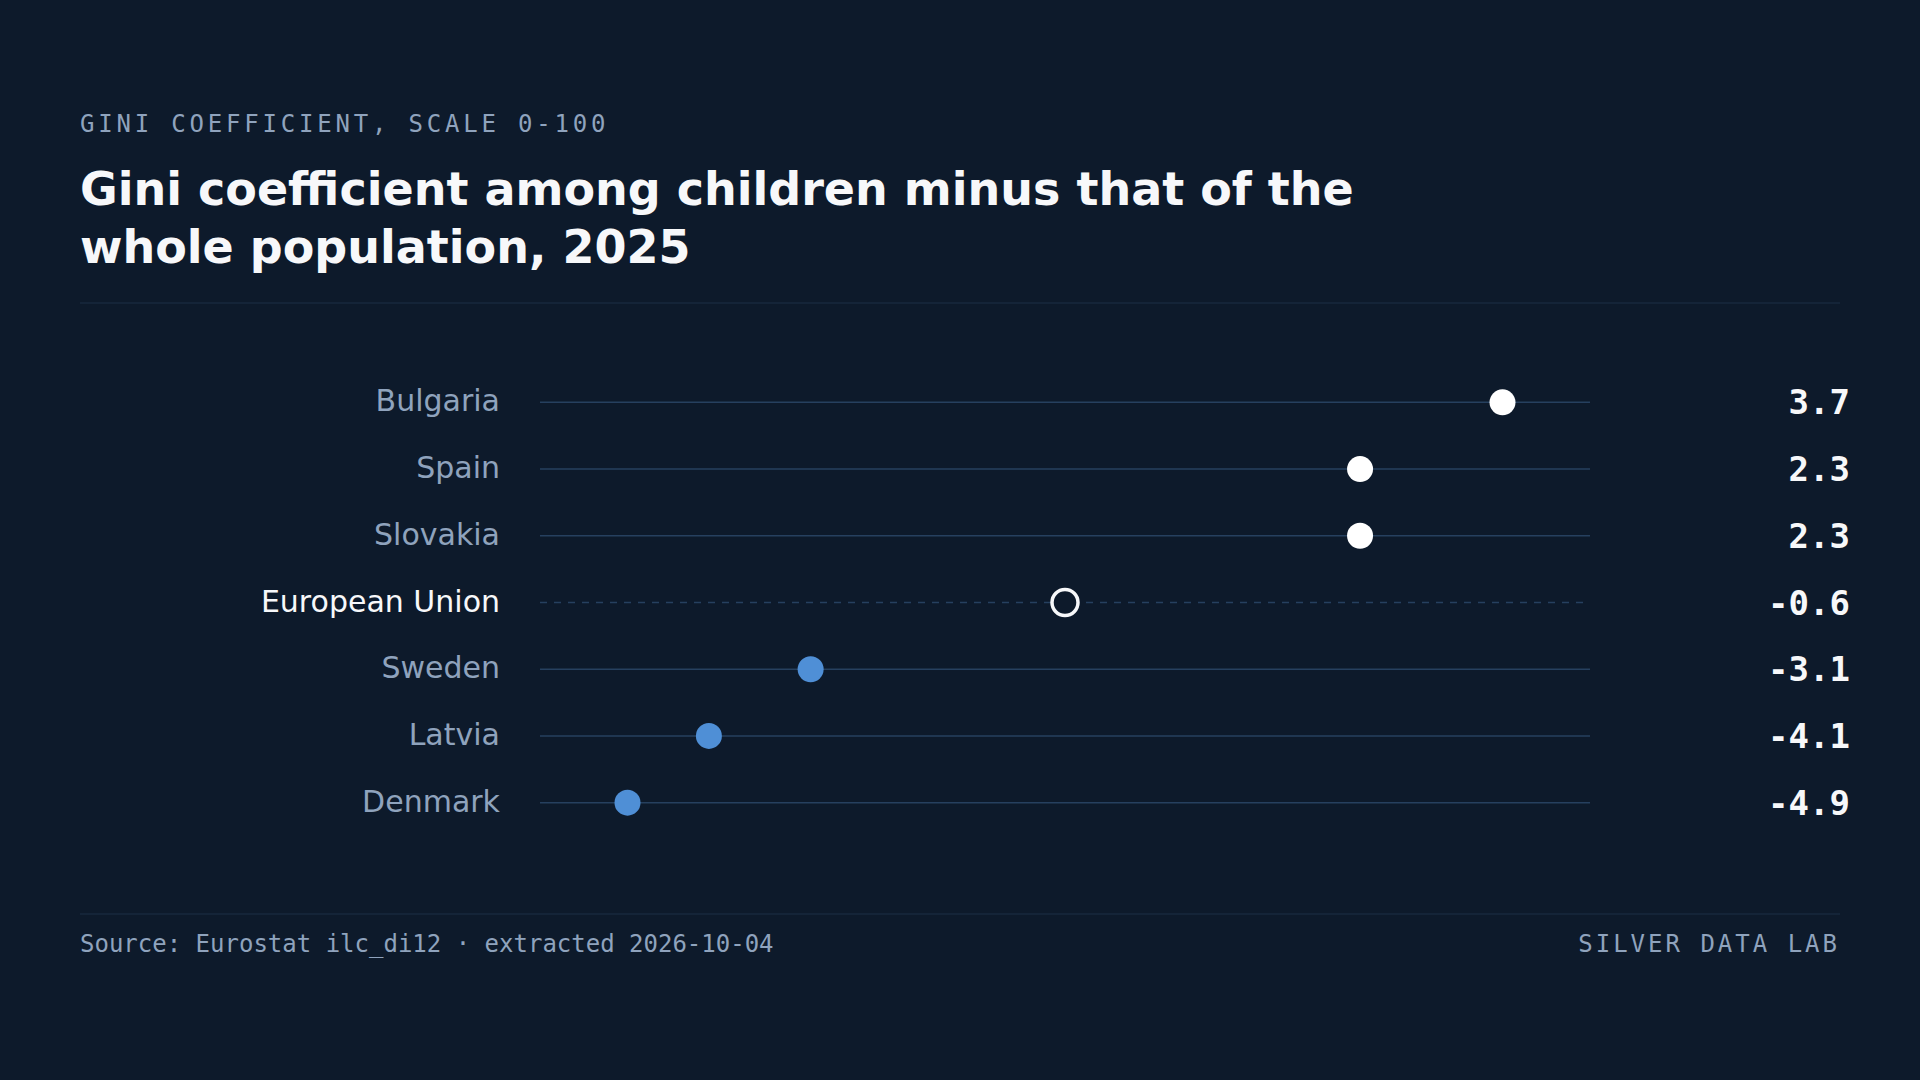
- In the other eight it is higher for children, on the same subtraction: by 3.7 points in Bulgaria, and by 2.3 in both Spain and Slovakia.
- Bulgaria records 41.4 among children, a derived 8.2 points above Lithuania's provisional 33.2; Belgium records the lowest figure in the Union, 20.6.
- Romania's coefficient for children fell from 37.6 in 2014 to 28.8 in 2025, the largest fall of any Member State over the series.
How far apart children's households are
This study measures how unevenly income is spread among the children of each Member State. Eurostat assigns every person under 18 the disposable income of the household he or she lives in — what the household has after taxes and social benefits — adjusted for the number of people it has to support, and then computes a Gini coefficient across all the children in the country.
The Gini coefficient is a standard single-number summary of income inequality. On the scale Eurostat publishes, 0 would mean that every child lived in a household with exactly the same adjusted income, and 100 that a single household held all of it. Between those poles the coefficient equals half the average income difference between two children picked at random, expressed as a percentage of average income. The higher the number, the further apart a country's children live.
The figures come from EU-SILC, the EU Statistics on Income and Living Conditions, the annual household survey behind the Union's income and poverty indicators. Across the EU in 2025 the coefficient for children was 28.6. For the whole population, children included, it was 29.2.
Lower inequality among children in 19 Member States
The EU difference of 0.6 points is modest, and most national figures point the same way. In 19 of the 27 Member States the coefficient for children is below the one for the population as a whole; the differences quoted here are computed by subtracting the second from the first.
Denmark shows the widest difference: 23.3 among children against 28.2 for everyone, 4.9 points apart. Latvia follows at 4.1 points, with 31.5 against 35.6, and Sweden at 3.1, with 25.5 against 28.6. The Netherlands and Belgium are each 2.8 points lower for children.
Latvia shows how far the two measures can drift apart. On the population-wide coefficient it is the second most unequal Member State, behind Bulgaria. Among children it shares fifth place with Greece.
The two coefficients are not computed over the same households. The population-wide figure includes every kind of household — pensioners living alone, students, single adults, couples whose children have left — while the children's figure counts only the under-18s, and so only the households they live in. How much of each national difference comes from that, and how much from the incomes of families themselves, cannot be separated with these two numbers.
Eight Member States where inequality is higher among children
In eight Member States the coefficient is higher for children than for the whole population. Bulgaria leads by a distance: 41.4 among children against 37.7 overall, a difference of 3.7 points. Spain and Slovakia follow at 2.3 points each, then Romania at 1.5, Cyprus and Malta at 0.6, France at 0.3 and Czechia at 0.1. Greece, at 31.5 for children and 31.6 overall, is as near to level as one decimal place allows.
Bulgaria's figure stands out on each comparison made here. At 41.4 it stands 8.2 points above Lithuania, the next Member State at 33.2, and above the population-wide coefficient of every Member State, Bulgaria's own included. It has been the highest children's figure in the Union in eleven of the twelve years published; the exception is 2015, when Lithuania recorded 41.4.
Second place is less settled. Lithuania's 33.2 is a provisional value, and Spain's 33.1 is a tenth of a point behind it.
The most equal country overall, and its children
Slovakia has the lowest population-wide coefficient in the EU, at 23.0. Among its children the figure is 25.3, and six Member States record a lower one: Poland, Czechia, Denmark, the Netherlands, Slovenia and Belgium. Distributing income more evenly than any other Member State across the whole population does not, in Slovakia's case, carry over to the under-18s.
Belgium is the reverse. Its population-wide figure of 23.4 is the second lowest in the Union, and its children's figure of 20.6 is the lowest. The 2025 figure is the first in the series to put Belgium in that position: until 2024 the lowest value belonged to Finland, Slovenia, Slovakia or Denmark. Slovenia follows Belgium at 22.6, then the Netherlands at 23.1.
Twelve years of the children's figure
The children's series used here begins in 2014, and every change quoted in this section is the difference between two published values, computed here. The EU figure was 30.4 in that first year and 28.6 in 2025, the lowest of the twelve values. Eurostat flags a break in the EU series in 2020, meaning a change in how the figures are produced, and the German, French, Danish, Irish and Luxembourgish series break in the same year, so the two ends of the EU series are not strictly comparable.
Romania moved furthest. Its coefficient for children was 37.6 in 2014, peaked at 38.9 in 2016 and was down to 28.8 by 2025, a fall of 8.8 points and the largest in the Union. In five of the six years from 2016 to 2021 Romania had the second highest figure in the EU; in 2025 it sits beside the EU figure. Poland fell by 7.5 points, from 32.1 to 24.6, Greece by 6.2, Latvia by 5.9 and Portugal by 5.2. None of those five series carries a break flag at any point from 2014 to 2025.
Across the 27, the 2025 figure is below the 2014 one in 19 Member States, above it in seven, and unchanged in Sweden at 25.5. Ten Member States have at least one break in their series after 2014, and for them the comparison is indicative rather than exact.
France has the largest rise, from 26.5 to 30.7, which took it from below the EU figure to above it. Both of its large steps up fall in break years: from 26.5 in 2019 to 29.4 in 2020, and from 29.6 in 2021 to 31.2 in 2022. Cyprus, up 3.4 points to 31.8, has the largest rise in a series with no break; Finland rose by 2.1, Malta by 1.2 and Austria by 1.1. Bulgaria rose by 3.0, across a break in 2016.
What the coefficient does not say
A Gini coefficient describes the shape of a distribution and nothing about its level. Each country's children are measured against one another, so Bulgaria's 41.4 and Belgium's 20.6 say how far apart children are inside each country, not how well off they are. A child in the middle of Bulgaria's distribution and a child in the middle of Belgium's are each placed among their own country's children, and neither figure says how the two incomes compare. A companion study on this site looks at children from another angle, counting the share at risk of poverty or social exclusion rather than measuring how far apart they are.
The coefficient also reacts more to changes in the middle of a distribution than to changes at its ends. Two countries with the same value can differ in how far their poorest children fall behind the rest, and a single number cannot show where along the distribution a country's inequality sits.
Gini coefficient among children minus that of the whole population, 2025
| Country | points, children minus whole population | Gap to EU averagederived |
|---|---|---|
| Bulgaria | 3.7 | +4.3 |
| Spain | 2.3 | +2.9 |
| Slovakia | 2.3 | +2.9 |
| European Unionaggregate | -0.6 | — |
| Sweden | -3.1 | −2.5 |
| Latvia | -4.1 | −3.5 |
| Denmark | -4.9 | −4.3 |
This table as data: CSV · JSON
Every Member State for this indicator+
Members see every Member State for this indicator here, not only the rows the ranking prints. Become a Member
Embed this chart
Paste this code into a page. The frame carries the source and the extraction date, and links back to the study.
Gini coefficient of equivalised disposable income, children under 18, 2025
| Country | Gini coefficient, 0-100 | Gap to EU averagederived |
|---|---|---|
| Bulgaria | 41.4 | +12.8 |
| Lithuania | 33.2p | +4.6 |
| Spain | 33.1 | +4.5 |
| European Unionaggregate | 28.6 | — |
| Netherlands | 23.1 | −5.5 |
| Slovenia | 22.6 | −6.0 |
| Belgium | 20.6 | −8.0 |
Flags carried by the source on these values: p provisional
This table as data: CSV · JSON
Every Member State for this indicator+
Members see every Member State for this indicator here, not only the rows the ranking prints. Become a Member
Embed this chart
Paste this code into a page. The frame carries the source and the extraction date, and links back to the study.
What these figures cannot tell you
- Each child carries the household's income
- No child has an income of their own here. Every member of a household is assigned the household's disposable income divided by an equivalence scale — 1 for the first adult, 0.5 for each further person aged 14 or over, 0.3 for each child under 14 — so the coefficient compares households with children, and its level depends on that convention for what an extra person costs.
- Breaks in the series
- Eurostat flags a break for the EU aggregate in 2020 and for ten Member States at some point between 2016 and 2025: Belgium, Bulgaria, Denmark, Germany, Ireland, France, Croatia, Luxembourg, Hungary and the Netherlands. Values either side of a break are not fully comparable. Luxembourg's 2025 figure itself carries the flag; Estonia's first value, for 2014, carries it too, marking a break with years before this table begins; and Lithuania's values for 2024 and 2025 are provisional.
- Last year's income
- EU-SILC asks about income over a reference period that precedes the interview, in most countries the previous calendar year. The 2025 coefficients therefore describe, for the most part, incomes received in 2024.
- A survey sample, and a smaller one for children
- The coefficient is estimated from a household sample, and children are only part of it. National figures can move noticeably from one year to the next: Hungary's went from 29.5 in 2023 to 25.7 in 2024 and 28.9 in 2025, Malta's from 33.7 to 29.8 over the same two years. A gap of a few tenths between two countries is within that kind of movement.
Frequently asked questions
- What is the Gini coefficient for children in the EU?
- 28.6 in 2025, on a scale from 0 to 100, for people aged under 18, against 29.2 for the whole population. Each child is assigned the size-adjusted disposable income of the household he or she lives in.
- Which EU country has the most unequal incomes among children?
- Bulgaria, at 41.4 in 2025, followed by Lithuania at 33.2, a provisional value, and Spain at 33.1. Belgium has the lowest figure at 20.6, ahead of Slovenia at 22.6 and the Netherlands at 23.1.
- Is income more unequal among children than among adults?
- The dataset used here sets children beside the whole population, children included, rather than beside adults alone. On that comparison children are the more equal group in most of the EU: their coefficient is lower in 19 Member States, by as much as 4.9 points in Denmark, a difference derived from 23.3 against 28.2. In eight it is higher, most of all in Bulgaria, at 41.4 against 37.7.
- Has income inequality among children fallen?
- Across the EU the coefficient went from 30.4 in 2014 to 28.6 in 2025, with a break in the series in 2020. It is lower than in 2014 in 19 Member States; Romania fell furthest, from 37.6 to 28.8, while France rose most, from 26.5 to 30.7, across two breaks in its own series.
Methodological note
The indicator is Eurostat's Gini coefficient of equivalised disposable income for the population aged under 18, from EU-SILC, on a scale from 0 to 100. Equivalised disposable income is total household income after taxes and social transfers, divided by the modified OECD equivalence scale and attributed to every member of the household. The Gini coefficient equals half the mean absolute difference between the incomes of two people drawn at random, divided by the mean income.
The children's series runs from 2014 to 2025 and covers all 27 Member States in every year. The EU figure is Eurostat's own aggregate for the 27 Member States and is used as published. The population-wide coefficient for 2025 is read from the dataset the children's table is drawn from, which publishes both age groups side by side; its 2025 values for children match the children's table exactly for every Member State and for the EU.
Eurostat's observation flags are read from the same two files: the breaks in series listed under the limitations, Estonia's on its 2014 value included, and provisional values for Lithuania in 2024 and 2025.
Silver Data Lab derived the following from the published coefficients, by subtraction or by counting: the difference between the children's and the population-wide coefficient for each Member State and for the EU, the changes between 2014 and 2025 and from one year to another, the distances between Bulgaria and Lithuania and between Lithuania and Spain, the counts of Member States above or below a given figure, and each country's position in a ranking. Nothing else is computed.
Source data
This study draws on 2 datasets from Eurostat. Each can be inspected and re-downloaded from its catalogue, and the filters below are the ones applied.
Gini coefficient of equivalised disposable income for children (aged less than 18)
tessi191
- Filters applied:
- freq=A · age=Y_LT18 · statinfo=GINI_HND
- Extracted:
- 2026-10-21
- Source last updated:
- 2026-10-20
Gini coefficient of equivalised disposable income by age
ilc_di12
- Filters applied:
- freq=A · age=TOTAL, Y_LT18 · statinfo=GINI_HND · time=2025
- Extracted:
- 2026-10-21
- Source last updated:
- 2026-10-20
Download the data
The data the study you have just read is built on, exactly as it was downloaded and archived.
Yours as a Member.
Data downloadable by Members
How to cite
Record the vintage as well as the study: the figures on this page are the ones extracted on the dates below.
Silver Data Lab Research Desk (2026). Among EU Children, Family Incomes Are Most Unequal in Bulgaria. Silver Data Lab, published 04 October 2026, last updated 11 October 2026. https://www.silverdatalab.com/studies/child-income-inequality-in-the-eu
- Data: Eurostat, Gini coefficient of equivalised disposable income for children (aged less than 18) (tessi191), filters freq=A, age=Y_LT18, statinfo=GINI_HND; extracted 2026-10-21; source last updated 2026-10-20. https://doi.org/10.2908/tessi191
- Data: Eurostat, Gini coefficient of equivalised disposable income by age (ilc_di12), filters freq=A, age=TOTAL, Y_LT18, statinfo=GINI_HND, time=2025; extracted 2026-10-21; source last updated 2026-10-20. https://doi.org/10.2908/ilc_di12
Silver Data Lab's analysis is licensed CC BY 4.0. The statistics remain their publisher's and keep its terms of reuse.
Ask the research desk
A question about this study — a definition, a filter, a break in the series, what the figures can and cannot support — answered by the desk that made the extraction.
Members can write to the research desk
Studies where the same country leads or trails
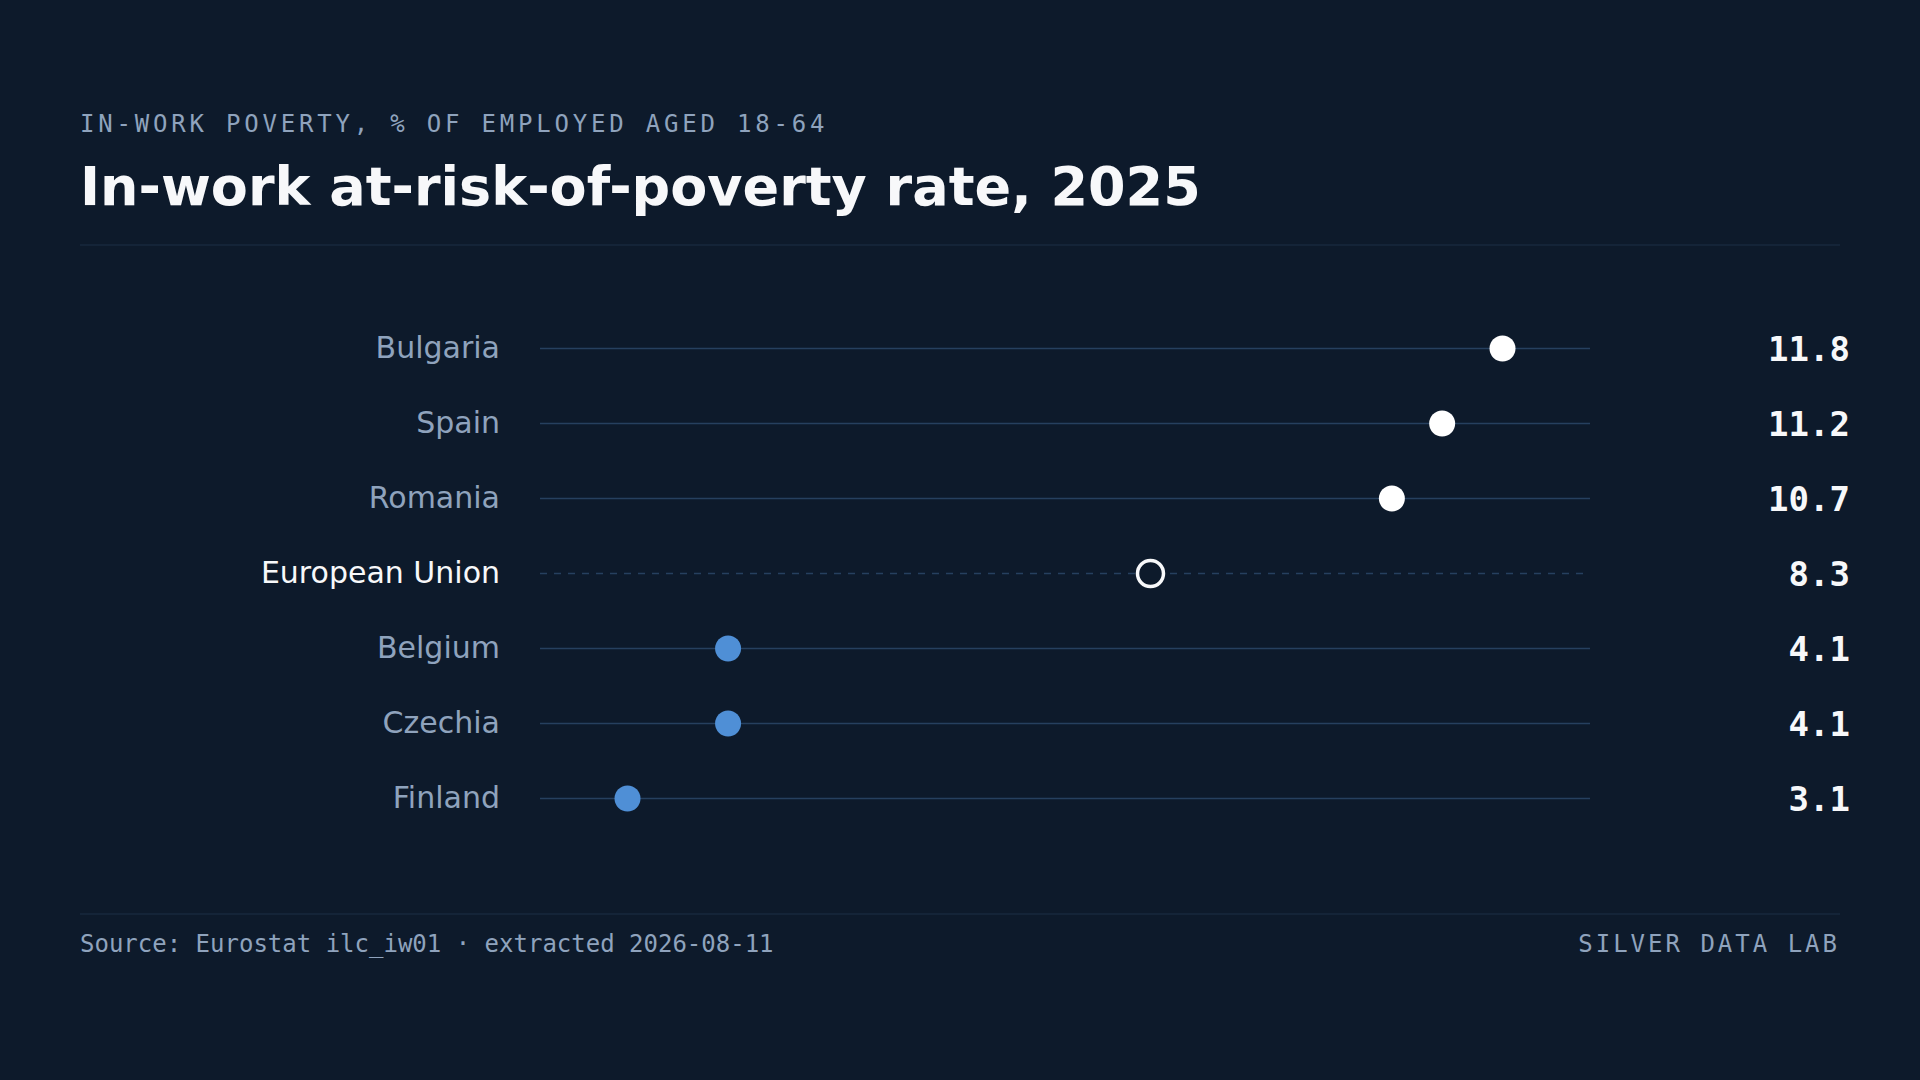
11.8% of Bulgarians With a Job Are Poor, the Highest Share in the EU
8.3% of employed people aged 18 to 64 in the EU lived below the at-risk-of-poverty line in 2025.
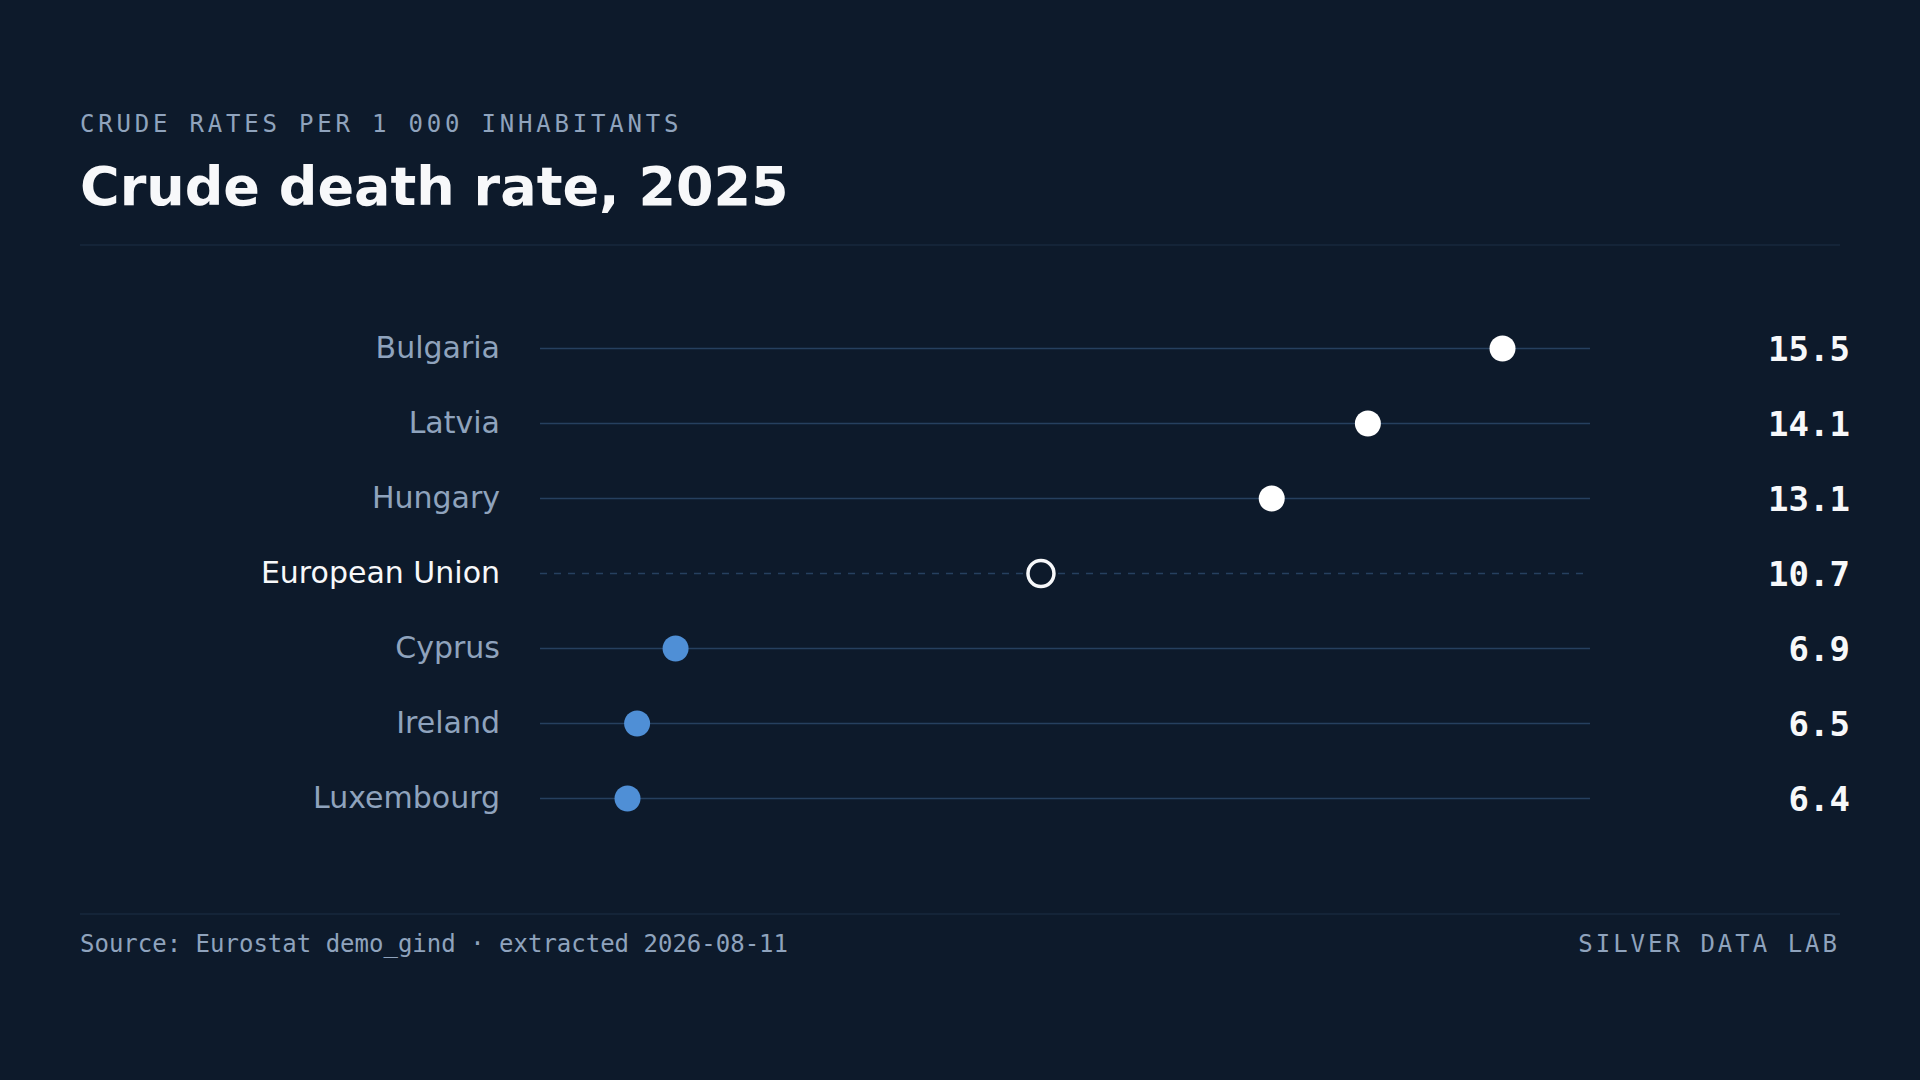
Deaths Outnumber Births in Twenty-One EU Countries
The EU recorded 7.7 births and 10.7 deaths per thousand inhabitants in 2025: a natural change of −3.0.
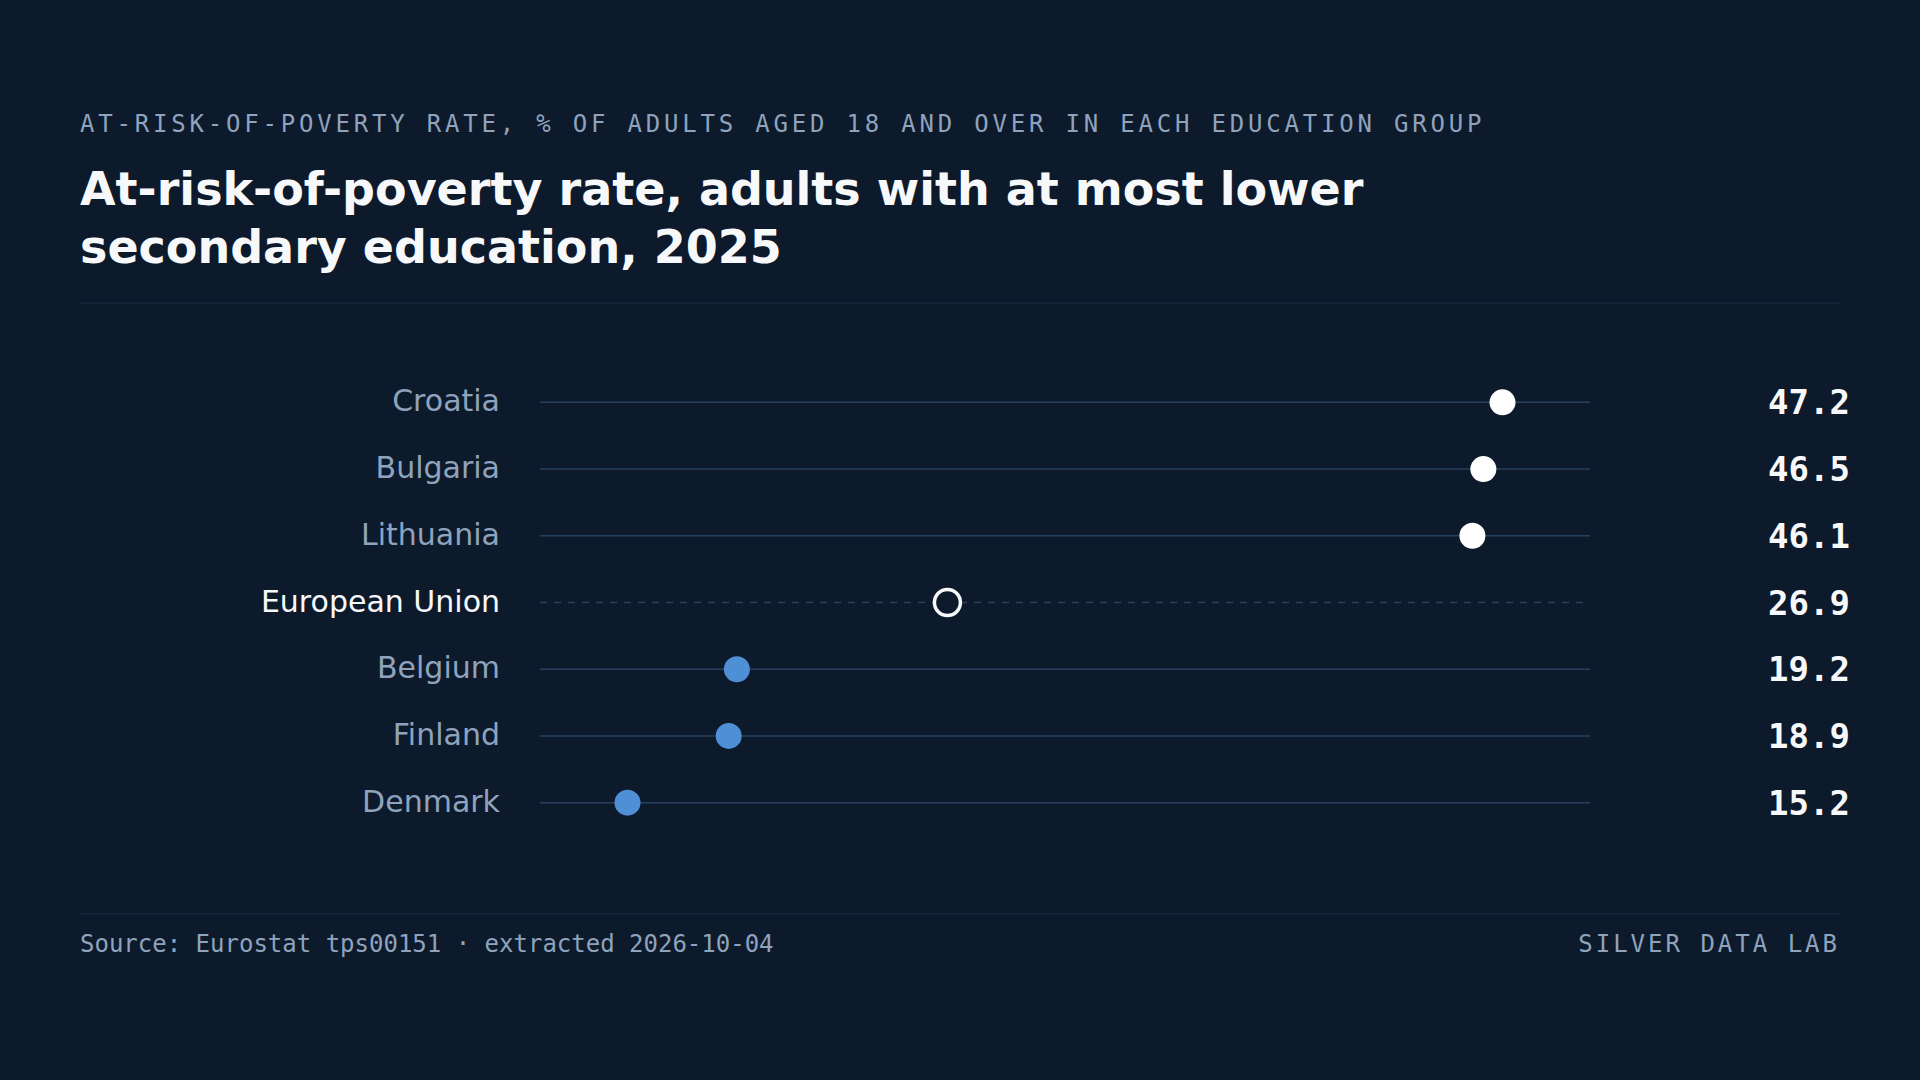
In Every EU Country, the Risk of Poverty Falls as Education Rises
Across the EU in 2025, 26.9% of adults with at most lower secondary education were at risk of poverty, against 14.7% of those with upper secondary education and 7.7% of graduates.