In Every EU Country, the Risk of Poverty Falls as Education Rises
Silver Data Lab Research Desk · Statistical analysis · Published on 04 October 2026
- Data source
- Eurostat
- Reference period
- 2025
- Last updated
- 11 October 2026
Re-checked against the source on 21 October 2026. 36 values in its datasets moved between snapshots; none is a figure stated on this page. Every revision we have observed →
Key estimates
- Across the EU in 2025, 26.9% of adults with at most lower secondary education were at risk of poverty, against 14.7% of those with upper secondary education and 7.7% of graduates.
- The rate is lower at each higher level of education in all 27 Member States; in twenty of them the rate for the least educated is more than three times the graduate rate.
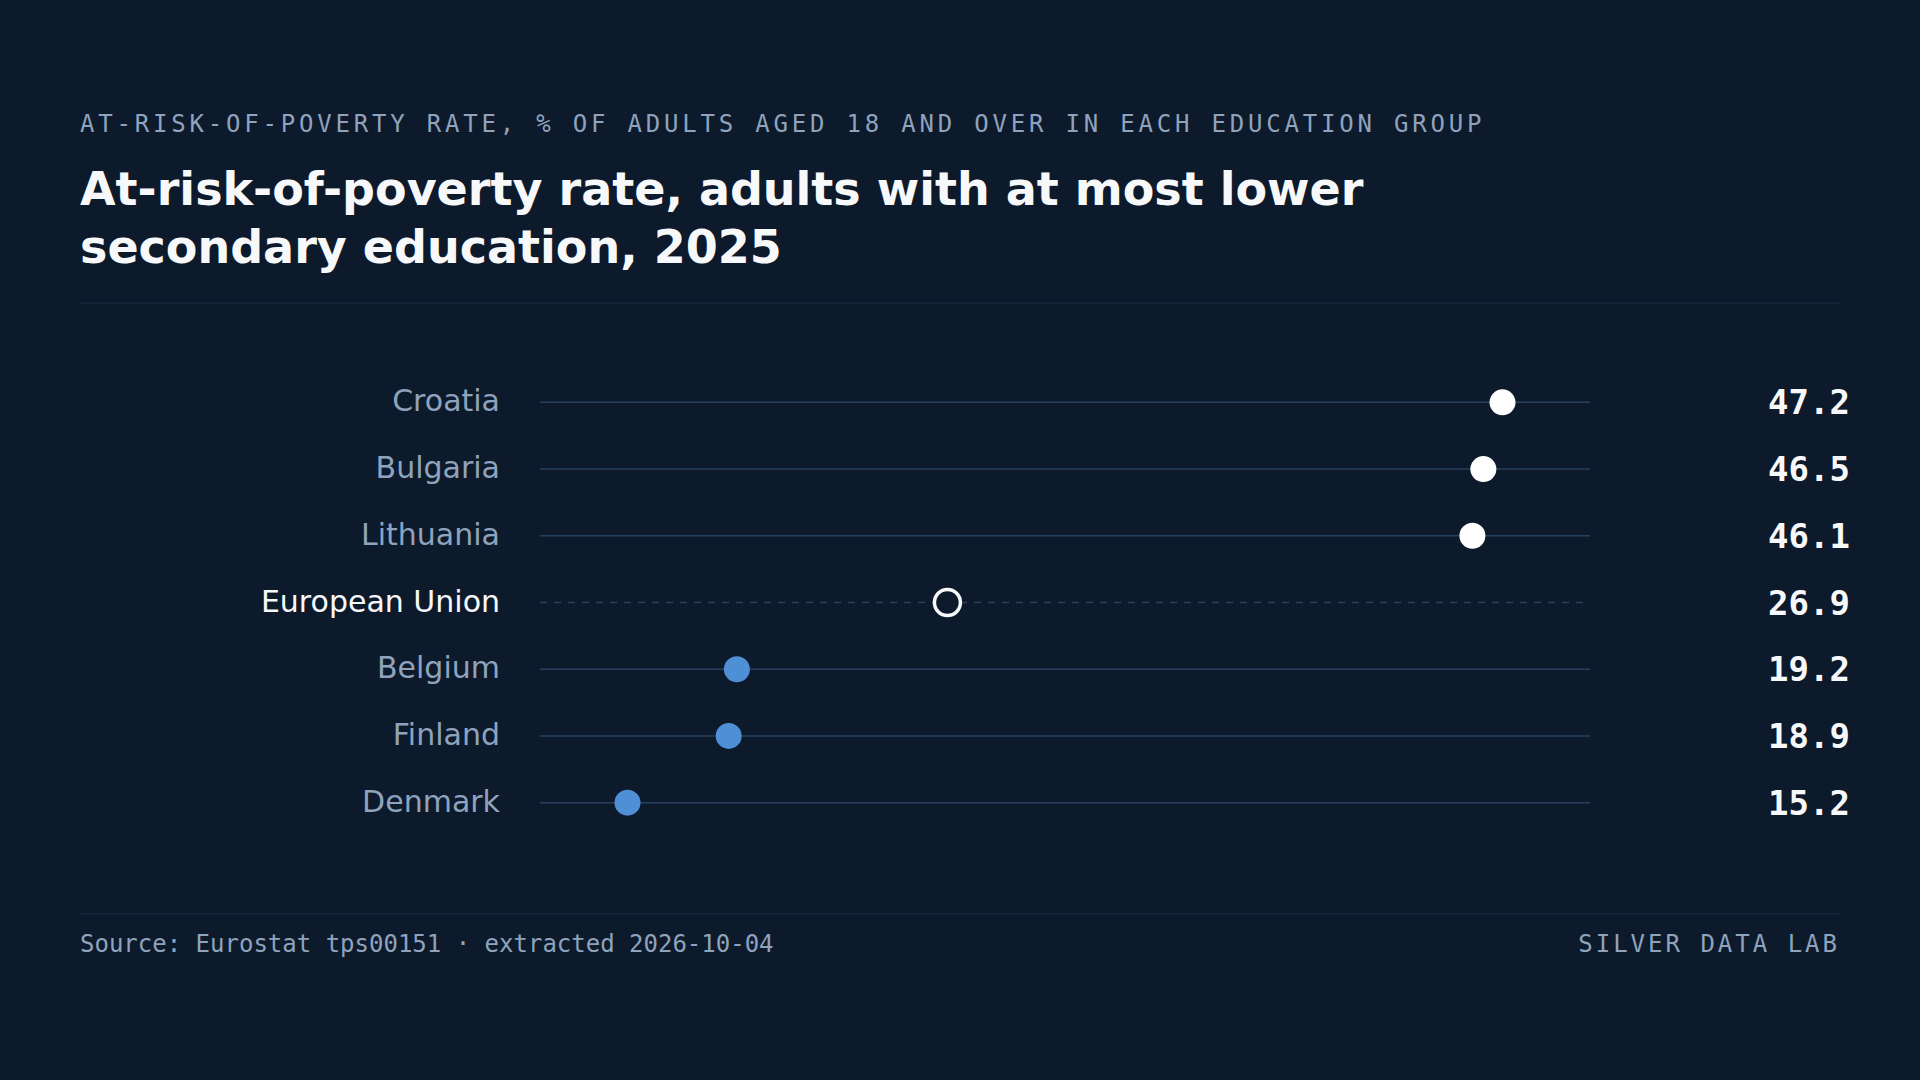
- Croatia records 47.2% for adults without upper secondary education, Bulgaria 46.5% and Lithuania 46.1%. Denmark records 15.2%, Finland 18.9% and Belgium 19.2%.
- Graduates are most exposed in Estonia at 13.7%, Latvia at 11.9% and Austria at 11.6%, and least in Romania at 1.0%.
- The distance between the least educated and graduates, derived by subtraction, is 40.2 points in Croatia, 19.2 across the EU and 6.0 in Denmark.
Three education groups, one income line
The at-risk-of-poverty rate counts people whose household income, adjusted for the number and age of the people it has to support, falls below 60% of the median in their own country. Eurostat publishes it for adults aged 18 and over, split by the highest level of education each person has completed. The levels follow ISCED, the International Standard Classification of Education, grouped in three: at most lower secondary school; upper secondary or post-secondary courses below university level; and tertiary education, which takes in university degrees and equivalent higher vocational qualifications.
This is the income test alone. The EU's headline social indicator, at risk of poverty or social exclusion, also counts severe material and social deprivation and very low work intensity. Because it adds conditions to the income test, its rate for any group can only equal or exceed the one shown here, and the two are different measures rather than two readings of the same one.
In 2025, 26.9% of EU adults whose schooling ended at lower secondary level or earlier were below the line. For adults with upper secondary education the rate was 14.7%, and for graduates 7.7%. On those published rates, the least educated group is about three and a half times as likely to be at risk of poverty as the most educated, a ratio computed here.
The same order in every Member State
The ranking of the three groups never changes. In each of the 27 Member States the least educated group has the highest rate, upper secondary comes second and graduates have the lowest, and in twenty of them the rate for the least educated is more than three times the rate for graduates.
So the existence of the gradient is not in question anywhere in the Union. What separates the countries is its depth, and the point on the way up at which the risk falls.
Where adults without upper secondary education are most exposed
Croatia records the highest rate for this group, at 47.2%. Bulgaria follows at 46.5%, Lithuania at 46.1%, Latvia at 43.7% and Cyprus at 40.3%. In those five Member States at least two adults in five with this level of schooling live in a household below the line.
The lowest rates are in Denmark at 15.2%, Finland at 18.9% and Belgium at 19.2%, the only three below 20%. Fourteen Member States are above the EU rate of 26.9% and thirteen below it.
Graduates, ranked on their own
Among graduates the order is a different one. Estonia records the highest rate at 13.7%, then Latvia at 11.9%, Austria at 11.6%, Lithuania at 11.0% and Malta at 10.4%. At the bottom are Romania at 1.0%, Hungary at 3.1%, Czechia at 3.5% and Cyprus at 4.1%.
Romania and Cyprus are among the six highest rates for the least educated and among the four lowest for graduates: 39.8% against 1.0% in Romania, 40.3% against 4.1% in Cyprus. Austria runs the other way. Its rate for the least educated, 28.2%, is close to the EU figure, while its graduates are more exposed than those of every Member State except Estonia and Latvia.
Where the largest drop in poverty risk occurs
Setting the three rates side by side, as differences in percentage points derived from the published figures, shows that the risk falls at different steps in different places.
In Bulgaria, Croatia and Romania most of the fall comes with upper secondary education. The rate is 29.2 points lower for that group than for the least educated in Bulgaria, 28.7 points lower in Croatia and 28.4 in Romania, the three largest such differences in the EU. Between upper secondary education and a degree the rate drops by a further 9.6 points in Bulgaria, 11.5 in Croatia and 10.4 in Romania.
Denmark and Finland show little difference at that first step: 1.4 points in Denmark, from 15.2% to 13.8%, and 2.2 points in Finland, from 18.9% to 16.7%. In Finland the larger fall comes with tertiary education, 11.2 points down to 5.5%. Denmark has the smallest gap in the Union between its least educated adults and its graduates, and it is the only Member State where the rate for the first group is less than double the rate for the second.
The three Baltic states are above the EU rate at every level. Lithuania at 30.9%, Latvia at 28.3% and Estonia at 25.5% hold the three highest rates in the EU for adults with upper secondary education, and between them three of the four highest for graduates. Graduates there are less exposed than other adults, as they are everywhere, but all three countries remain above the EU graduate rate.
Austria is a case of its own. Its graduates, at 11.6%, are almost as exposed as its adults with upper secondary education, at 12.4%: a difference of 0.8 points, the smallest between those two groups in any Member State. Sweden follows at 2.6 points and Slovakia at 3.0.
A poverty line set separately in each country
Because the threshold is set at 60% of each country's own median, a rate locates people within their own society and says nothing about an income that could be compared across borders. Romania's 1.0% does not mean that Romanian graduates are richer than Austrian ones at 11.6%. It means that very few Romanian graduates fall into the lower part of the Romanian income distribution, while more Austrian graduates fall into the lower part of the Austrian one.
For the same reason a deep gradient is not a measure of what education earns. It can also depend on how unequal incomes are, on who makes up each group and on the households they live in, and this table records none of those things.
The EU series since 2015
The EU aggregate begins in 2015. Since then the rate for the least educated has stayed between 25.6% and 26.9%, and the 2025 value matches 2021 as the highest in the series. Graduates have stayed between 7.3% and 8.0%. Subtracting one published rate from the other, the distance between the two groups has widened from 17.8 points in 2015 to 19.2 in 2025.
National series moved further. In Cyprus the rate for the least educated rose from 27.8% in 2015 to 40.3% in 2025, the largest increase in the Union, with no break in series flagged along the way. Croatia went from 37.9% to 47.2% and the Netherlands from 11.6% to 22.7%, but Eurostat flags breaks in both series within the period, so neither change is fully comparable. Estonia moved the other way, from 36.6% to 31.5%, the largest fall in a series with no break flagged along the way; Belgium's rate fell further, from 24.9% to 19.2%, but across a break in 2019.
Who sits in each group
Education here is the highest level completed, for everyone aged 18 or over. An 18-year-old still at upper secondary school counts in the lowest group until the qualification is awarded, a university student in the middle group until graduation, and a pensioner who left school decades ago in the same group as a young adult who left last year. The table gives no breakdown by age or by activity, so it cannot separate the poverty risk attached to little schooling from the risk attached to being a student, retired or out of work.
At-risk-of-poverty rate, adults with at most lower secondary education, 2025
| Country | % of adults aged 18+ in the group | Gap to EU averagepercentage points, derived |
|---|---|---|
| Croatia | 47.2 | +20.3 |
| Bulgaria | 46.5 | +19.6 |
| Lithuania | 46.1p | +19.2 |
| European Unionaggregate | 26.9 | — |
| Belgium | 19.2 | −7.7 |
| Finland | 18.9 | −8.0 |
| Denmark | 15.2 | −11.7 |
Flags carried by the source on these values: p provisional
This table as data: CSV · JSON
Every Member State for this indicator+
Members see every Member State for this indicator here, not only the rows the ranking prints. Become a Member
Embed this chart
Paste this code into a page. The frame carries the source and the extraction date, and links back to the study.
At-risk-of-poverty rate, tertiary graduates, 2025
| Country | % of adults aged 18+ in the group | Gap to EU averagepercentage points, derived |
|---|---|---|
| Estonia | 13.7 | +6.0 |
| Latvia | 11.9 | +4.2 |
| Austria | 11.6 | +3.9 |
| European Unionaggregate | 7.7 | — |
| Czechia | 3.5 | −4.2 |
| Hungary | 3.1 | −4.6 |
| Romania | 1.0 | −6.7 |
This table as data: CSV · JSON
Every Member State for this indicator+
Members see every Member State for this indicator here, not only the rows the ranking prints. Become a Member
Embed this chart
Paste this code into a page. The frame carries the source and the extraction date, and links back to the study.
Gap in poverty risk between the least educated and graduates, 2025
| Country | percentage points, ISCED 0-2 minus ISCED 5-8 | Gap to EU averagepercentage points, derived |
|---|---|---|
| Croatia | 40.2 | +21.0 |
| Bulgaria | 38.8 | +19.6 |
| Romania | 38.8 | +19.6 |
| European Unionaggregate | 19.2 | — |
| Finland | 13.4 | −5.8 |
| Malta | 11.5 | −7.7 |
| Denmark | 6.0 | −13.2 |
This table as data: CSV · JSON
Every Member State for this indicator+
Members see every Member State for this indicator here, not only the rows the ranking prints. Become a Member
Embed this chart
Paste this code into a page. The frame carries the source and the extraction date, and links back to the study.
What these figures cannot tell you
- An income measure, set nationally
- A person is counted when their household's equivalised disposable income, meaning income after taxes and social transfers scaled to the size and age make-up of the household, is below 60% of the national median. The threshold is a different sum of money in every Member State, so the rates compare positions within each country rather than living standards between them, and they say nothing directly about deprivation or work.
- Education is the highest level completed
- Each adult is classified by the highest ISCED level successfully completed, whatever their age. Young adults still studying sit in a lower group than the one they are working towards, and the table offers no split by age, so each group mixes students, people of working age and pensioners in proportions that differ between countries.
- Incomes refer to the year before the survey
- In most Member States EU-SILC, the EU statistics on income and living conditions, collects income for the calendar year preceding the survey. The 2025 rates therefore describe incomes received largely in 2024, classified by the education people reported in 2025.
- Flags, breaks and the size of each group
- Lithuania's 2025 values are provisional and Luxembourg's carry a break in series. Eurostat also flags breaks in several national series over the decade, among them Croatia in 2023 and 2024, the Netherlands in 2016 and Belgium in 2019. Each rate is a survey estimate, and a single education group in a small Member State rests on a fraction of its national sample, so small differences should not be read as rankings.
Frequently asked questions
- Does education lower the risk of poverty in the EU?
- The two go together in every Member State. In 2025, 26.9% of EU adults with at most lower secondary education were at risk of poverty, 14.7% of those with upper secondary education and 7.7% of graduates, and the same order holds in all 27 countries. The table shows an association, not its cause.
- Where are people with low education most at risk of poverty?
- In Croatia, where 47.2% of adults whose schooling stopped at lower secondary level or below were at risk of poverty in 2025, followed by Bulgaria at 46.5% and Lithuania at 46.1%. The lowest rates were in Denmark at 15.2%, Finland at 18.9% and Belgium at 19.2%.
- Can university graduates be at risk of poverty?
- Yes, though less often than adults with less schooling. In 2025, 7.7% of EU graduates were below the line. The rate reached 13.7% in Estonia, 11.9% in Latvia and 11.6% in Austria, and was 1.0% in Romania, the lowest in the Union.
- Is the at-risk-of-poverty rate the same as poverty or social exclusion?
- No. The at-risk-of-poverty rate is an income test only: household income below 60% of the national median. The EU's headline measure, at risk of poverty or social exclusion, also counts severe material and social deprivation and very low work intensity. For the same population it can never be lower than the income test, so a rate from one should not be quoted as if it came from the other.
Methodological note
The indicator is Eurostat's at-risk-of-poverty rate by highest level of education attained, a table drawn from EU-SILC: the share of persons aged 18 and over whose equivalised disposable income is below 60% of the national median equivalised income. It is published for three groups of the ISCED 2011 classification: levels 0 to 2 (at most lower secondary), levels 3 and 4 (upper secondary and post-secondary non-tertiary) and levels 5 to 8 (tertiary).
The rankings use 2025, the latest year, which covers all 27 Member States. The series runs from 2014 for national figures and from 2015 for the EU aggregate, which is Eurostat's own and is used as published. The table publishes no rate for all education levels combined, and none is computed here.
Silver Data Lab derived the following by arithmetic on the published rates: the differences in percentage points between education groups (least educated minus graduates, least educated minus upper secondary, upper secondary minus graduates), including the third ranking; the ratio of the EU rate for the least educated to the EU graduate rate; the changes between 2015 and 2025; and the counts of Member States above or below a given rate or ratio. Nothing else is computed.
Source data
The underlying series can be inspected and re-downloaded from the Eurostat data browser. The filters below are the ones applied.
At-risk-of-poverty-rate, by highest level of education attained
tps00151
- Filters applied:
- freq=A · statinfo=MED_EI · isced11=ED0-2, ED3_4, ED5-8 · rskpovth=B_60 · sex=T · age=Y_GE18 · unit=PC
- Extracted:
- 2026-10-21
- Source last updated:
- 2026-10-20
Download the data
The data the study you have just read is built on, exactly as it was downloaded and archived.
Yours as a Member.
Data downloadable by Members
How to cite
Record the vintage as well as the study: the figures on this page are the ones extracted on the dates below.
Silver Data Lab Research Desk (2026). In Every EU Country, the Risk of Poverty Falls as Education Rises. Silver Data Lab, published 04 October 2026, last updated 11 October 2026. https://www.silverdatalab.com/studies/poverty-risk-by-education-in-the-eu
- Data: Eurostat, At-risk-of-poverty-rate, by highest level of education attained (tps00151), filters freq=A, statinfo=MED_EI, isced11=ED0-2, ED3_4, ED5-8, rskpovth=B_60, sex=T, age=Y_GE18, unit=PC; extracted 2026-10-21; source last updated 2026-10-20. https://doi.org/10.2908/tps00151
Silver Data Lab's analysis is licensed CC BY 4.0. The statistics remain their publisher's and keep its terms of reuse.
Ask the research desk
A question about this study — a definition, a filter, a break in the series, what the figures can and cannot support — answered by the desk that made the extraction.
Members can write to the research desk
Studies where the same country leads or trails
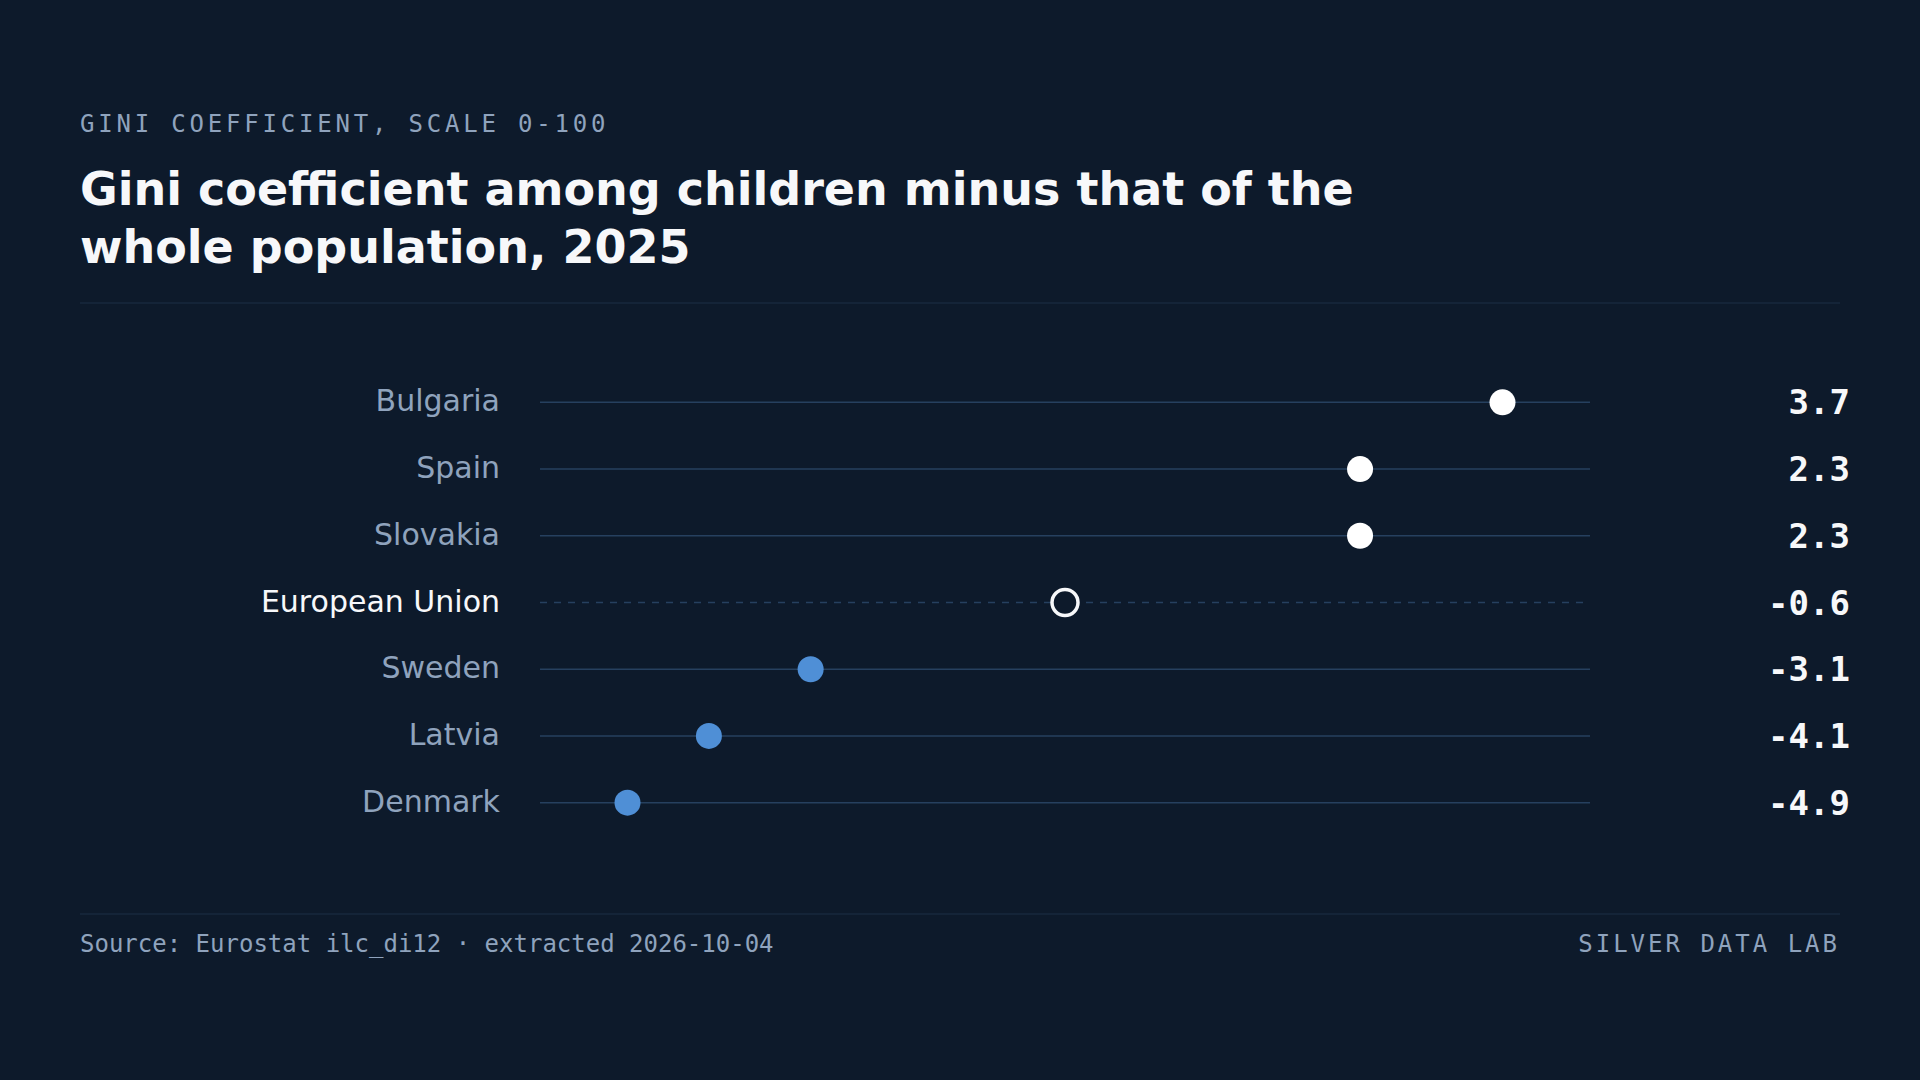
Among EU Children, Family Incomes Are Most Unequal in Bulgaria
Across the EU the Gini coefficient of disposable income among children under 18 was 28.6 in 2025, against 29.2 for the population as a whole.
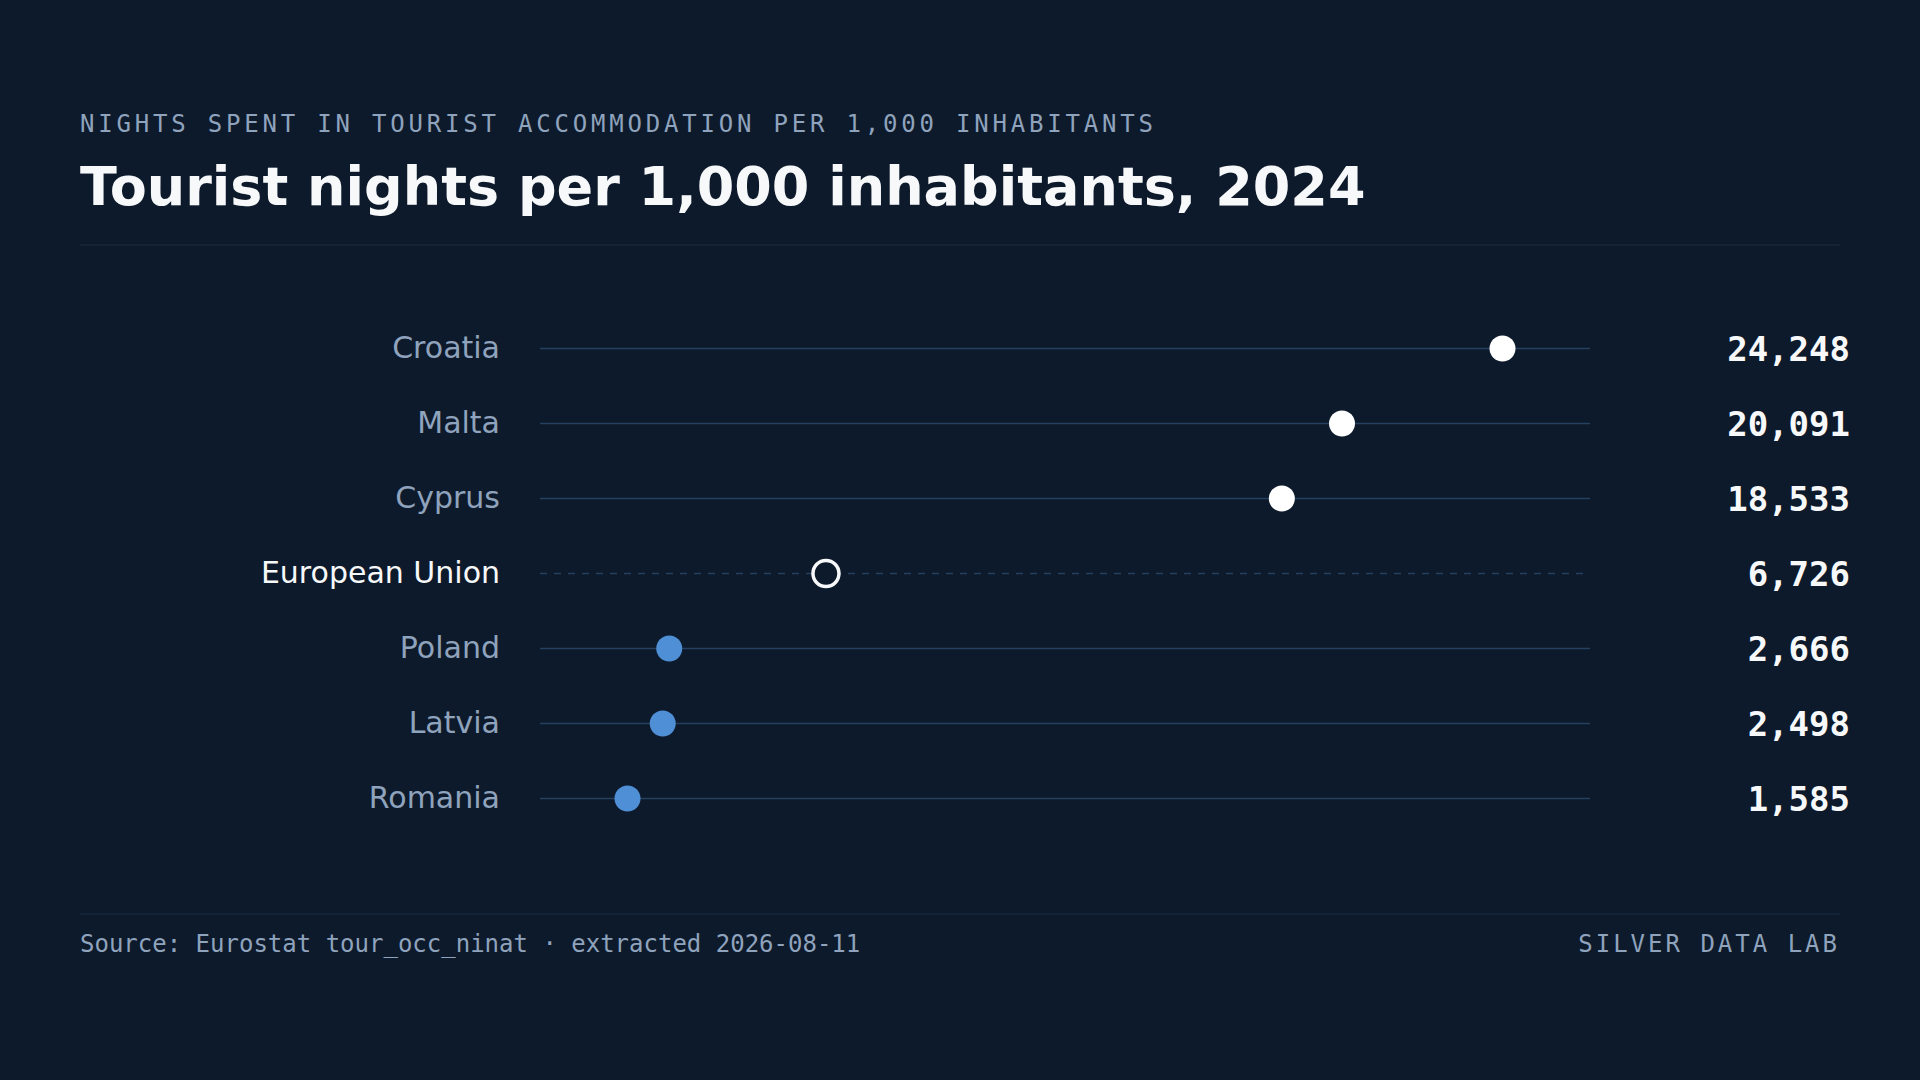
For Its Population, Croatia Has the Most Tourist Overnight Stays in the EU
The EU recorded 6,978 tourist nights per 1,000 inhabitants in 2025, about 7.0 nights per resident.
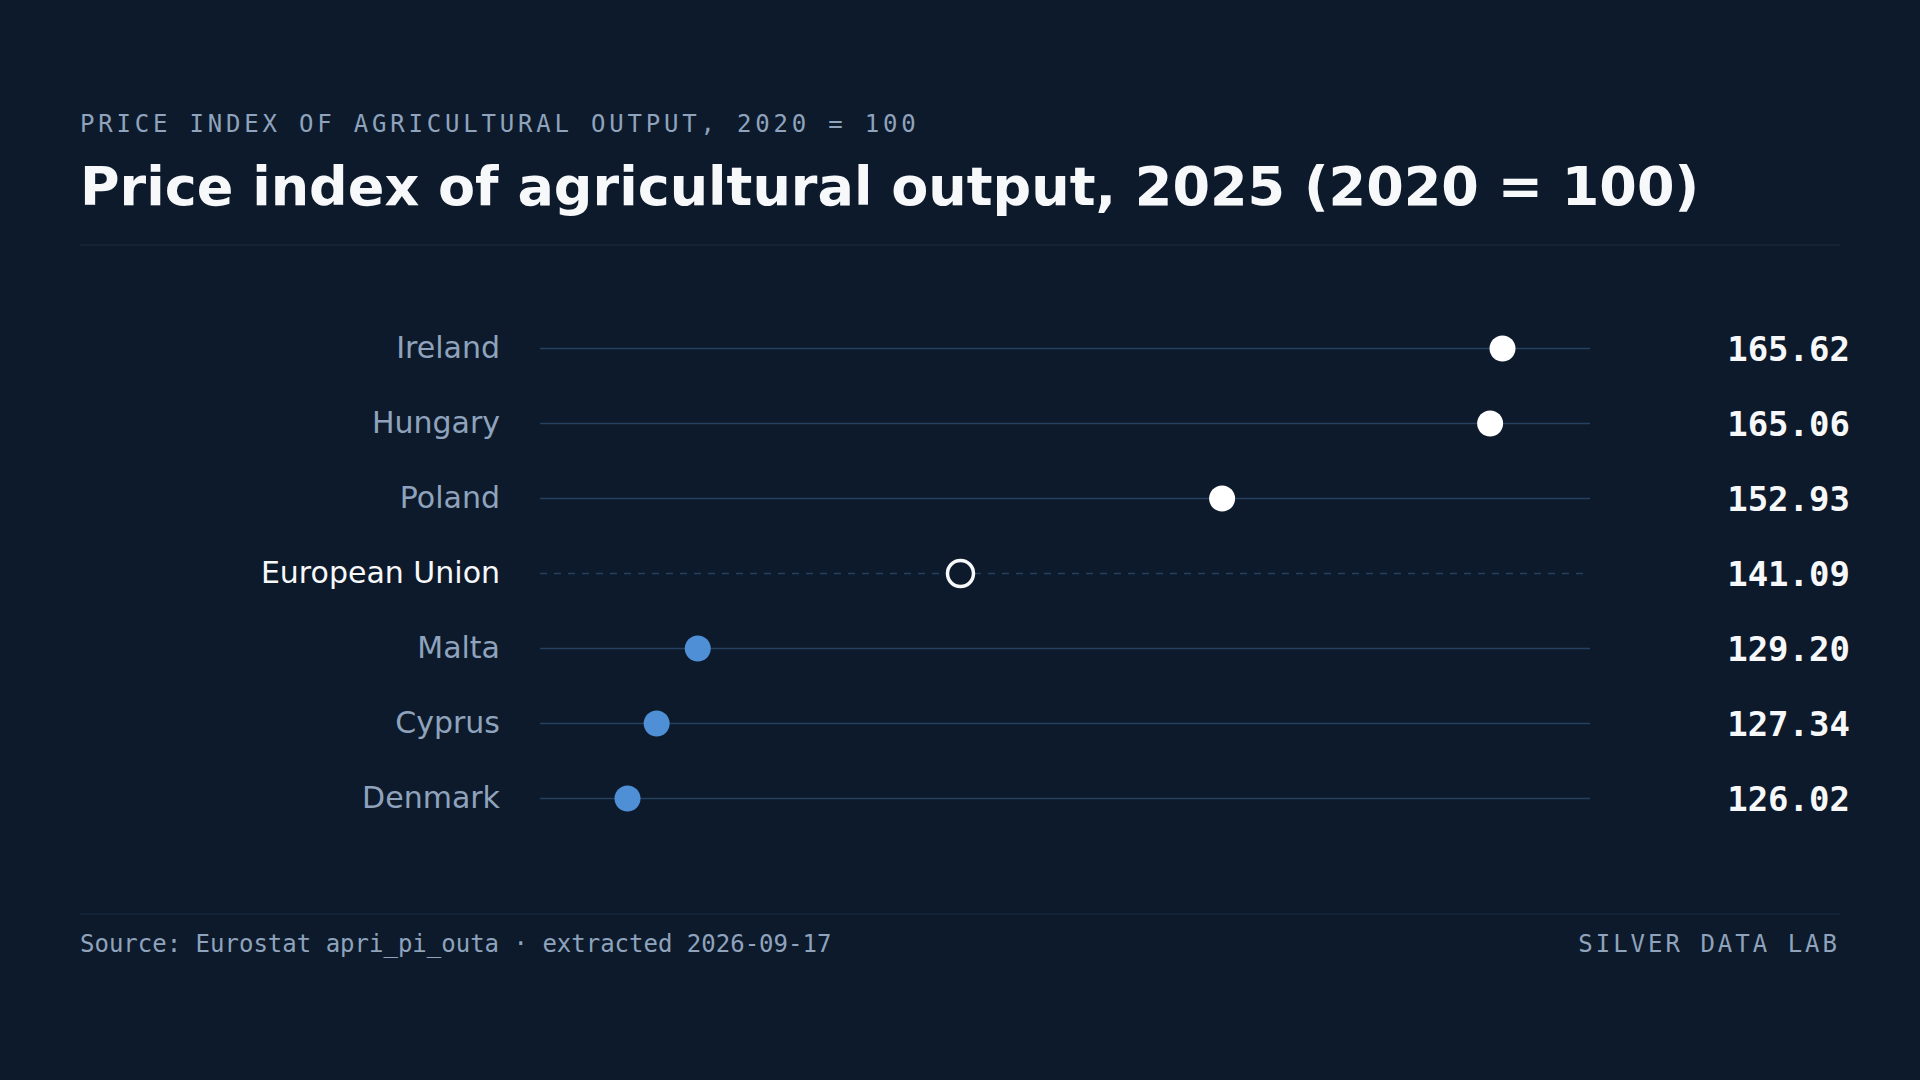
The Prices EU Farmers Receive Have Risen by Two Fifths in Five Years
The prices EU farmers received for their output in 2025 stood at 141.09 against a 2020 base of 100: a rise of just over two fifths in five years.