Farm-Gate Prices Are Two Fifths Above Their 2020 Level in the EU, and Two Thirds Above It in Ireland
Silver Data Lab Research Desk · Statistical analysis · Published on 17 September 2026
- Data source
- Eurostat
- Reference period
- 2025
- Last updated
- 18 September 2026
Re-checked against the source on 18 September 2026. No value in its datasets has moved between the snapshots we hold. Every revision we have observed →
Key estimates
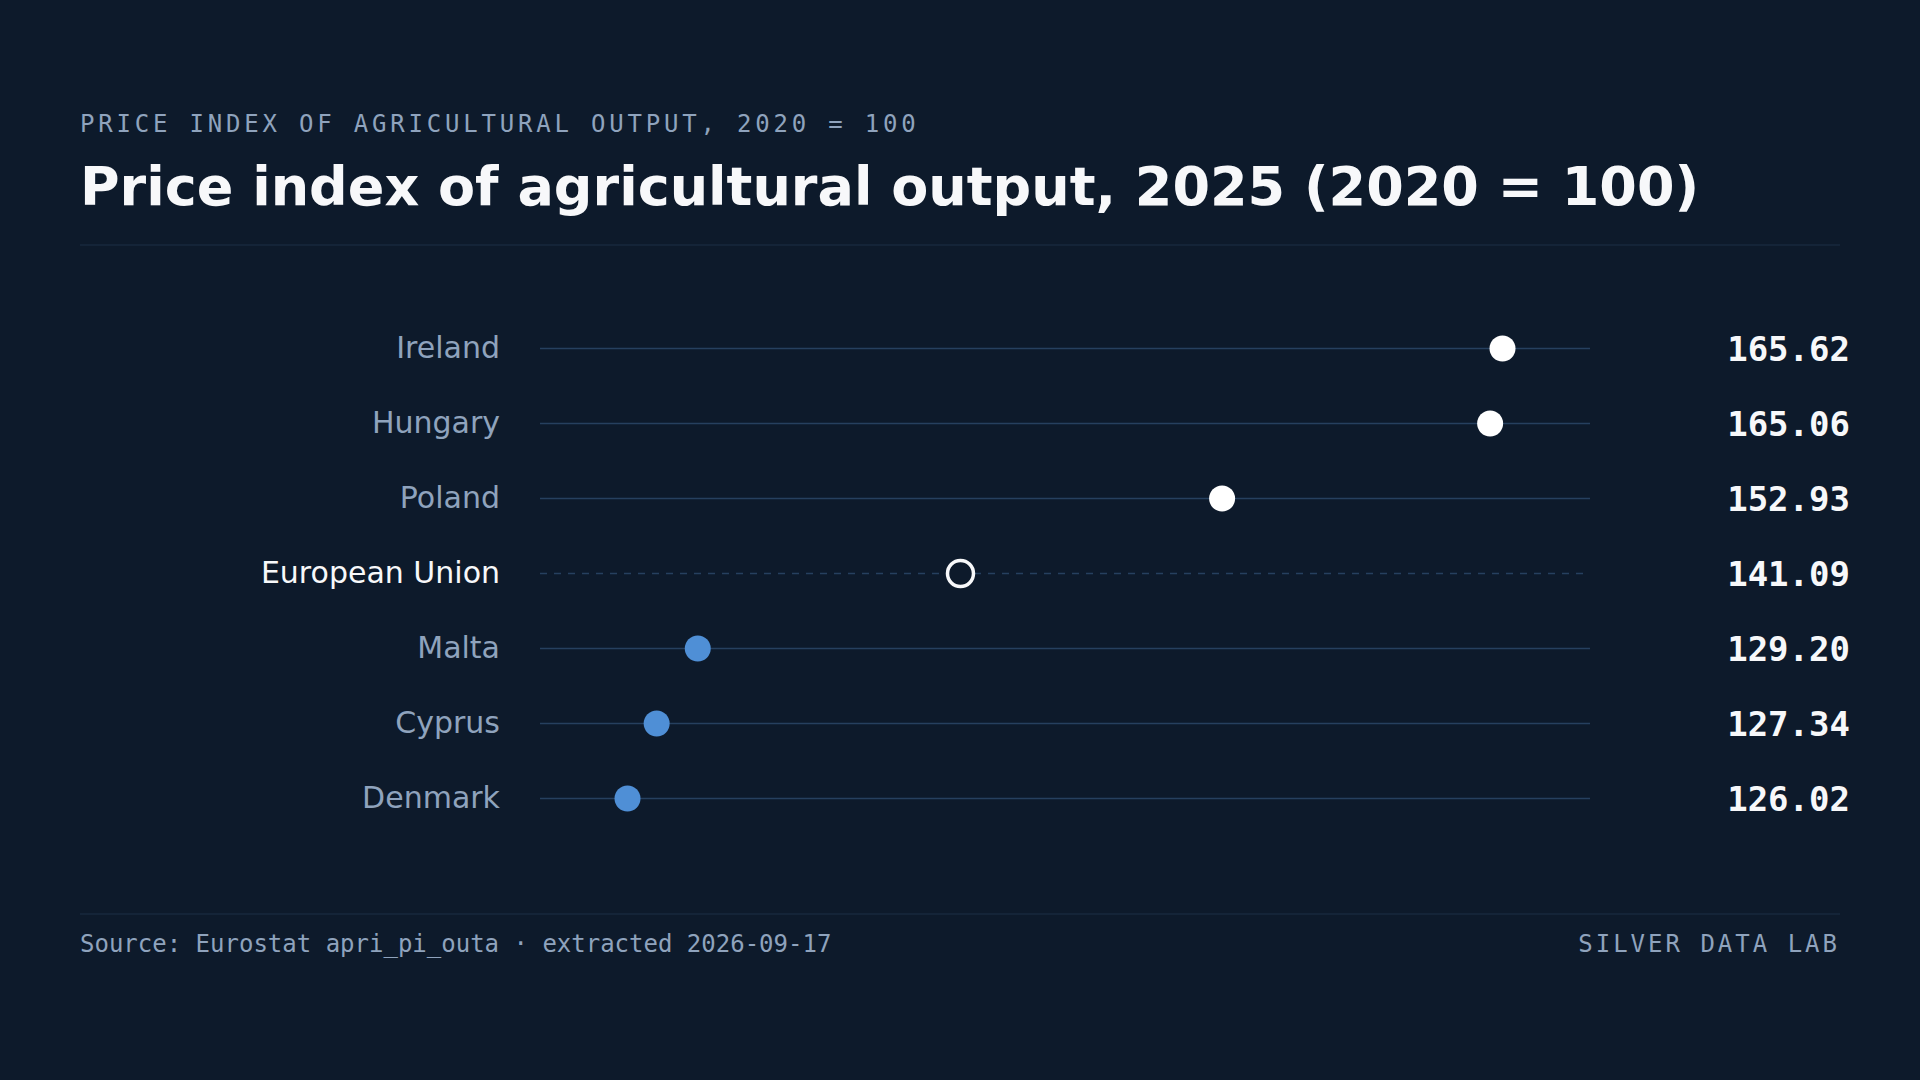
- The prices EU farmers received for their output in 2025 stood at 141.09 against a 2020 base of 100: a rise of just over two fifths in five years.
- Ireland records 165.62 and Hungary 165.06, followed by Poland at 152.93 and Slovenia at 152.20; four Member States are above 150.
- Denmark at 126.02, Cyprus at 127.34, Malta at 129.20 and France at 129.81 are the four Member States below 130.
- Deflated by consumer prices, the same index reads below 100 in Lithuania at 95.52, Czechia at 97.11 and Estonia at 98.50: farm-gate prices there have risen less than the cost of living.
- Hungary's nominal index of 165.06 becomes 107.37 in real terms, the widest difference between the two readings in the Union.
The price at the farm gate
Eurostat's index of agricultural output prices tracks what farmers are paid for what they sell: cereals, milk, livestock, fruit and vegetables, weighted by each country's own mix of production. It is a producer price, measured before processing, transport and retail add their margins, and it is the farmer's side of the food inflation that households have been living through since 2021.
Against a base of 100 in 2020, the EU index stood at 141.09 in 2025. Over five years the prices farmers receive rose by a little more than two fifths.
Where the rise was steepest
Ireland records 165.62 and Hungary 165.06, the two highest indices in the Union and the only two above 160. Poland at 152.93 and Slovenia at 152.20 follow, then Romania at 149.81, Luxembourg at 148.50, Sweden at 147.92, Portugal at 146.66, the Netherlands at 146.53, Greece at 145.85, Estonia at 145.84 and Spain at 145.65. Fourteen Member States are above the EU index.
The list mixes countries whose farm prices rose in a period of high general inflation, as in Hungary, Poland and Romania, with countries whose sectors are dominated by products whose prices moved most. Ireland's output is three quarters animal goods, so its index follows livestock and dairy prices rather than crop prices.
Where it was gentlest
Denmark at 126.02, Cyprus at 127.34, Malta at 129.20 and France at 129.81 are the four Member States below 130. Lithuania at 134.69, Finland at 134.71, Czechia at 135.50 and Bulgaria at 135.57 come next. Germany, at 139.60, sits just below the EU figure; its value is provisional.
A rise of a quarter in five years is still a rise of a quarter. No Member State's farmers were being paid less in 2025 than in 2020, in money terms.
In real terms, three countries went backwards
Eurostat also publishes the same index deflated by each country's harmonised index of consumer prices, so that a farm-gate price can be read against the cost of everything else. On that reading the picture changes.
Lithuania's real index is 95.52, Czechia's 97.11 and Estonia's 98.50: in those three countries the prices farmers receive rose by less than consumer prices did, so a farmer's output bought less in 2025 than in 2020. Latvia at 100.32, Bulgaria at 101.11 and Romania at 103.58 are barely ahead. Hungary's nominal index of 165.06 becomes 107.37 once inflation is taken out, a difference of 57.69 points, the widest in the Union and the clearest case of a farm-price rise that was mostly a general price rise.
At the other end, Ireland's real index of 137.53 is the highest in the Union, followed by Luxembourg at 122.96, Slovenia at 121.74, Portugal at 121.68, Sweden at 120.29 and Greece at 120.21. In those countries the rise at the farm gate outpaced inflation by a clear margin.
Five geographies are absent from that comparison. For Germany, the Netherlands, Austria and Slovakia, and for the EU aggregate, the archived extraction carries the same value under the real index as under the nominal one, which a deflated series cannot do over a period of rising consumer prices; those five real values are therefore not used here.
The other side of the accounts
An output price index says what farmers were paid per unit, not what they earned. Eurostat publishes a second index on the same 2020 base for what farming buys — feed, fertiliser, energy, seed, veterinary services — and reading the two together is the nearest this data comes to a margin.
Across the EU that input index stood at 131.98 in 2025 against the output index's 141.09. Prices at the farm gate ran a little ahead of costs. Beneath the aggregate the two sides part company.
Ireland is first on output and first on this comparison too: 165.62 against inputs at 127.17, the widest distance between the two anywhere in the Union. Hungary is the opposite case. Second on output at 165.06, its input index is 166.80, so its costs rose marginally more than its prices — the extraordinary nominal rise is neither a real rise nor a margin. Lithuania is the sharpest squeeze of all: output 134.69 against inputs at 153.78. In three Member States, Hungary, Slovakia and Lithuania, costs outran prices.
Lithuania is worth a second look, because it sits at the bottom of both readings. It is the one Member State where farm-gate prices lost ground to consumer prices and to the cost of farming at the same time.
None of this is income. Neither index counts volumes, subsidies or investment, and the distance between two price indices is not a profit.
Price index of agricultural output, 2025 (2020 = 100)
| Country | index, 2020 = 100 | Gap to EU averagepercentage points, derived |
|---|---|---|
| Ireland | 165.62 | +24.5 |
| Hungary | 165.06 | +24.0 |
| Poland | 152.93 | +11.8 |
| European Unionaggregate | 141.09 | — |
| Malta | 129.20 | −11.9 |
| Cyprus | 127.34 | −13.7 |
| Denmark | 126.02 | −15.1 |
This table as data: CSV · JSON
Every Member State for this indicator+
Members see every Member State for this indicator here, not only the rows the ranking prints. Become a Member
Embed this chart
Paste this code into a page. The frame carries the source and the extraction date, and links back to the study.
Price index of agricultural output deflated by consumer prices, 2025 (2020 = 100)
| Country | real index, 2020 = 100 |
|---|---|
| Ireland | 137.53 |
| Luxembourg | 122.96 |
| Slovenia | 121.74 |
| Estonia | 98.50 |
| Czechia | 97.11 |
| Lithuania | 95.52 |
This table as data: CSV · JSON
Every Member State for this indicator+
Members see every Member State for this indicator here, not only the rows the ranking prints. Become a Member
Embed this chart
Paste this code into a page. The frame carries the source and the extraction date, and links back to the study.
What these figures cannot tell you
- A nominal index, and a real one with gaps
- The headline ranking is in current prices and is not adjusted for inflation. Eurostat's deflated index, used in one section, is reported in the archived extraction as identical to the nominal index for Germany, the Netherlands, Austria, Slovakia and the EU aggregate, which a deflated series cannot be over a period of rising consumer prices. Those five real values are not used, and no real EU figure is quoted.
- The annual figure is neither the latest reading nor a peak
- This is an annual average for 2025. The same dataset's quarterly series puts the EU index at 144.76 in the second quarter of 2025 and 136.38 in the second quarter of 2026, the most recent quarter published, so farm-gate prices were already falling while this annual average was being formed and have fallen further since. The quarterly peak was 148.27 in the last quarter of 2022, three years before the reference year. The figure this study headlines is where prices averaged over 2025, not where they stand.
- Each country's own basket
- The index weights products by each Member State's own output. A country whose farming is mostly dairy is measured on dairy prices and a country whose farming is mostly cereals on cereal prices, so two countries facing the same world markets can move differently because they sell different things.
- The base year is not neutral
- All countries start at 100 in 2020, a year in which some farm prices were depressed by the pandemic. A country whose 2020 prices were unusually low shows a steeper rise from that base for reasons unrelated to later conditions.
- Prices, not incomes
- Output prices are one half of a farm's accounts. Input costs rose over the same period and are measured by a separate Eurostat index. A high output index does not by itself mean farmers were better off.
Frequently asked questions
- How much have farm prices risen in the EU since 2020?
- The EU index of agricultural output prices stood at 141.09 in 2025 against 100 in 2020, a rise of just over two fifths in money terms. It measures what farmers are paid for their output, before processing and retail.
- Which EU country saw the steepest rise in farm-gate prices?
- Ireland, at 165.62 on the 2020 base, just ahead of Hungary at 165.06. Poland at 152.93 and Slovenia at 152.20 are the only other Member States above 150.
- Where did farm prices rise least?
- Denmark at 126.02, Cyprus at 127.34, Malta at 129.20 and France at 129.81, the four Member States below 130. Even there, prices were a quarter higher in 2025 than in 2020.
- Have farm prices kept up with inflation?
- Not everywhere. Deflated by consumer prices, the index is below 100 in Lithuania at 95.52, Czechia at 97.11 and Estonia at 98.50, so farm-gate prices there rose less than the cost of living. Hungary's index falls from 165.06 to 107.37 once inflation is removed. Ireland's real index of 137.53 is the highest in the Union.
Methodological note
Eurostat publishes annual price indices of agricultural products on a 2020 = 100 base, as a nominal index and as a real index deflated by the harmonised index of consumer prices. This study uses the item covering all agricultural goods including fruit and vegetables, which is the broadest output aggregate in the dataset.
Values are for 2025 and cover all 27 Member States and the EU aggregate. The index is published to two decimal places and is quoted here as published; the rise from the 2020 base is the index minus 100, described in words rather than restated as a second figure. Germany's value is flagged by Eurostat as provisional.
The input price index is the same publisher's series for goods and services currently consumed in agriculture, on the same 2020 = 100 base, extracted separately and declared below. It is read alongside the output index and never subtracted from it in the page: the distance between the two is described in words, because a difference between two index numbers is not a margin and would read as one if it were printed as a figure. The input series carries the same defect as the output one — the aggregate's real index repeats its nominal value — so only the nominal input index is extracted.
The quarterly output series is extracted separately too, and is used only in the limitation that says what the annual average conceals.
The counts of Member States above the EU index, above 150 and below 130, the count whose input index exceeds their output index, the difference between Hungary's nominal and real indices, and the ranking of the real index over the 23 Member States for which it differs from the nominal one are made by Silver Data Lab from the published values and labelled as derived. The statement about Ireland's output mix comes from the livestock study on this site, which rests on its own archived extraction.
Source data
This study draws on 3 datasets from Eurostat. Each can be inspected and re-downloaded from its catalogue, and the filters below are the ones applied.
Price indices of agricultural products, output - annual data
apri_pi_outa
- Filters applied:
- freq=A · am_item=AM140000 · p_adj=NI, RI · unit=I20 · time=2025
- Extracted:
- 2026-09-17
- Source last updated:
- 2026-09-10
Price indices of the means of agricultural production, input - annual data
apri_pi_ina
- Filters applied:
- freq=A · am_item=AM200000 · p_adj=NI · unit=I20 · time=2025
- Extracted:
- 2026-09-18
- Source last updated:
- 2026-09-10
Price indices of agricultural products, output - quarterly data
apri_pi_outq
- Filters applied:
- freq=Q · am_item=AM140000 · p_adj=NI · unit=I20
- Extracted:
- 2026-09-18
- Source last updated:
- 2026-09-10
Download the data
The data the study you have just read is built on, exactly as it was downloaded and archived.
Yours as a Member.
Data downloadable by Members
How to cite
Record the vintage as well as the study: the figures on this page are the ones extracted on the dates below.
Silver Data Lab Research Desk (2026). Farm-Gate Prices Are Two Fifths Above Their 2020 Level in the EU, and Two Thirds Above It in Ireland. Silver Data Lab, published 17 September 2026, last updated 18 September 2026. https://www.silverdatalab.com/studies/farm-gate-prices-in-the-eu
- Data: Eurostat, Price indices of agricultural products, output - annual data (apri_pi_outa), filters freq=A, am_item=AM140000, p_adj=NI, RI, unit=I20, time=2025; extracted 2026-09-17; source last updated 2026-09-10. https://doi.org/10.2908/apri_pi_outa
- Data: Eurostat, Price indices of the means of agricultural production, input - annual data (apri_pi_ina), filters freq=A, am_item=AM200000, p_adj=NI, unit=I20, time=2025; extracted 2026-09-18; source last updated 2026-09-10. https://doi.org/10.2908/apri_pi_ina
- Data: Eurostat, Price indices of agricultural products, output - quarterly data (apri_pi_outq), filters freq=Q, am_item=AM140000, p_adj=NI, unit=I20; extracted 2026-09-18; source last updated 2026-09-10. https://doi.org/10.2908/apri_pi_outq
Silver Data Lab's analysis is licensed CC BY 4.0. The statistics remain their publisher's and keep its terms of reuse.
Ask the research desk
A question about this study — a definition, a filter, a break in the series, what the figures can and cannot support — answered by the desk that made the extraction.
Members can write to the research desk
Studies where the same country leads or trails
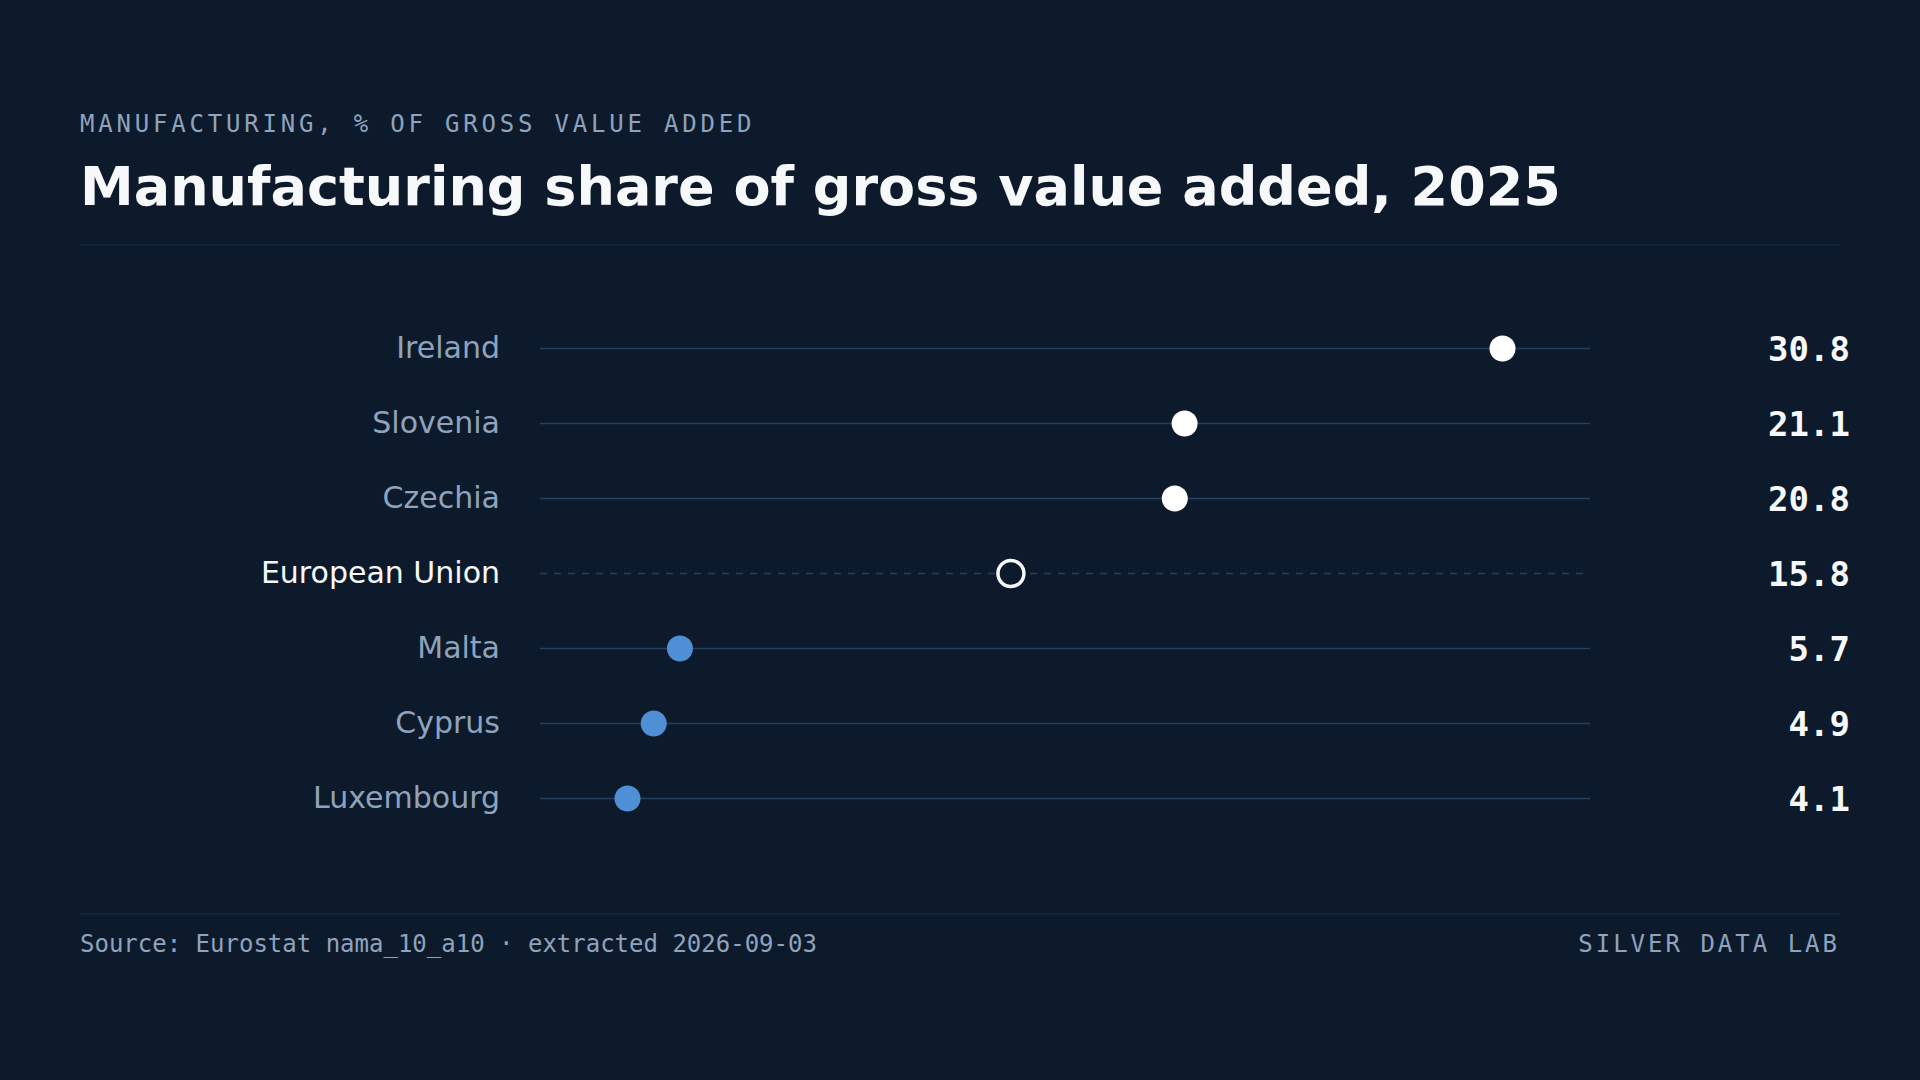
France Manufactures a Smaller Share of Its Economy Than Bulgaria
Manufacturing accounted for 15.8% of gross value added in the EU in 2025.
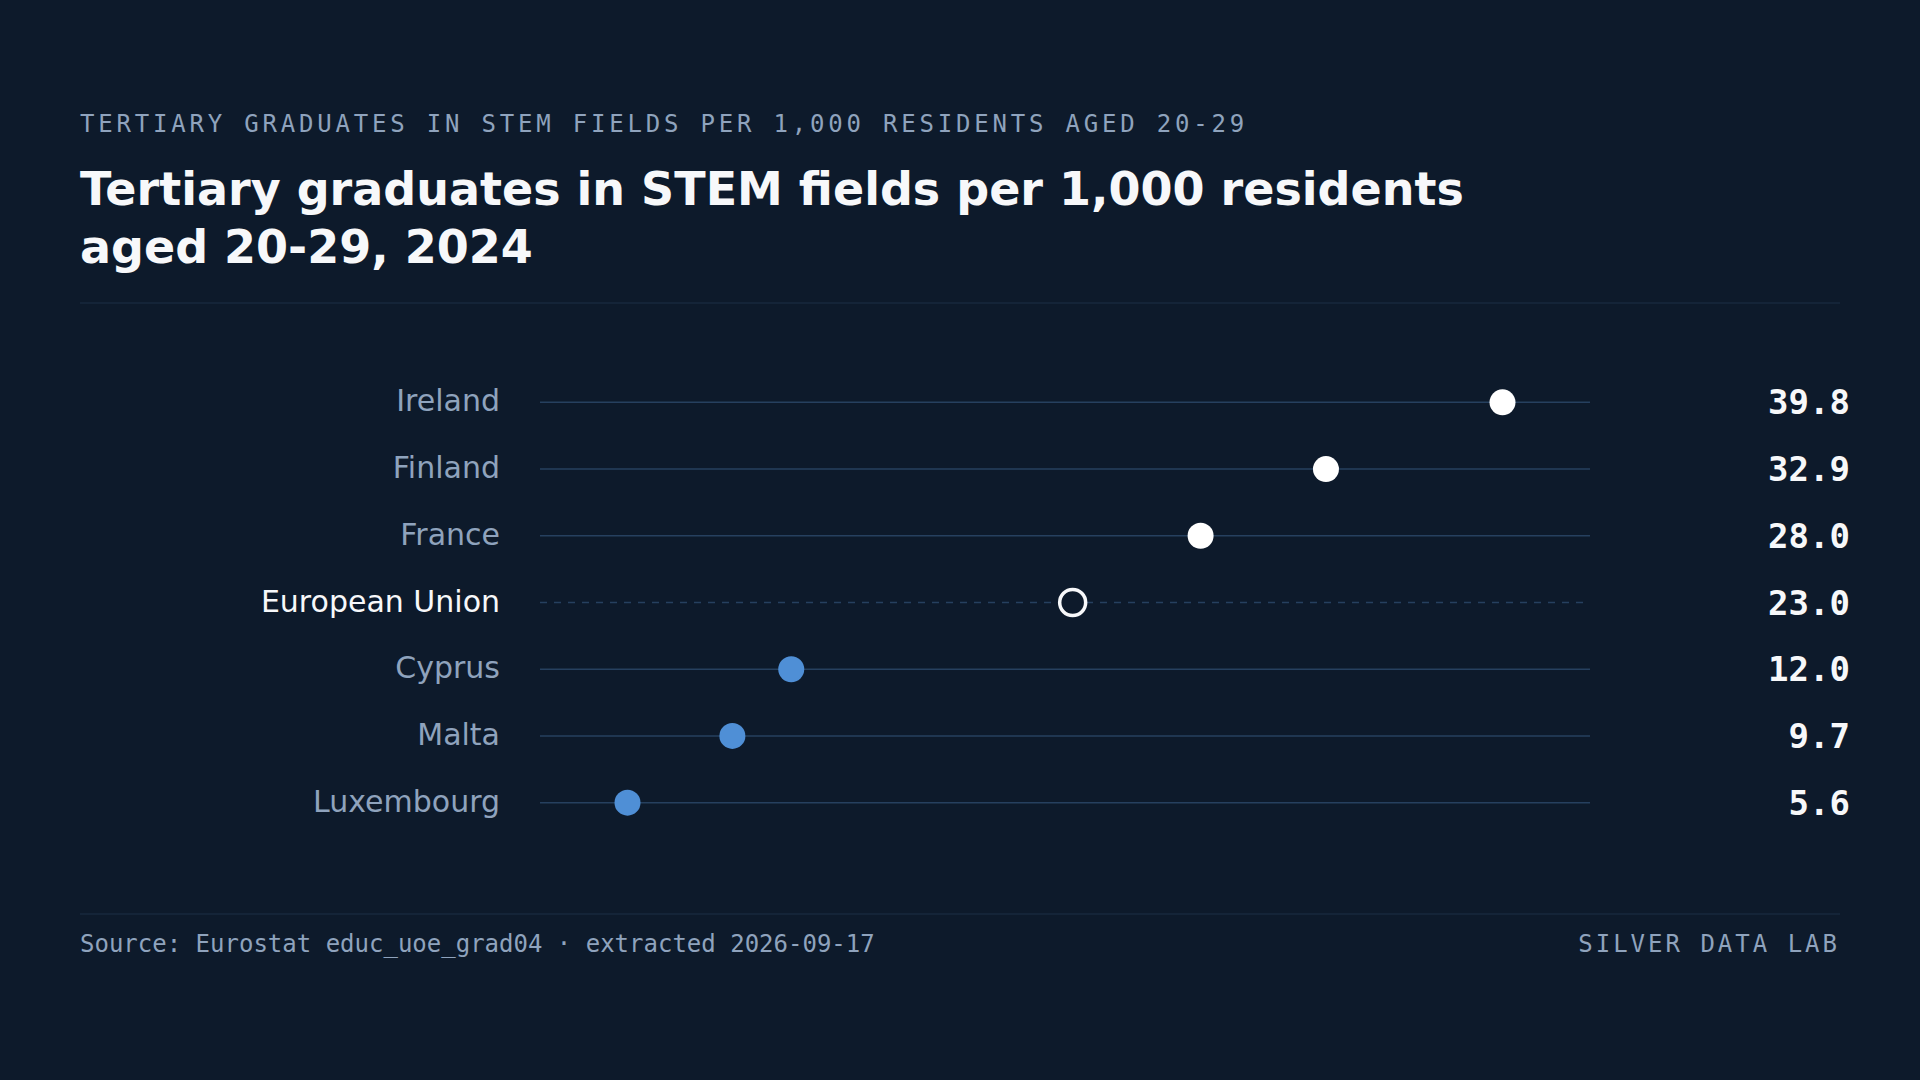
Ireland and Finland Lead the EU in STEM Graduates, and Nowhere Do Women Outnumber Men
In 2024 the EU produced 23.0 tertiary graduates in science, mathematics, computing, engineering, manufacturing and construction for every 1,000 residents aged 20 to 29.
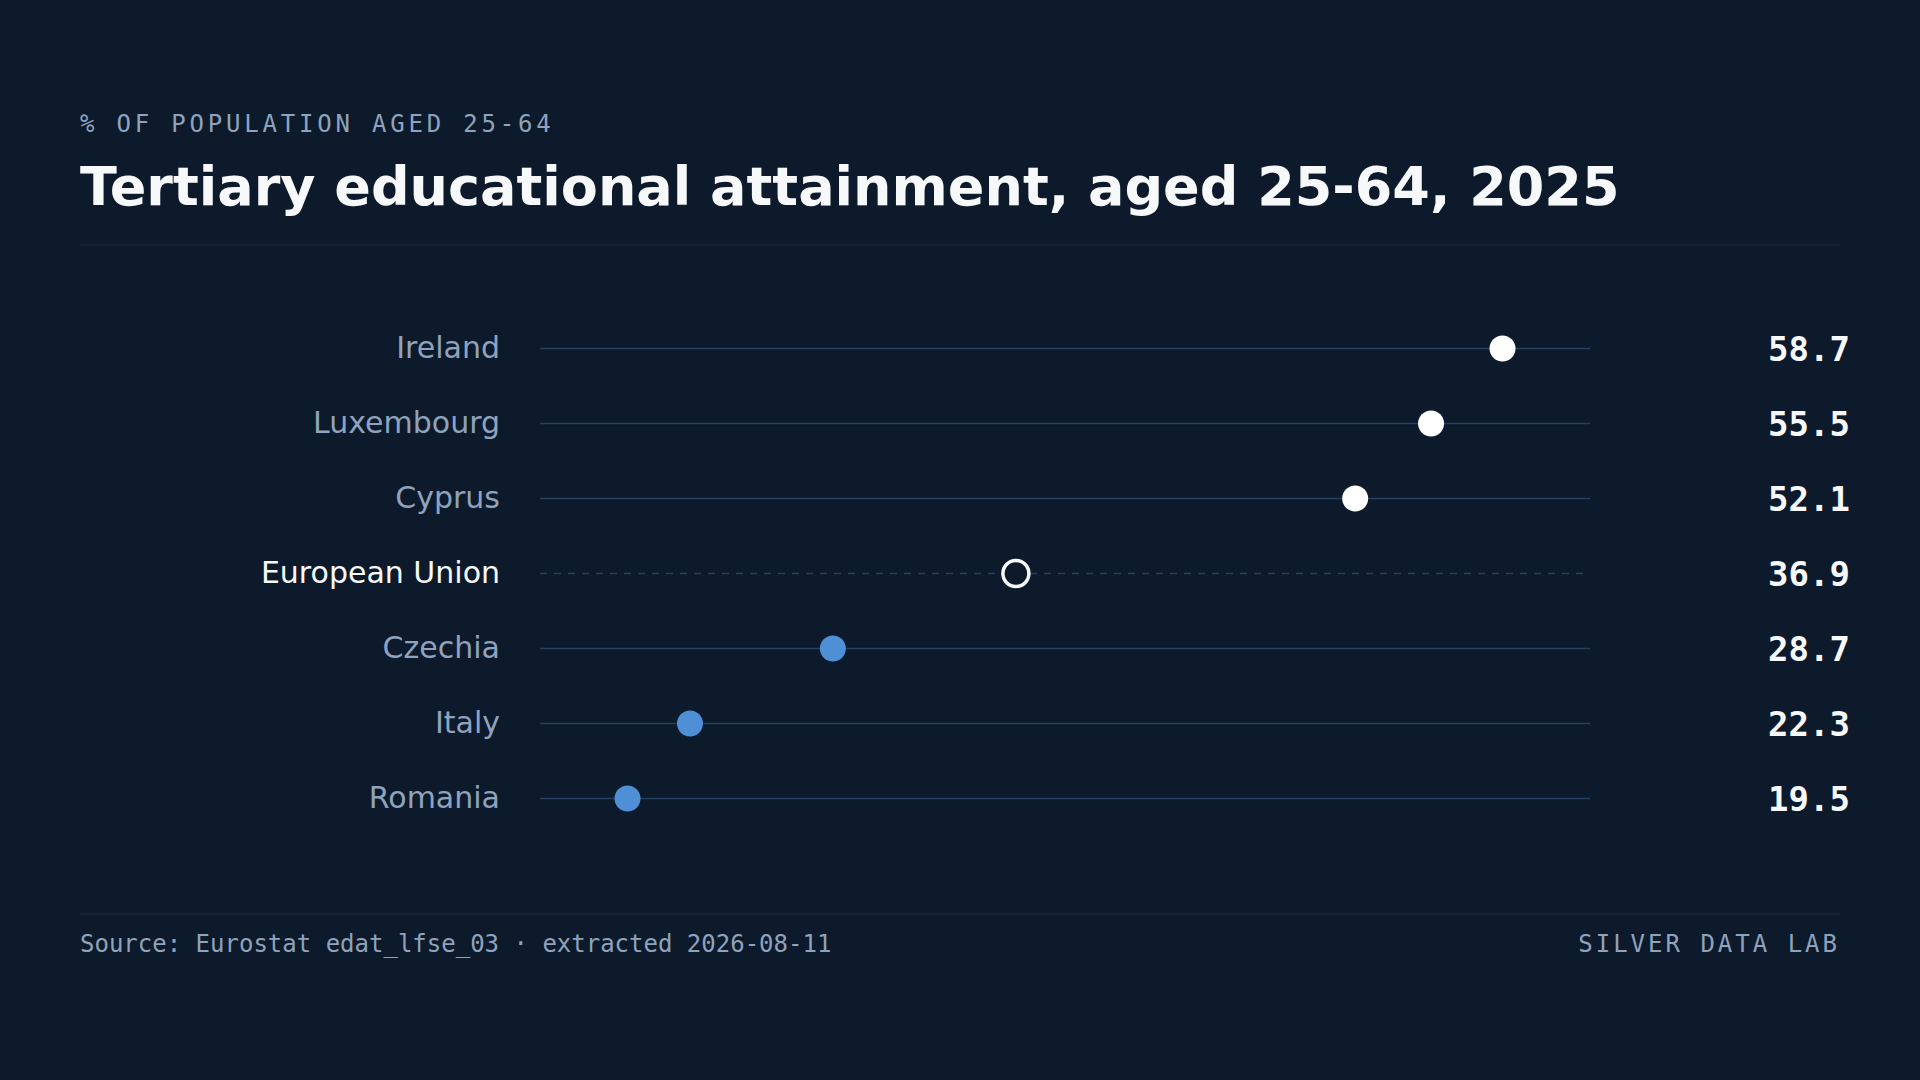
Ireland Has Three Times Romania's Share of Graduates
36.9% of people aged 25 to 64 in the EU held a tertiary qualification in 2025.