Women Average Fewer Than 1.3 Children in Over a Third of EU Regions
Silver Data Lab Research Desk · Statistical analysis · Published on 04 October 2026
- Data source
- Eurostat
- Reference period
- 2024
- Last updated
- 11 October 2026
Re-checked against the source on 04 October 2026. No value in its datasets has moved between the snapshots we hold. Every revision we have observed →
Key estimates
- In 2024, 88 of the EU's 244 regions recorded a total fertility rate below 1.3 children per woman — more than a third of them.
- Of the 239 regions with a value in both years, 30 were below 1.3 in 2014 and 88 in 2024; the rate fell in 210 of them.
- Italy has 20 of its 21 regions below 1.3, Spain 17 of 19 and Poland 16 of 17.
- Spain's Canary Islands record 0.82, the lowest rate in the Union; the Italian island of Sardinia and the northern Spanish regions of Asturias, Galicia and Cantabria are also below one child per woman.
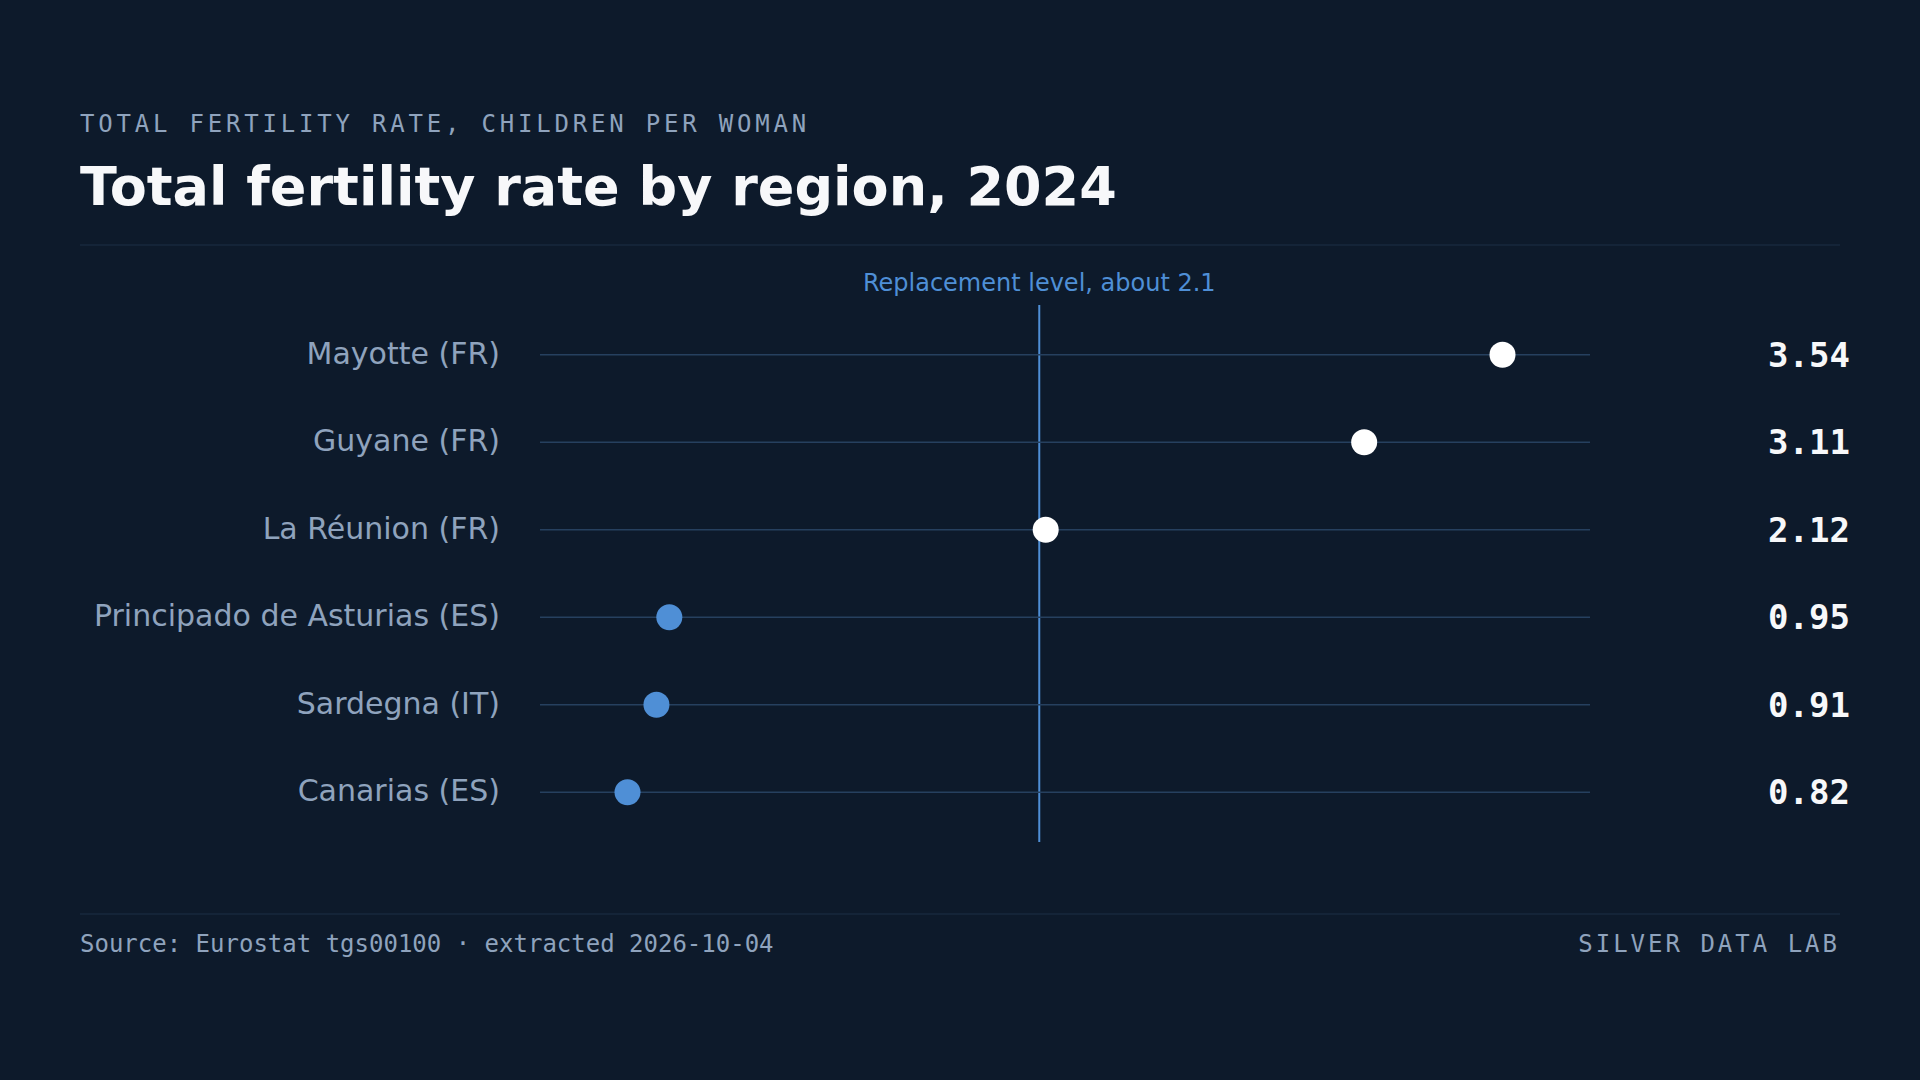
- Only three regions reach the replacement level of about 2.1, all of them French overseas departments: Mayotte at 3.54, French Guiana at 3.11 and Réunion at 2.12.
Births counted region by region
The total fertility rate condenses one year of births into a single number: how many children a woman would have by the end of her childbearing years if, at each age, she had children as often as women of that age did in the year measured. It describes the behaviour of a given year, not the families anyone actually completes. About 2.1 is the conventional replacement level, the rate at which a generation, without migration, is as large as the one that bore it.
Eurostat publishes the rate for NUTS 2 regions, the middle tier of the classification it uses to divide the Union into comparable territories. In Spain these are the autonomous communities and the two autonomous cities; in Italy the regions, with Trentino-Alto Adige split into its two autonomous provinces; Estonia, Cyprus, Latvia, Luxembourg and Malta count as a single region each. For 2024 the table covers 244 regions in all 27 Member States.
Eighty-eight regions under 1.3
The 1.3 line is where demographers place lowest-low fertility: a rate that, if it persisted, would leave each generation far smaller than the one that bore it. In 2024 the rate was below 1.3 in 88 of the 244 regions, more than a third of them.
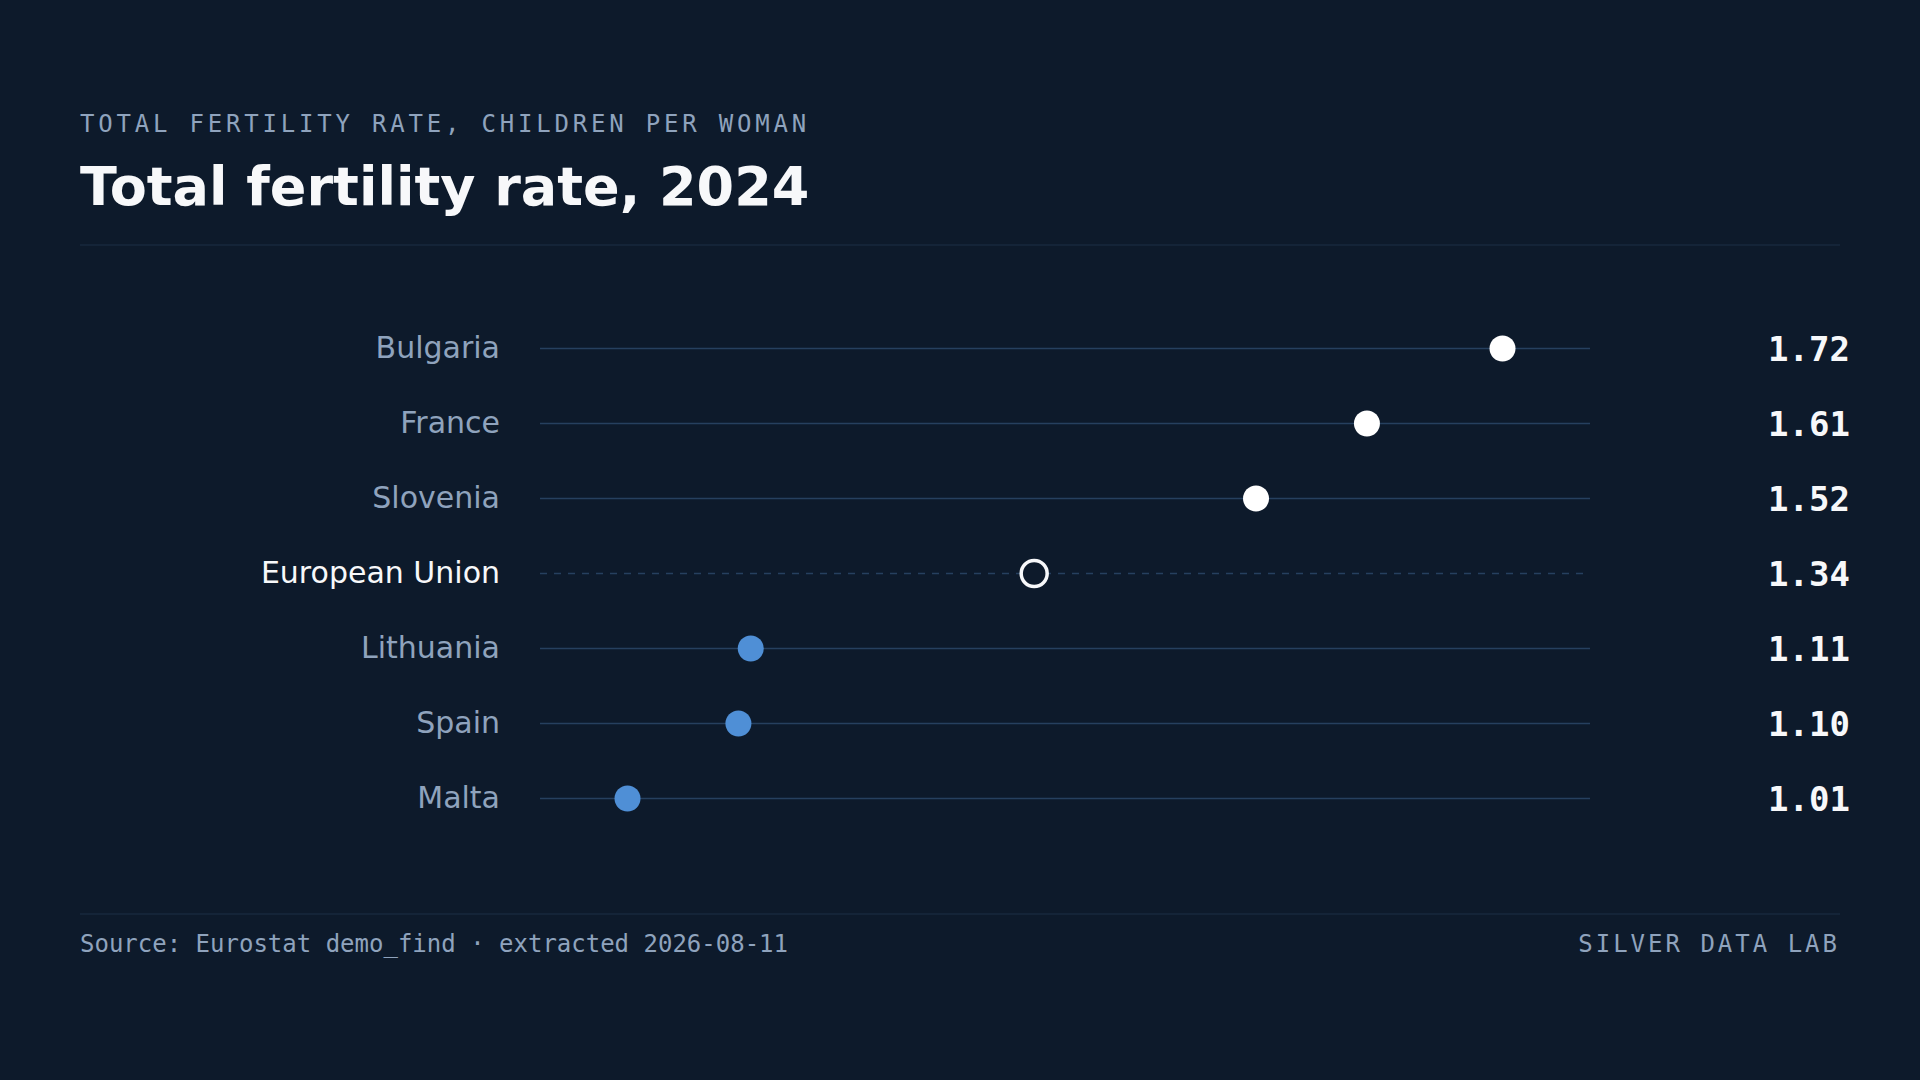
The national series puts the EU as a whole at 1.34, a few hundredths above the line, and finds ten Member States below it. Region by region the band is far wider: nineteen Member States contain at least one region below 1.3. The eight with none are Belgium, Bulgaria, Croatia, Cyprus, Denmark, Ireland, Slovenia and Sweden.
A decade earlier the count was about a third of that. Among the 239 regions that have a value for both 2014 and 2024, 30 were below 1.3 in 2014. The rate fell in 210 of those 239 regions, rose in 25 and was unchanged in four, and in eighteen Member States every region recorded a lower rate at the end of the decade than at the start.
Part of that comparison needs care. Eurostat marks a break in the regional series of Czechia, Germany, Greece, Italy and Poland at some point after 2014, so for their 97 regions the two years are not fully comparable. Setting those five countries aside leaves 142 regions in 22 Member States, and there the count below 1.3 went from 13 to 39: the same tripling, without the breaks.
Spain, Italy and Poland: below 1.3 almost everywhere
Three countries supply 53 of the 88 regions. Italy has 20 of its 21 regions below 1.3, Spain 17 of 19 and Poland 16 of 17.
What is left above the line in those three countries is short enough to name. In Italy it is the Autonomous Province of Bolzano, in the German-speaking far north, at 1.51. In Spain there are two: the Region of Murcia on the south-eastern coast at 1.32 and Melilla, the Spanish autonomous city on the North African coast, at 1.36. In Poland it is Mazowiecki regionalny — the part of Mazowieckie province that lies outside the Warsaw capital region — at 1.31.
The low national rates of these countries are therefore not averages of high and low places. They are what almost every region of each country records.
Five regions below one child per woman
Five regions record fewer than one child per woman. Spain's Canary Islands have the lowest rate in the Union at 0.82. The Italian island of Sardinia follows at 0.91, then three regions of Spain's Atlantic north: Asturias at 0.95, Galicia at 0.96 and Cantabria at 0.99. Malta, a single region, comes next at 1.01.
In 2014 only two regions were below one, Asturias and the Portuguese island of Madeira, both at 0.99. Madeira has since climbed to 1.26. The Canary Islands, then at 1.05, are now 0.23 lower.
Capital regions at or near the bottom
Twenty-two Member States are divided into more than one region. In ten of them the region that contains the capital records the lowest rate in the country: Budapest at 1.07, a long way below the 1.67 of Észak-Magyarország in northern Hungary; Sostinės regionas, the Vilnius capital region of Lithuania, at 1.09; Attica, the region of Athens, at 1.14; Bucharest-Ilfov at 1.19; Prague at 1.26; the City of Zagreb at 1.32; Hovedstaden, the Copenhagen region, at 1.40; Eastern and Midland, the Irish region around Dublin, at 1.41; Zahodna Slovenija, the western region of Slovenia that includes Ljubljana, at 1.46; and Yugozapaden, the south-western Bulgarian region that includes Sofia, at 1.55. In seven more — Austria, Belgium, Finland, Germany, the Netherlands, Slovakia and Sweden — the capital region is second lowest.
The five exceptions are of two opposite kinds. In Spain, Italy and Poland the capital does not stand out because little else does: the Comunidad de Madrid at 1.09, Lazio, the region of Rome, at 1.10 and Warsaw's capital region at 1.08 sit inside national fields that are low from end to end. France and Portugal are the reverse. Île-de-France, the Paris region, records 1.68, level at two decimals with Picardie in northern France for the highest rate in metropolitan France, and Grande Lisboa, the Lisbon region, records 1.65, level at two decimals with the Algarve on the southern coast and exceeded in Portugal only by the Setúbal peninsula across the Tagus at 1.69.
The highest rates: overseas France and Bulgaria
Three regions are at or above 2.1, and all three are French overseas departments: Mayotte, in the Indian Ocean between Mozambique and Madagascar, at 3.54; French Guiana, on the north-eastern coast of South America, at 3.11; and Réunion, east of Madagascar, at 2.12. All three values, like every French region's, are provisional. In 2014 five regions reached the level. Guadeloupe, a French overseas department in the Caribbean, has since fallen from 2.27 to 1.81 and Melilla from 2.68 to 1.36.
Outside the overseas departments the two highest rates in the Union are both Bulgarian. Yugoiztochen, in south-eastern Bulgaria, records 2.04 and Severozapaden, in the north-west of the country, 1.92. Of the 22 Member States with more than one region, Bulgaria is the only one where no region had a lower rate in 2024 than in 2014: five of its six regions rose and the sixth was unchanged.
Total fertility rate by region, 2024
| Country | Children per woman |
|---|---|
| Mayotte (FR) | 3.54p |
| Guyane (FR) | 3.11p |
| La Réunion (FR) | 2.12p |
| Principado de Asturias (ES) | 0.95 |
| Sardegna (IT) | 0.91 |
| Canarias (ES) | 0.82 |
Flags carried by the source on these values: p provisional
This table as data: CSV · JSON
Every Member State for this indicator+
Members see every Member State for this indicator here, not only the rows the ranking prints. Become a Member
Embed this chart
Paste this code into a page. The frame carries the source and the extraction date, and links back to the study.
Capital regions with the lowest fertility rate in their country, 2024
| Country | Children per woman |
|---|---|
| Yugozapaden (BG) | 1.55 |
| Zahodna Slovenija (SI) | 1.46 |
| Eastern and Midland (IE) | 1.41 |
| Hovedstaden (DK) | 1.40 |
| Grad Zagreb (HR) | 1.32 |
| Praha (CZ) | 1.26 |
| Bucureşti-Ilfov (RO) | 1.19e |
| Attiki (EL) | 1.14 |
| Sostinės regionas (LT) | 1.09 |
| Budapest (HU) | 1.07 |
Flags carried by the source on these values: e estimated
This table as data: CSV · JSON
Every Member State for this indicator+
Members see every Member State for this indicator here, not only the rows the ranking prints. Become a Member
Embed this chart
Paste this code into a page. The frame carries the source and the extraction date, and links back to the study.
What these figures cannot tell you
- Five national series break inside the decade
- Eurostat flags a break in time series for every region of Italy in 2018, Czechia in 2020, Greece in 2021, Poland in 2022 and Germany in 2023. For those 97 regions the 2014 and 2024 rates are not fully comparable, which is why the study also gives the count below 1.3 for the other 22 Member States on their own. Germany has no regional values at all for 2021.
- Provisional and estimated values
- All 27 French regions carry 2024 values flagged as provisional, including the three overseas departments at the top of the ranking, and all eight Romanian regions carry values flagged as estimated, including Bucharest-Ilfov. The EU rate of 1.34 quoted from the national series is flagged as both estimated and provisional.
- A one-year rate in a period of later motherhood
- The total fertility rate adds up the birth rates of women of every age in a single year. When women are having their children later than the generation before them, as across most of the Union, a single year's rate can sit below the number of children the women concerned will end up having. A region's figure describes 2024, not the completed families of its residents.
- Changing boundaries and small regions
- The 2024 revision of the NUTS classification redrew Portugal's regions, and five of them — Centro, Grande Lisboa, Península de Setúbal, Alentejo and Oeste e Vale do Tejo — have no value for 2014, so the decade comparison covers 239 regions rather than 244. Regions with small populations, such as Spain's two North African cities of Ceuta and Melilla, Finland's Åland Islands or Valle d'Aosta in the Italian Alps, can move noticeably from one year to the next on a modest change in the number of births.
Frequently asked questions
- Which EU region has the lowest fertility rate?
- Spain's Canary Islands, at 0.82 children per woman in 2024. The Italian island of Sardinia follows at 0.91, then three regions of northern Spain: Asturias at 0.95, Galicia at 0.96 and Cantabria at 0.99 — five regions below one child per woman, against two in 2014.
- Which EU region has the highest fertility rate?
- Mayotte, a French overseas department in the Indian Ocean, at 3.54 in 2024, ahead of French Guiana at 3.11 and Réunion at 2.12. They are the only three regions at or above the replacement level of about 2.1. Outside the overseas departments the highest is Yugoiztochen in south-eastern Bulgaria at 2.04.
- How many EU regions have a fertility rate below 1.3?
- 88 of the EU's 244 regions recorded a rate below 1.3 in 2024. Of the 239 regions with a value for both years, 30 were below 1.3 in 2014. Italy, Spain and Poland together account for 53 of the 88.
- Is fertility lower in capital regions?
- In most Member States that have more than one region. Of those 22, the capital region has the lowest rate in ten, from Budapest at 1.07 to Yugozapaden, the region of Sofia, at 1.55, and the second lowest in seven more. The Paris region, Île-de-France, at 1.68 and the Lisbon region, Grande Lisboa, at 1.65 are the clearest exceptions.
Methodological note
The study measures the total fertility rate, in children per woman, for each NUTS 2 region of the 27 Member States, from Eurostat's regional table of the indicator. It covers 244 regions in 2024 and 239 in 2014; the five Portuguese regions created by the 2024 NUTS revision have no value for the earlier year. Regions of the United Kingdom, Türkiye, Norway, Switzerland, Serbia and the other non-EU countries present in the table are excluded, as are the superseded codes the table keeps under their old NUTS vintage.
Eurostat publishes the 2024 rates with up to five decimal places, and several countries' earlier rates rounded to two. This study prints every rate to two decimals and makes every count and comparison on those two-decimal values, so a region printed at 1.30 is not counted below 1.3 and a region whose two printed values are equal is counted as unchanged.
The regional table publishes no EU aggregate, so no ranking here carries a reference row. The EU rate of 1.34 and the number of Member States below 1.3 nationally come from Eurostat's national fertility indicators for 2024, declared below as a separate source. The replacement level of about 2.1 is a demographic convention, not a Eurostat figure. A capital region is the NUTS 2 region containing the national capital.
Silver Data Lab derived the following from the published rates: the counts of regions below 1.3 and below 1.0 and at or above 2.1, in total, by Member State and for the 22 Member States without a series break after 2014; the count of Member States with at least one region below 1.3; the counts of regions whose rate fell, rose or was unchanged between 2014 and 2024, of Member States in which every region fell and of Member States in which none did; the change in the Canary Islands' rate between the two years; the position of each capital region among its country's regions; and the count of Member States below 1.3 in the national series. Nothing else is computed.
Source data
This study draws on 2 datasets from Eurostat. Each can be inspected and re-downloaded from its catalogue, and the filters below are the ones applied.
Total fertility rate by NUTS 2 region
tgs00100
- Filters applied:
- freq=A · unit=NR · age=TOTAL
- Extracted:
- 2026-10-04
- Source last updated:
- 2026-09-30
Fertility indicators
demo_find
- Filters applied:
- freq=A · indic_de=TOTFERRT · time=2024
- Extracted:
- 2026-10-01
- Source last updated:
- 2026-09-30
Download the data
The data the study you have just read is built on, exactly as it was downloaded and archived.
Yours as a Member.
Data downloadable by Members
How to cite
Record the vintage as well as the study: the figures on this page are the ones extracted on the dates below.
Silver Data Lab Research Desk (2026). Women Average Fewer Than 1.3 Children in Over a Third of EU Regions. Silver Data Lab, published 04 October 2026, last updated 11 October 2026. https://www.silverdatalab.com/studies/regional-fertility-in-the-eu
- Data: Eurostat, Total fertility rate by NUTS 2 region (tgs00100), filters freq=A, unit=NR, age=TOTAL; extracted 2026-10-04; source last updated 2026-09-30. https://doi.org/10.2908/tgs00100
- Data: Eurostat, Fertility indicators (demo_find), filters freq=A, indic_de=TOTFERRT, time=2024; extracted 2026-10-01; source last updated 2026-09-30. https://doi.org/10.2908/demo_find
Silver Data Lab's analysis is licensed CC BY 4.0. The statistics remain their publisher's and keep its terms of reuse.
Ask the research desk
A question about this study — a definition, a filter, a break in the series, what the figures can and cannot support — answered by the desk that made the extraction.
Members can write to the research desk