Italy's Packaging Waste per Person Is 2.9 Times Bulgaria's
Silver Data Lab Research Desk · Statistical analysis · Published on 14 May 2026
- Data source
- Eurostat
- Reference period
- 2022
- Last updated
- 22 October 2026
Re-checked against the source on 22 October 2026. 7 values in its datasets moved between snapshots, 3 of them figures stated on this page. Every revision we have observed →
Key estimates
- The EU generated 186.6 kg of packaging waste per inhabitant in 2022.
- Luxembourg records 232.7 kg, Italy 232.2 kg and Ireland 231.7 kg.
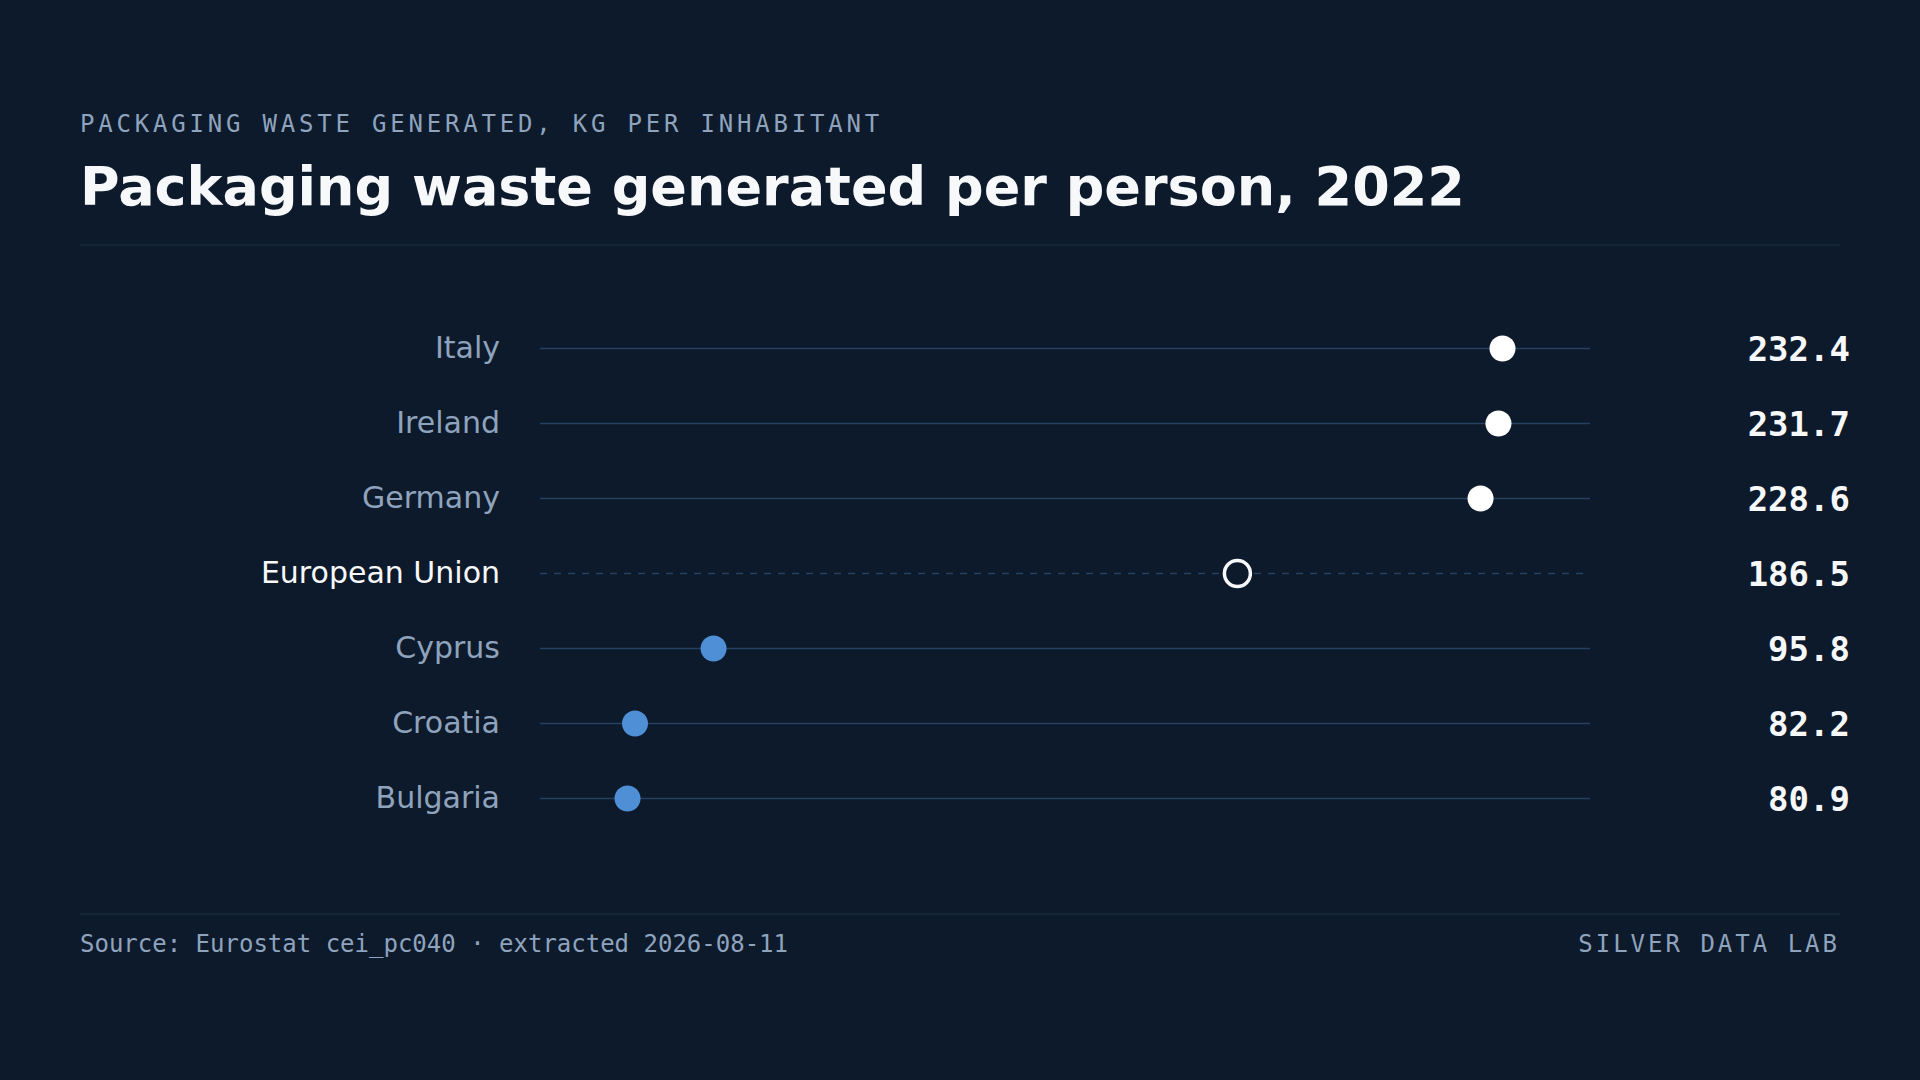
- Bulgaria records 80.9 kg, Croatia 82.2 kg and Cyprus 95.8 kg — Italy generates 2.9 times as much per person as Bulgaria, a ratio derived here.
- Only five Member States are above the EU figure, and twenty-two below it — an average pulled up by the largest economies.
- Municipal waste came to 514 kg per inhabitant in the same year, but the two series overlap without either containing the other, so no share is computed from them.
A waste stream defined by what it wraps
Packaging waste is counted under a reporting obligation of its own, separate from every other waste account: the Union sets recovery and recycling targets for it by material, and Member States report against them.
In 2022 the EU generated 186.6 kg of packaging waste per inhabitant. Municipal waste — what municipal authorities collect, or have collected on their behalf, most of it from homes — came to 514 kg per inhabitant in the same year. The two figures cannot be divided into one another. The packaging a household puts out is collected by the municipality and counted in both; the packaging that never reaches municipal collection is counted in the packaging series alone, because packaging waste is counted along the whole chain, from the producer through to the consumer.
An average that describes almost nobody
Twenty-two of twenty-seven Member States fall below the EU figure of 186.6 kg. Only five are above it.
That distribution is unusual, and it happens because the EU figure is a population-weighted average and the Member States above it include Germany and Italy — the Union's largest and third-largest populations. Two large high-packaging countries pull the aggregate above three quarters of the Member States.
Anyone reading 186.6 kg as a typical European figure is therefore reading it wrongly. The median Member State is Austria, at 163.2 kg.
The top
Luxembourg records 232.7 kg, Italy 232.2 kg and Ireland 231.7 kg, with Germany at 228.6 kg behind them.
Ireland combines that volume with one of the Union's lowest circular material use rates, 2.0% in 2024 — a small share of its total material use returned to circulation.
Italy is the contrast. It generates the second-highest amount of packaging waste per person in the Union, less than a kilogram behind Luxembourg, and records one of the highest circular material use rates, 21.6% in 2024. High throughput and high recirculation are not mutually exclusive, and Italy is the case that demonstrates it.
The bottom
Bulgaria records 80.9 kg, Croatia 82.2 kg, Cyprus 95.8 kg and Greece 105.0 kg.
Italy generates 2.9 times as much per person as Bulgaria, a ratio derived here. Six of the nine lowest figures are in central or eastern Europe, though the division is not clean: Poland is in the top ten and Sweden in the bottom third. What the ranking cannot say is why. Retail structure, how much a country consumes and the reporting differences noted below are all candidates, and none of them is measured here.
Why the reference year is 2022
Packaging waste is reported to the Commission on a longer cycle than most indicators here, and 2022 is the most recent year for which all 27 Member States have reported. The 2023 release is incomplete: four Member States are missing from it, so using it would mean comparing twenty-three countries against an aggregate built from twenty-seven.
Packaging waste generated per person, 2022
| Country | kg per inhabitant | Gap to EU averagederived |
|---|---|---|
| Luxembourg | 232.7 | +46.1 |
| Italy | 232.2 | +45.6 |
| Ireland | 231.7 | +45.1 |
| European Unionaggregate | 186.6 | — |
| Cyprus | 95.8be | −90.8 |
| Croatia | 82.2 | −104.4 |
| Bulgaria | 80.9 | −105.7 |
Flags carried by the source on these values: be break in time series, estimated
This table as data: CSV · JSON
Every Member State for this indicator+
Members see every Member State for this indicator here, not only the rows the ranking prints. Become a Member
Embed this chart
Paste this code into a page. The frame carries the source and the extraction date, and links back to the study.
What these figures cannot tell you
- Reporting definitions differ at the margin
- Member States report packaging placed on the market and packaging waste generated using national systems that differ in how they treat industrial and commercial packaging. Large differences between countries are meaningful; differences of a few kilograms are not. In the 2022 figures Eurostat marks Slovakia's value as compiled on a different definition and flags breaks in the Czech and Cypriot series, the Cypriot value being an estimate as well, so those three are the ones to read with most care.
- 2022, not 2025
- Packaging waste is reported with a longer lag than most indicators on this site, and the 2023 release is incomplete for four Member States. These figures are not directly comparable with the 2025 readings published elsewhere here.
- Generated, not discarded by households
- The stream includes packaging from commercial and industrial sources as well as households, so it is broader than what leaves a home. Countries with large distribution sectors record more of it.
- Neither stream contains the other
- The two series on this page overlap without either containing the other. Municipal waste is what municipal authorities collect, or have collected on their behalf, most of it from homes; packaging waste is all the packaging that becomes waste across the economy, production residues apart, counted from the producer through to the consumer. Household packaging is in both; packaging that never reaches municipal collection is in the packaging series alone, and the municipal waste that is not packaging in the municipal series alone. That is why the two per-person figures are set side by side here and no share is computed from them.
Frequently asked questions
- How much packaging waste does the EU generate?
- 186.6 kg per inhabitant in 2022. Municipal waste, a differently defined stream counted only where municipal authorities collect it or have it collected on their behalf, came to 514 kg per inhabitant in the same year.
- Which EU country generates the most packaging waste?
- Luxembourg, at 232.7 kg per person in 2022, narrowly ahead of Italy at 232.2 kg and Ireland at 231.7 kg.
- Which EU country generates the least packaging waste?
- Bulgaria, at 80.9 kg per person in 2022, followed by Croatia at 82.2 kg and Cyprus at 95.8 kg. Italy generates 2.9 times as much per person as Bulgaria.
- Why is the EU figure higher than most Member States?
- Because it is weighted by population, and two of the highest-packaging countries, Germany and Italy, are among the Union's most populous. Twenty-two of twenty-seven Member States fall below the EU average, so it should not be read as a typical national value.
Methodological note
Eurostat publishes packaging waste generated in kilograms per inhabitant under the packaging waste reporting obligation. This study uses the generation operation for 2022.
2022 is used rather than a later year because it is the most recent release with complete coverage of the 27 Member States: the 2023 data is missing four Member States, and comparing the other twenty-three against an EU aggregate built from twenty-seven would misstate the comparison.
The observation that the EU figure sits above twenty-two of the twenty-seven Member States, the median value, the ratio between the Italian and Bulgarian figures, the ranking positions of Poland and Sweden and the count of central and eastern European Member States among the nine lowest are derived by Silver Data Lab from the published values. The municipal waste figure of 514 kg per inhabitant is Eurostat's for 2022, the same year as the packaging figures, declared as the second source below; it is reported beside the packaging figure and no share is computed from the two, because the packaging series counts all the packaging that becomes waste across the economy, production residues apart, and the municipal series only what municipal authorities collect or have collected on their behalf. The circular material use rates quoted for Ireland and Italy are Eurostat's for 2024, declared as the third source; Eurostat flags both of those values as imputed.
Source data
This study draws on 3 datasets from Eurostat. Each can be inspected and re-downloaded from its catalogue, and the filters below are the ones applied.
Generation of packaging waste per capita
cei_pc040
- Filters applied:
- freq=A · waste=W1501 · wst_oper=GEN · unit=KG_HAB · time=2022
- Extracted:
- 2026-10-22
- Source last updated:
- 2026-10-21
Generation of municipal waste per capita
cei_pc031
- Filters applied:
- freq=A · wst_oper=GEN · unit=KG_HAB · time=2022
- Extracted:
- 2026-10-17
- Source last updated:
- 2026-10-15
Circular material use rate
cei_srm030
- Filters applied:
- freq=A · unit=PC · time=2024
- Extracted:
- 2026-08-11
- Source last updated:
- 2025-11-24
Download the data
The data the study you have just read is built on, exactly as it was downloaded and archived.
Yours as a Member.
Data downloadable by Members
How to cite
Record the vintage as well as the study: the figures on this page are the ones extracted on the dates below.
Silver Data Lab Research Desk (2026). Italy's Packaging Waste per Person Is 2.9 Times Bulgaria's. Silver Data Lab, published 14 May 2026, last updated 22 October 2026. https://www.silverdatalab.com/studies/packaging-waste-in-the-eu
- Data: Eurostat, Generation of packaging waste per capita (cei_pc040), filters freq=A, waste=W1501, wst_oper=GEN, unit=KG_HAB, time=2022; extracted 2026-10-22; source last updated 2026-10-21. https://doi.org/10.2908/cei_pc040
- Data: Eurostat, Generation of municipal waste per capita (cei_pc031), filters freq=A, wst_oper=GEN, unit=KG_HAB, time=2022; extracted 2026-10-17; source last updated 2026-10-15. https://doi.org/10.2908/cei_pc031
- Data: Eurostat, Circular material use rate (cei_srm030), filters freq=A, unit=PC, time=2024; extracted 2026-08-11; source last updated 2025-11-24. https://doi.org/10.2908/cei_srm030
Silver Data Lab's analysis is licensed CC BY 4.0. The statistics remain their publisher's and keep its terms of reuse.
Ask the research desk
A question about this study — a definition, a filter, a break in the series, what the figures can and cannot support — answered by the desk that made the extraction.
Members can write to the research desk
Other studies on the same dataset
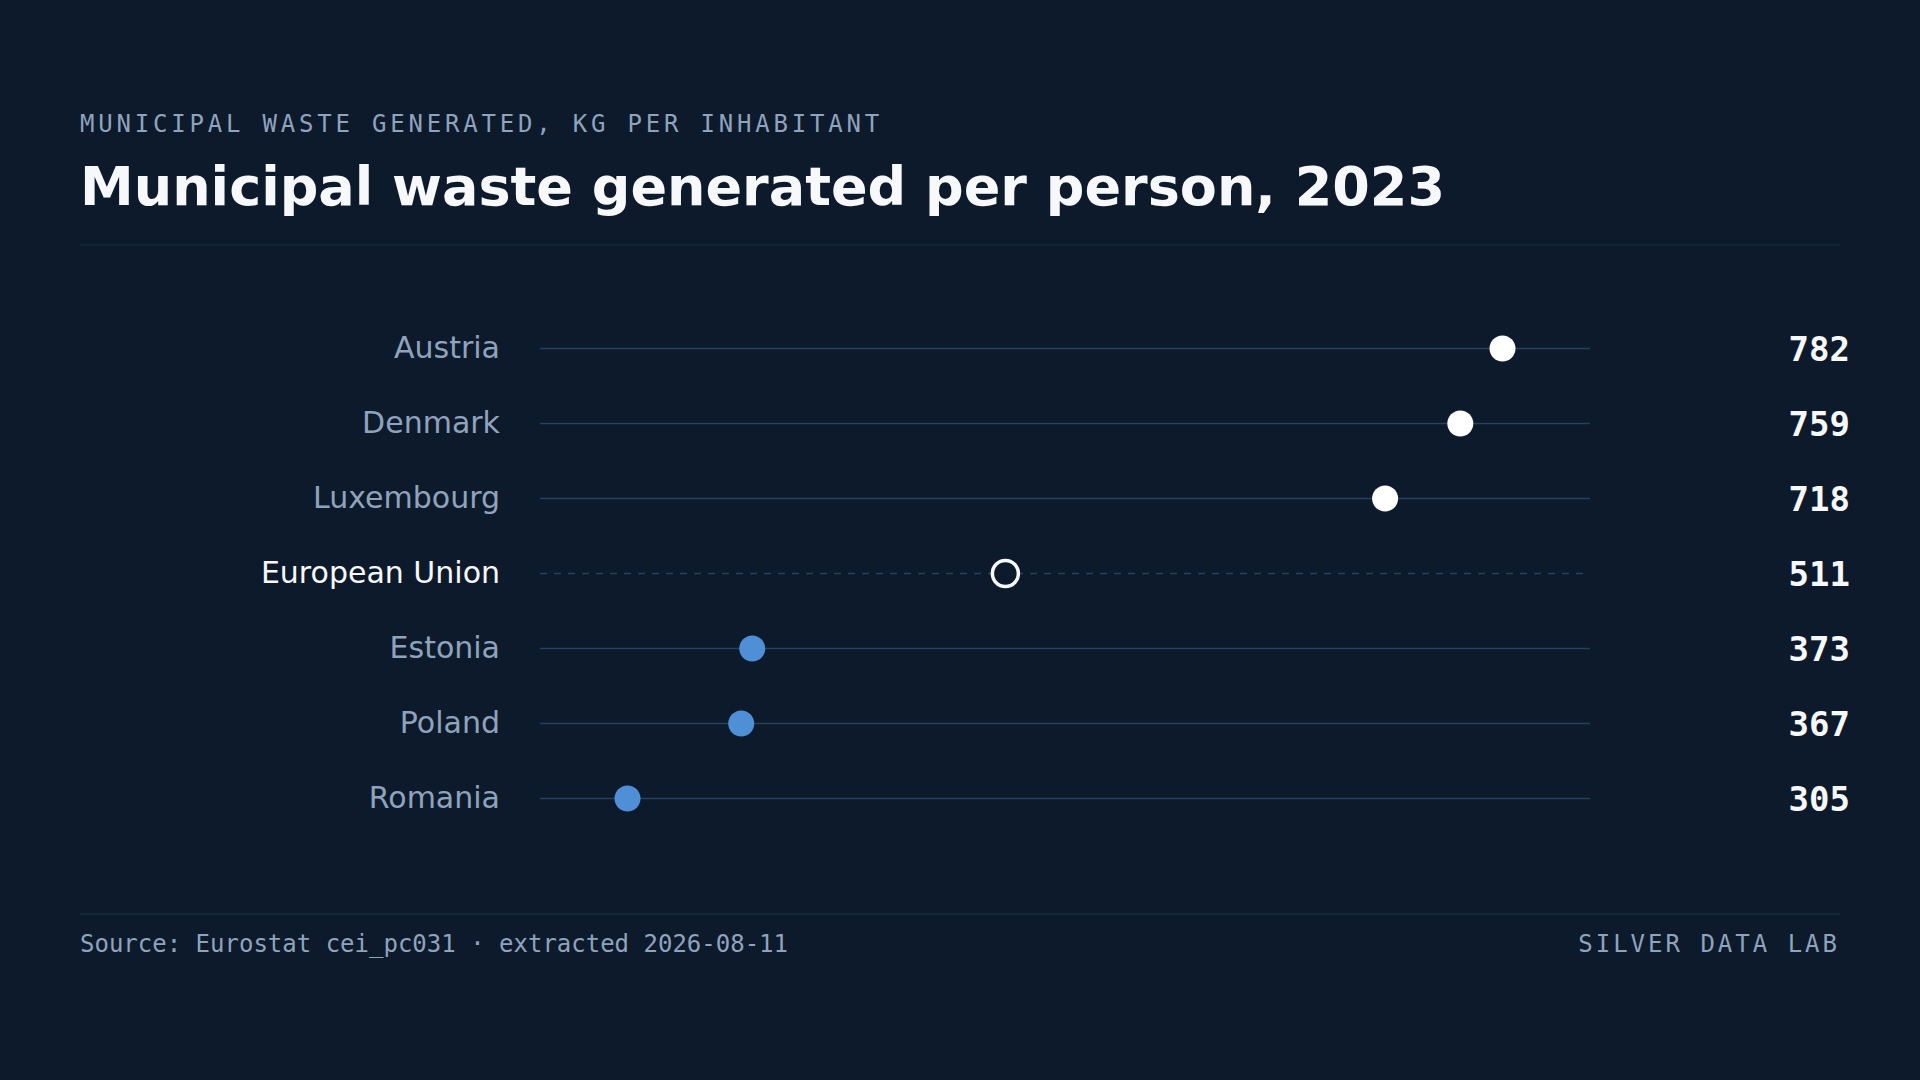
Austria Produces More Rubbish per Person Than Any Other EU Country
The EU generated 510 kg of municipal waste per inhabitant in 2023 — about 1.4 kg per person per day.
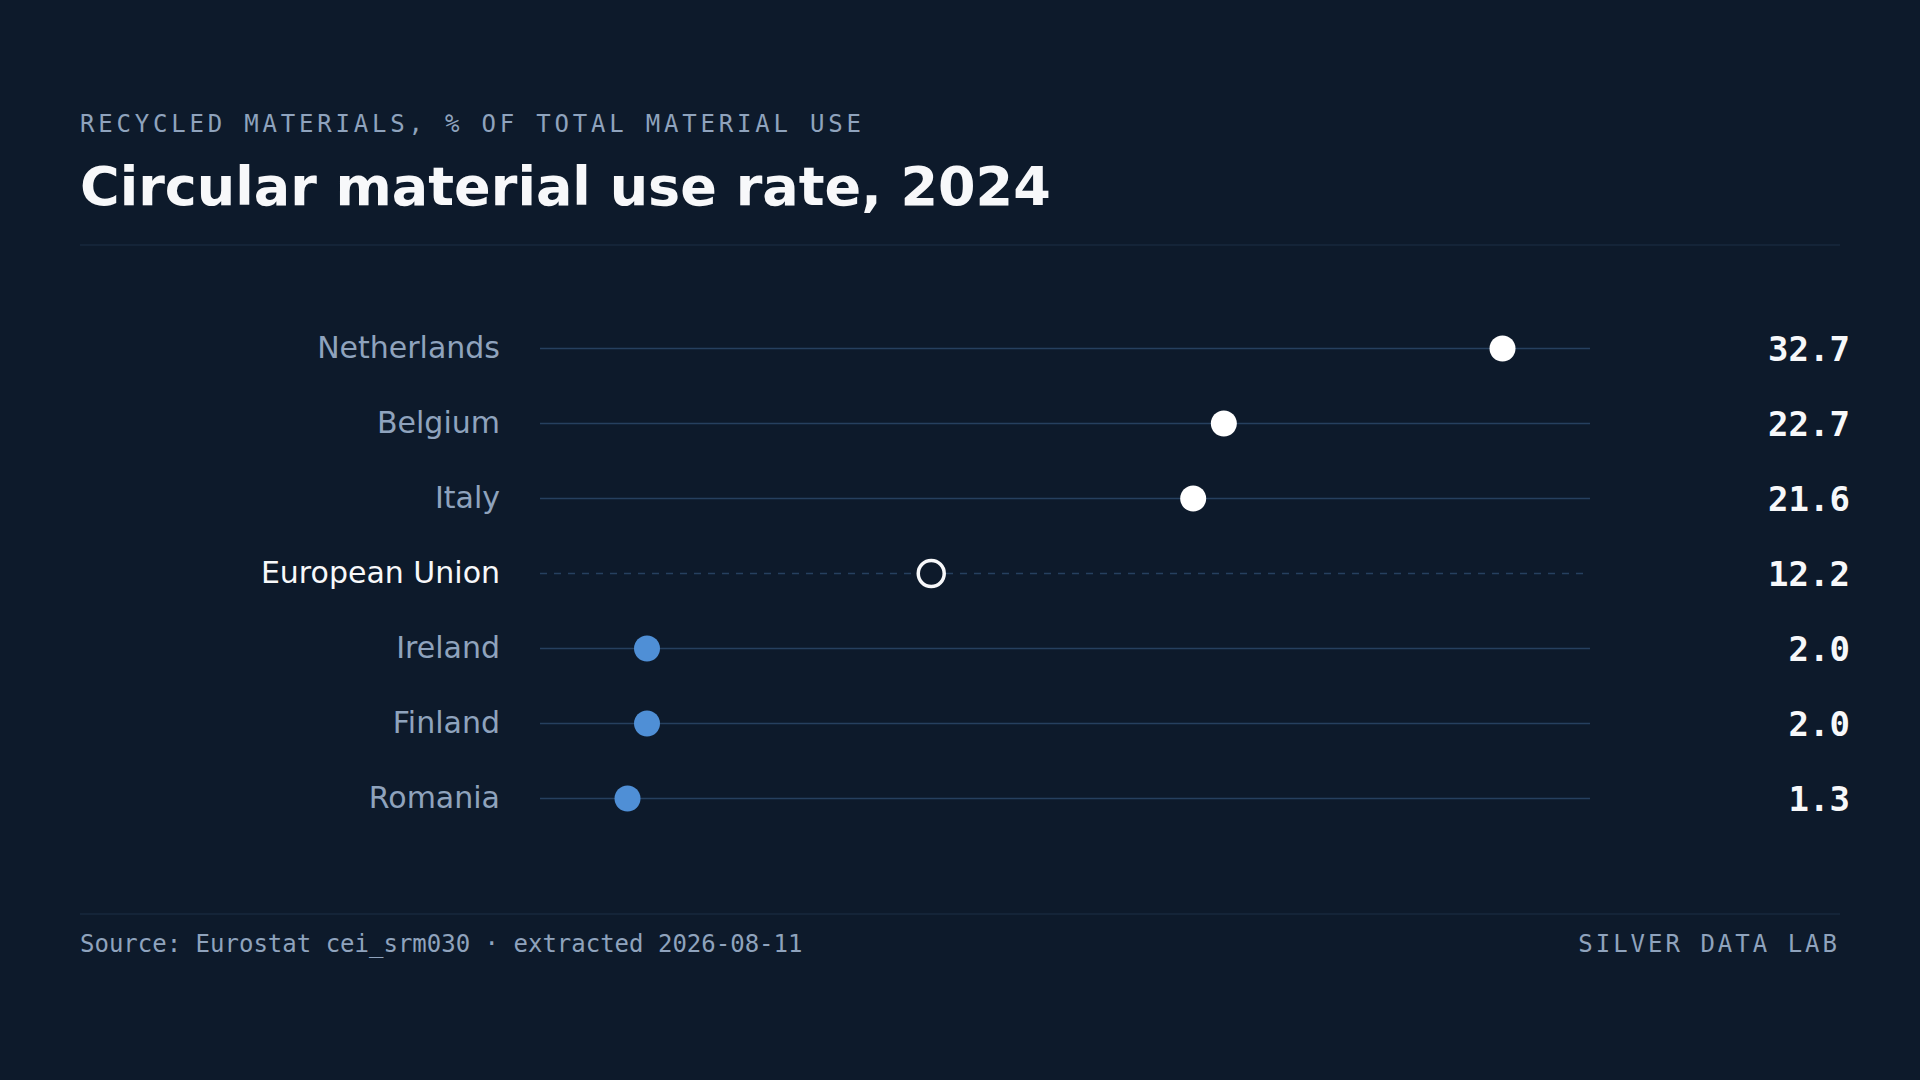
Recycling Supplies Just 12.2% of the Materials the EU Uses
12.2% of the materials used in the EU in 2024 came from recycling rather than from new extraction or imports.
Studies where the same country leads or trails
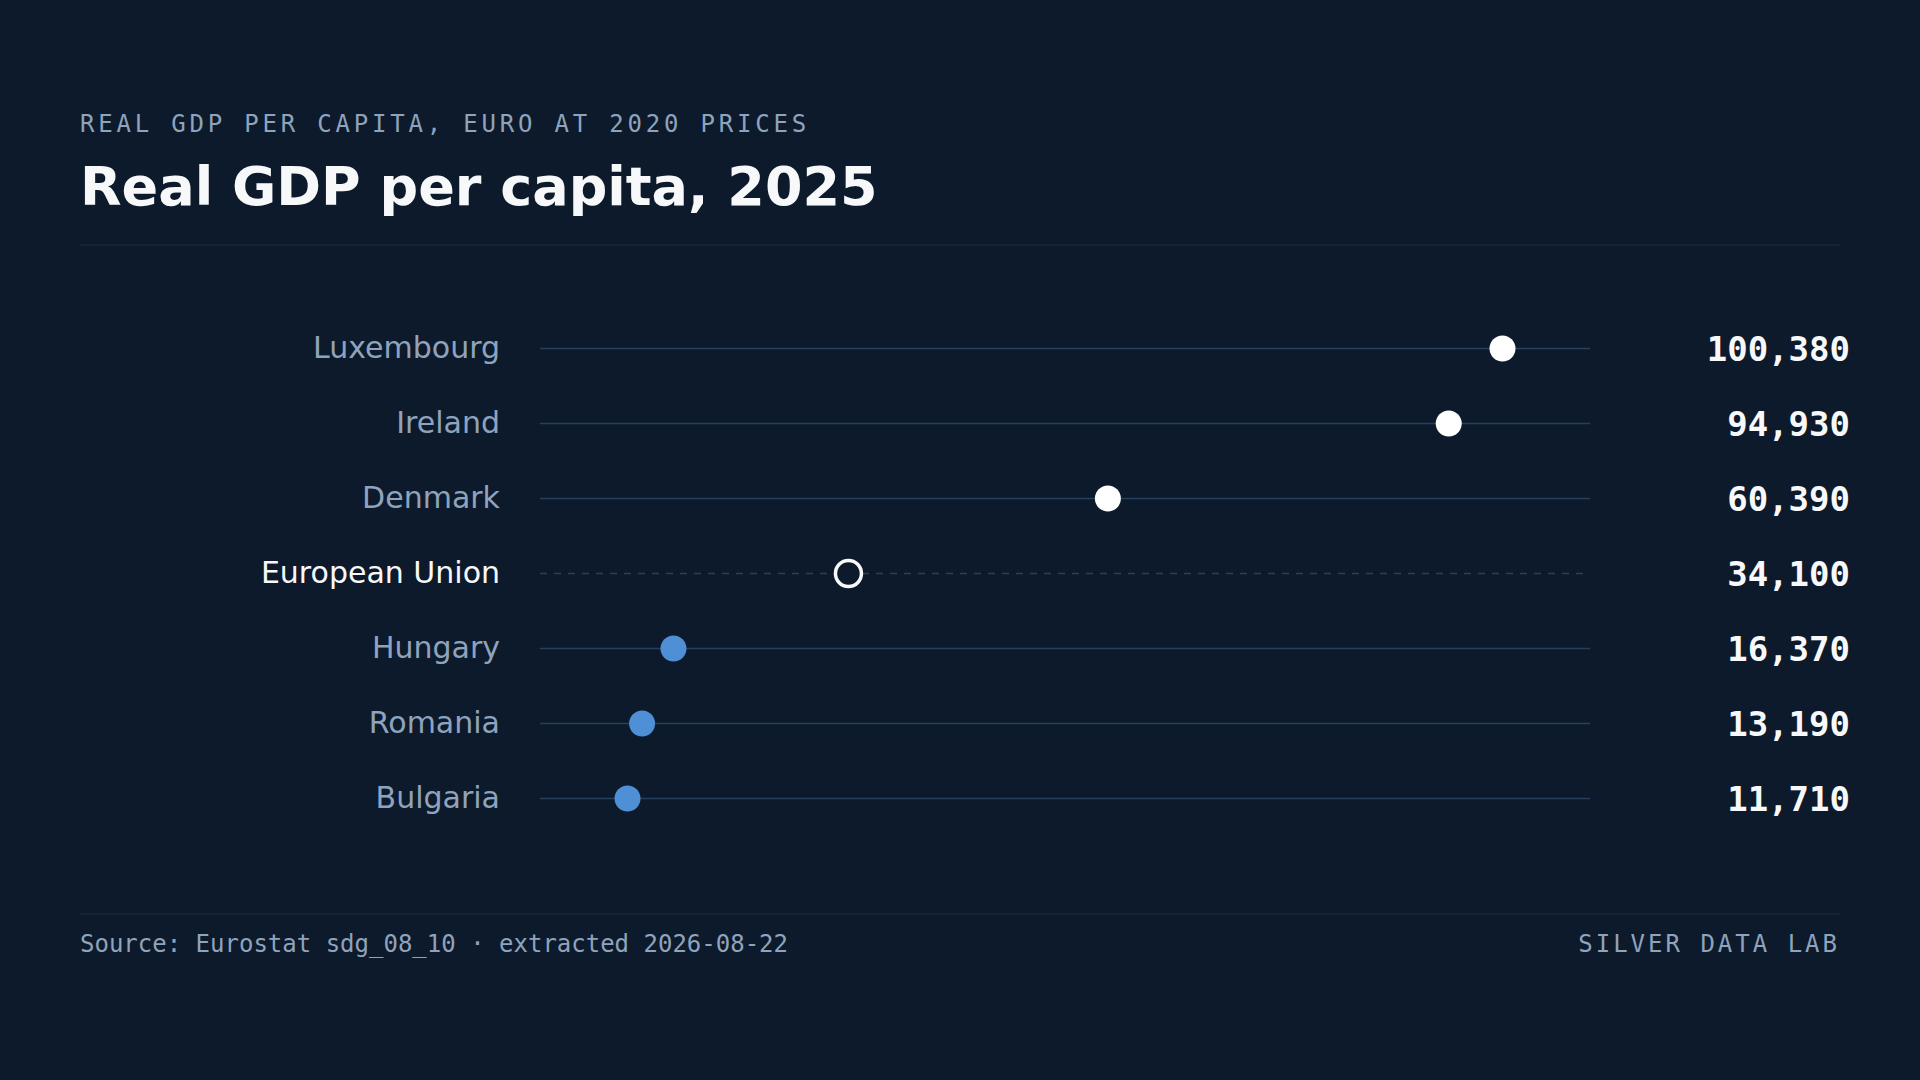
Bulgaria's GDP per Person Is About a Third of the EU Average
EU real GDP per capita was 34,250 euro in 2025, at 2020 prices.
EU Countries Sell 61.1% of Their Goods Exports to Each Other
61.1% of the goods exported by EU Member States in 2025 went to other Member States.
GDP per Head Makes Luxembourg and Ireland Look Richer Than They Are
Luxembourg records 239 and Ireland 238 against an EU average of 100 — more than double the Union's output per head.