GDP per Head Makes Luxembourg and Ireland Look Richer Than They Are
Silver Data Lab Research Desk · Statistical analysis · Published on 12 July 2026
- Data source
- Eurostat
- Reference period
- 2025
- Last updated
- 11 October 2026
Re-checked against the source on 11 August 2026. No value in its datasets has moved between the snapshots we hold. Every revision we have observed →
Key estimates
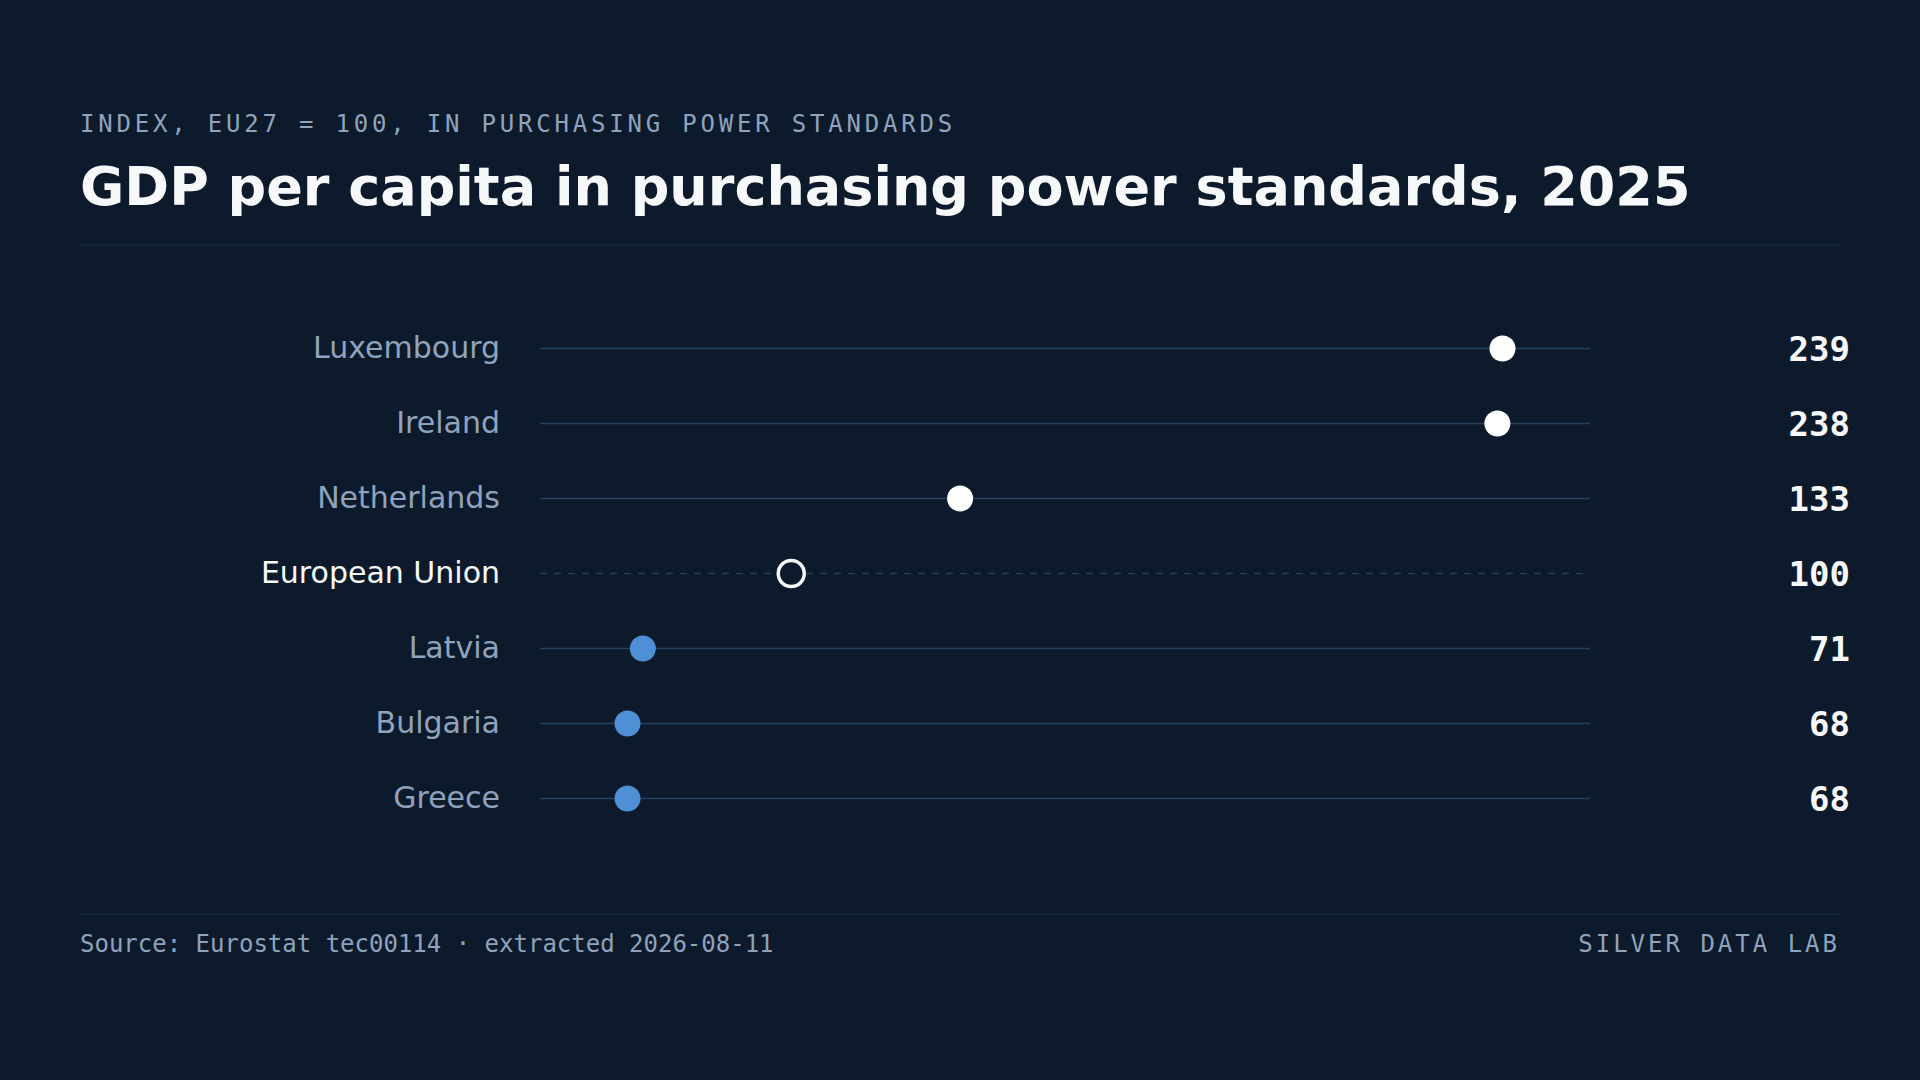
- Luxembourg records 239 and Ireland 238 against an EU average of 100 — more than double the Union's output per head.
- Neither number is a statement about living standards: both are produced by how the ratio is built rather than by what residents earn.
- Ten Member States sit above the EU average and seventeen below it, so the average describes a minority of the Union.
- Greece and Bulgaria are lowest at 68, meaning the published spread runs from 68 to 239 on a scale where the EU is 100.
- Excluding the two distorted readings, the range narrows to 68 in Greece and Bulgaria against 133 in the Netherlands.
An index that does not mean what it looks like
GDP per capita is the most cited measure of how rich a country is, and it is a fraction: everything an economy produces in a year, divided by the number of people living there. Expressed in purchasing power standards, which strip out price differences between countries, it is meant to make national living standards comparable.
For most of the EU it does that job. For the two countries at the top of the ranking it does not, and the reason is in the construction of the fraction rather than in the data.
The top of the table
Luxembourg records 239 against an EU average of 100. Ireland records 238. The Netherlands, third, records 133 — a hundred points below.
A gap that large between second and third place is a warning sign rather than a finding. Two economies do not produce nearly twice the output per person of the third-richest country in the Union through ordinary differences in productivity.
Why the numerator and the denominator disagree
In Luxembourg, a large share of the work is done by people who do not live there. Cross-border commuters from Belgium, France and Germany contribute to output, which sits in the numerator, and are counted as residents of their own countries, which keeps them out of the denominator. The ratio is arithmetically correct and describes no one's income.
In Ireland the distortion sits in the numerator itself. Multinational groups domiciled there book profits and hold intellectual property assets whose returns count as Irish output without corresponding to activity, employment or income in Ireland. The effect is large enough that Ireland's own statistical office publishes a modified national income aggregate specifically to give a usable picture of the domestic economy.
Both are known, documented features of the measure. Neither is an error in the data.
What the ranking says once you read past the top
Ten Member States sit above the EU average and seventeen below it. An average that describes fewer than four in ten of the countries it covers is being pulled upward by the tail, which is exactly what the two readings above 230 do.
Below the distorted pair, the Union's actual spread runs from 133 in the Netherlands down to 68 in Greece and Bulgaria: a factor of roughly two between the highest and lowest, not the factor of three-and-a-half the raw table suggests. Denmark at 127, Austria at 118 and Germany at 115 lead the group that behaves normally; Latvia at 71 and Hungary at 76 sit near the bottom with Slovakia at 75.
The convergence question the index is usually asked to answer — whether poorer Member States are catching up — cannot be settled by a single year, and this study does not attempt it. What a single year can establish is which numbers in the table are safe to compare, and that is the smaller job worth doing first.
GDP per capita in purchasing power standards, 2025
| Country | Index, EU27 = 100 | Gap to EU averagederived |
|---|---|---|
| Luxembourg | 239p | +139.0 |
| Ireland | 238 | +138.0 |
| Netherlands | 133 | +33.0 |
| European Unionaggregate | 100 | — |
| Latvia | 71 | −29.0 |
| Bulgaria | 68p | −32.0 |
| Greece | 68p | −32.0 |
Flags carried by the source on these values: p provisional
This table as data: CSV · JSON
Every Member State for this indicator+
Members see every Member State for this indicator here, not only the rows the ranking prints. Become a Member
Embed this chart
Paste this code into a page. The frame carries the source and the extraction date, and links back to the study.
What these figures cannot tell you
- Two values in this ranking do not measure living standards
- Luxembourg's figure is inflated because cross-border commuters contribute to output without being counted in the resident population, and Ireland's because multinational profit and intellectual property flows enter national output without matching domestic activity. Both are well documented, and Ireland's statistical office publishes a modified aggregate for precisely this reason. They are reported here because they are the published figures, and flagged because reading them as income per person is wrong.
- This is an index, not an amount
- Values are expressed against an EU average fixed at 100, in purchasing power standards. A reading of 68 means an economy produces 68% of the Union's output per head, not that it produces any particular sum. Indices from different reference years are not comparable with one another.
- Output per head is not income per head
- GDP measures production, not what reaches households. Profits accruing to foreign owners, retained corporate earnings and depreciation all sit inside GDP and never appear in anyone's disposable income. For what households actually receive, the sector accounts are the right source, and they tell a different story.
- Purchasing power standards are estimates
- The conversion rests on price surveys of a comparable basket of goods and services, and carries the uncertainty of that construction. It is appropriate for comparing countries in a given year and inappropriate for tracking change over time, for which volume series are the correct measure.
Frequently asked questions
- Which EU country has the highest GDP per capita?
- Luxembourg, at 239 against an EU average of 100 in 2025, narrowly ahead of Ireland at 238. Both figures are distorted by how the ratio is constructed and should not be read as living standards. The highest reading that measures what it appears to measure is the Netherlands, at 133.
- Why is Ireland's GDP per capita so high?
- Because multinational groups domiciled in Ireland book profits and hold intellectual property whose returns count as Irish output without corresponding to activity, employment or income in the country. The distortion is large enough that Ireland's own statistical office publishes a separate modified aggregate to describe the domestic economy.
- Why is Luxembourg's GDP per capita so high?
- Because a large share of the work done in Luxembourg is done by people who live in Belgium, France and Germany. Their output is counted in the numerator of the ratio while they are absent from the resident population in the denominator, which raises the result without raising anyone's income.
- Which EU country has the lowest GDP per capita?
- Greece and Bulgaria, both at 68 against an EU average of 100 in 2025, followed by Latvia at 71 and Slovakia at 75.
- Does GDP per capita measure how well off people are?
- Only loosely. It measures production divided by population, not income received by households. Corporate profits accruing abroad, retained earnings and depreciation all sit inside GDP without reaching anyone's pocket, which is why ten Member States sit above the EU average while seventeen sit below it.
Methodological note
GDP per capita is published as an index of real expenditure per head in purchasing power standards, with the EU27 average set to 100 for the reference year. The values here are for 2025, the most recent year available at the extraction date.
Purchasing power standards are an artificial common currency in which one unit buys the same volume of goods and services in every Member State, which removes price level differences from the comparison.
The counts of Member States above and below the EU average, and the range quoted once Luxembourg and Ireland are set aside, are derived by Silver Data Lab from the published index values. Eurostat publishes the index, not those summaries.
Source data
The underlying series can be inspected and re-downloaded from the Eurostat data browser. The filters below are the ones applied.
GDP per capita in PPS
tec00114
- Filters applied:
- freq=A · indic_ppp=VI_PPS_EU27_2020_HAB · ppp_cat18=GDP · time=2025
- Extracted:
- 2026-08-11
- Source last updated:
- 2026-07-09
Download the data
The data the study you have just read is built on, exactly as it was downloaded and archived.
Yours as a Member.
Data downloadable by Members
How to cite
Record the vintage as well as the study: the figures on this page are the ones extracted on the dates below.
Silver Data Lab Research Desk (2026). GDP per Head Makes Luxembourg and Ireland Look Richer Than They Are. Silver Data Lab, published 12 July 2026, last updated 11 October 2026. https://www.silverdatalab.com/studies/gdp-per-capita-in-the-eu
- Data: Eurostat, GDP per capita in PPS (tec00114), filters freq=A, indic_ppp=VI_PPS_EU27_2020_HAB, ppp_cat18=GDP, time=2025; extracted 2026-08-11; source last updated 2026-07-09. https://doi.org/10.2908/tec00114
Silver Data Lab's analysis is licensed CC BY 4.0. The statistics remain their publisher's and keep its terms of reuse.
Ask the research desk
A question about this study — a definition, a filter, a break in the series, what the figures can and cannot support — answered by the desk that made the extraction.
Members can write to the research desk
Other studies on the same dataset
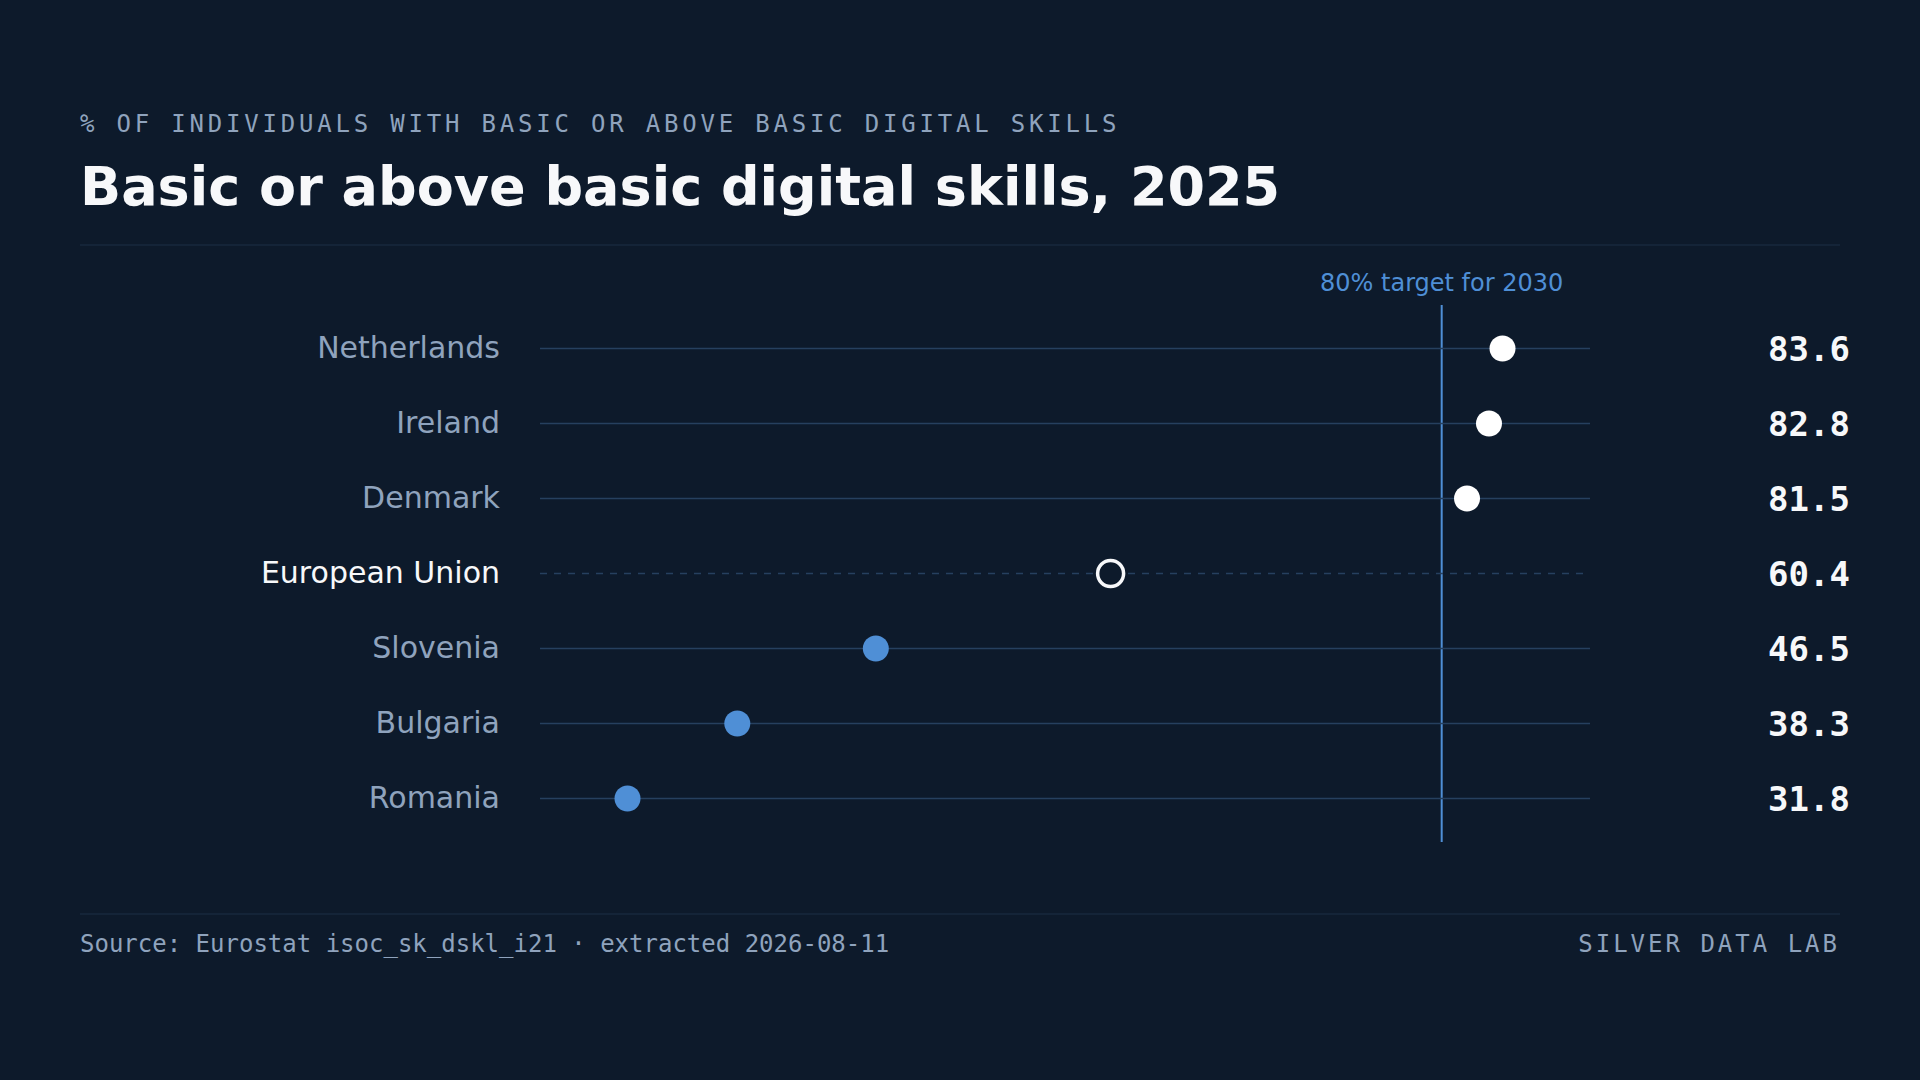
In Four EU Countries, Over 80% of People Have Basic Digital Skills
60.4% of people in the EU had at least basic overall digital skills in 2025, against the 80% the Union targets for 2030.
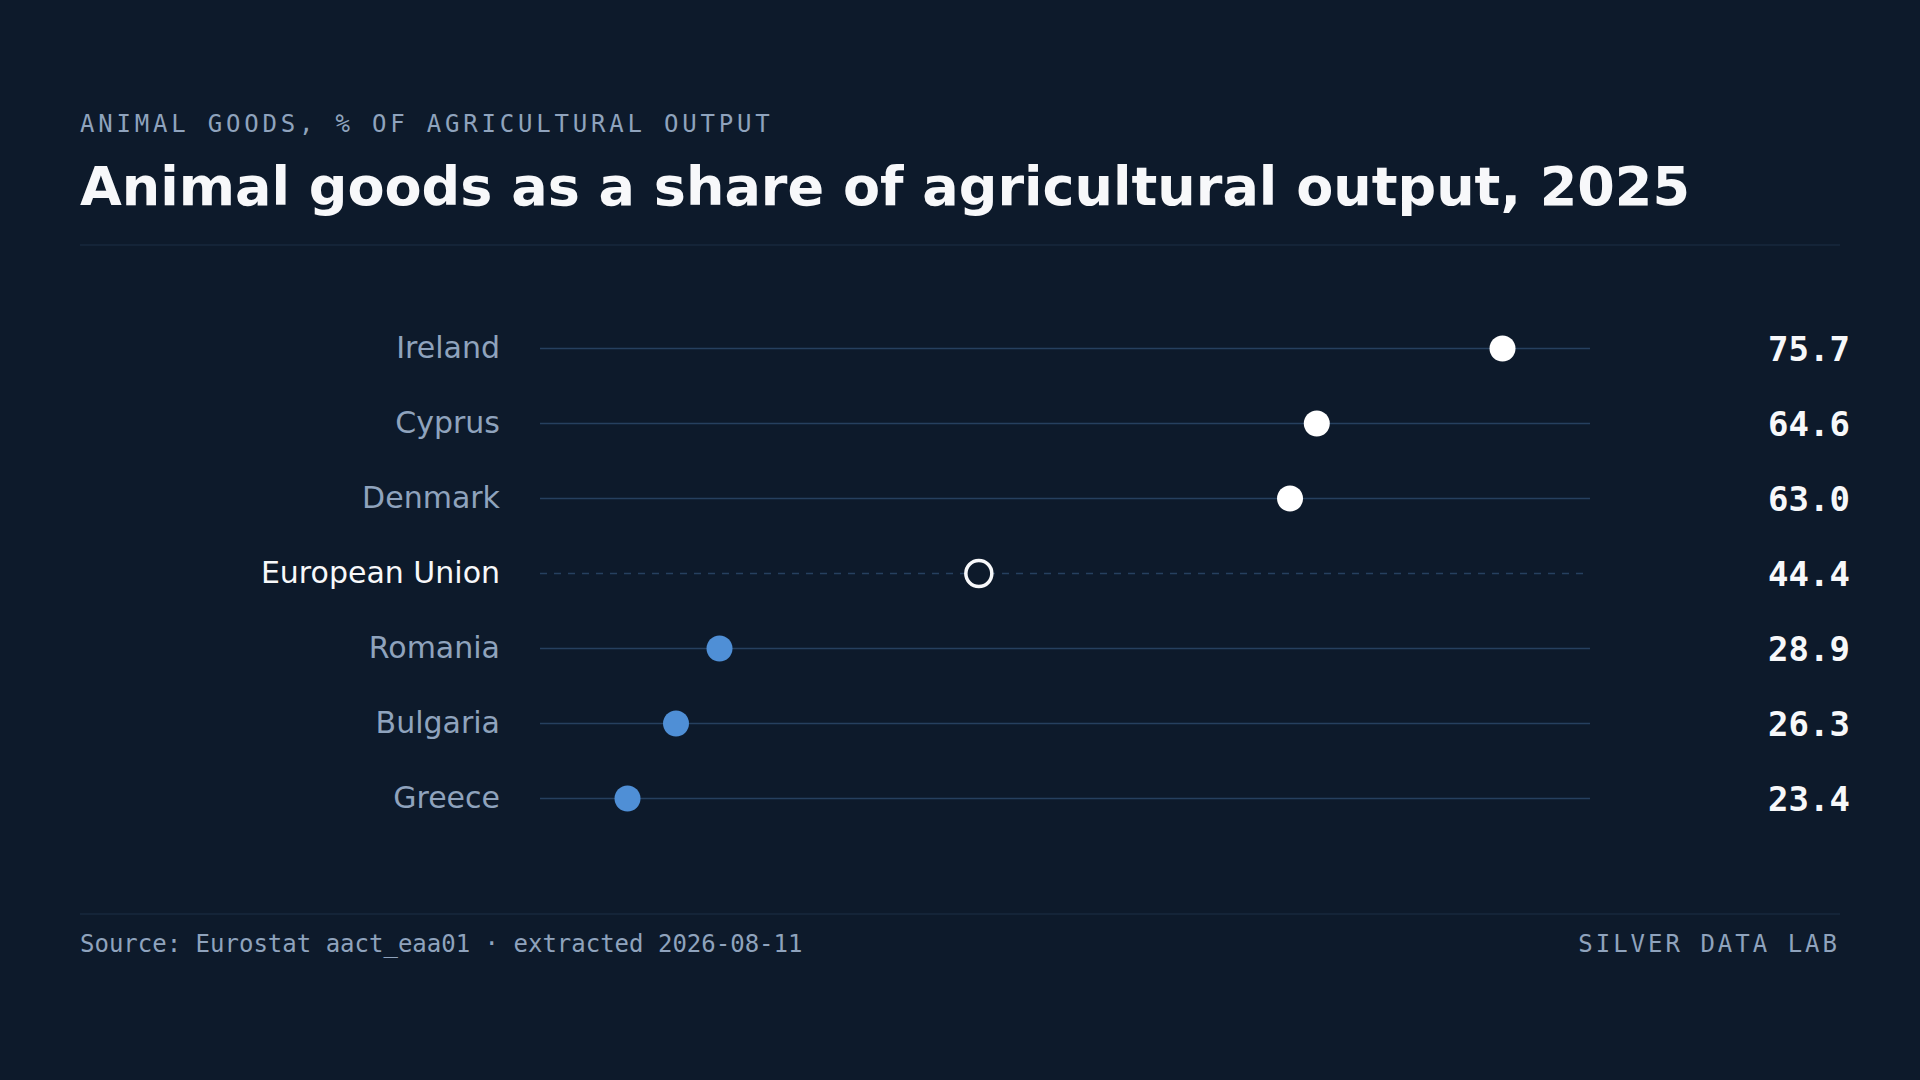
Three Quarters of Irish Farm Output Comes From Animals
Animal goods accounted for 44.4% of EU agricultural output by value in 2025.
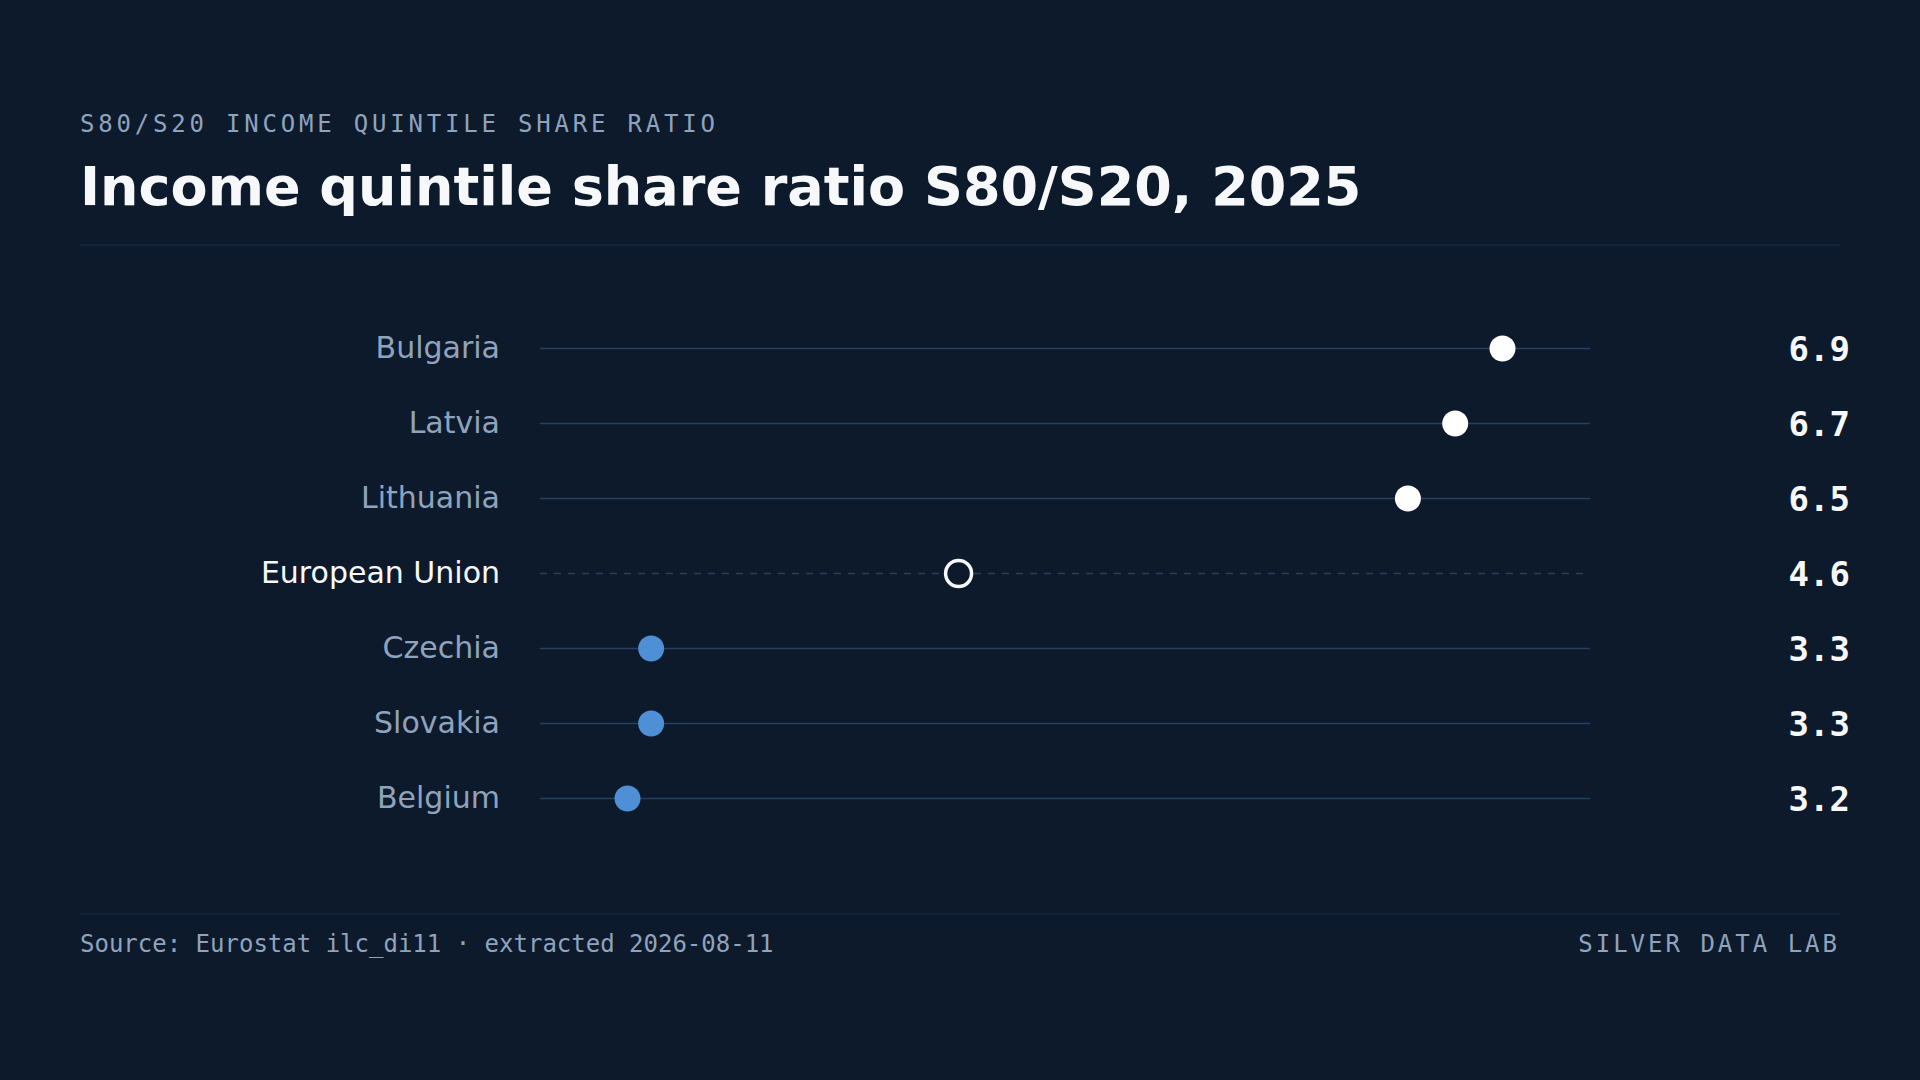
Bulgaria Has the EU's Widest Gap Between Rich and Poor
Across the EU, the richest fifth of the population received 4.6 times the income of the poorest fifth in 2025.
Studies where the same country leads or trails
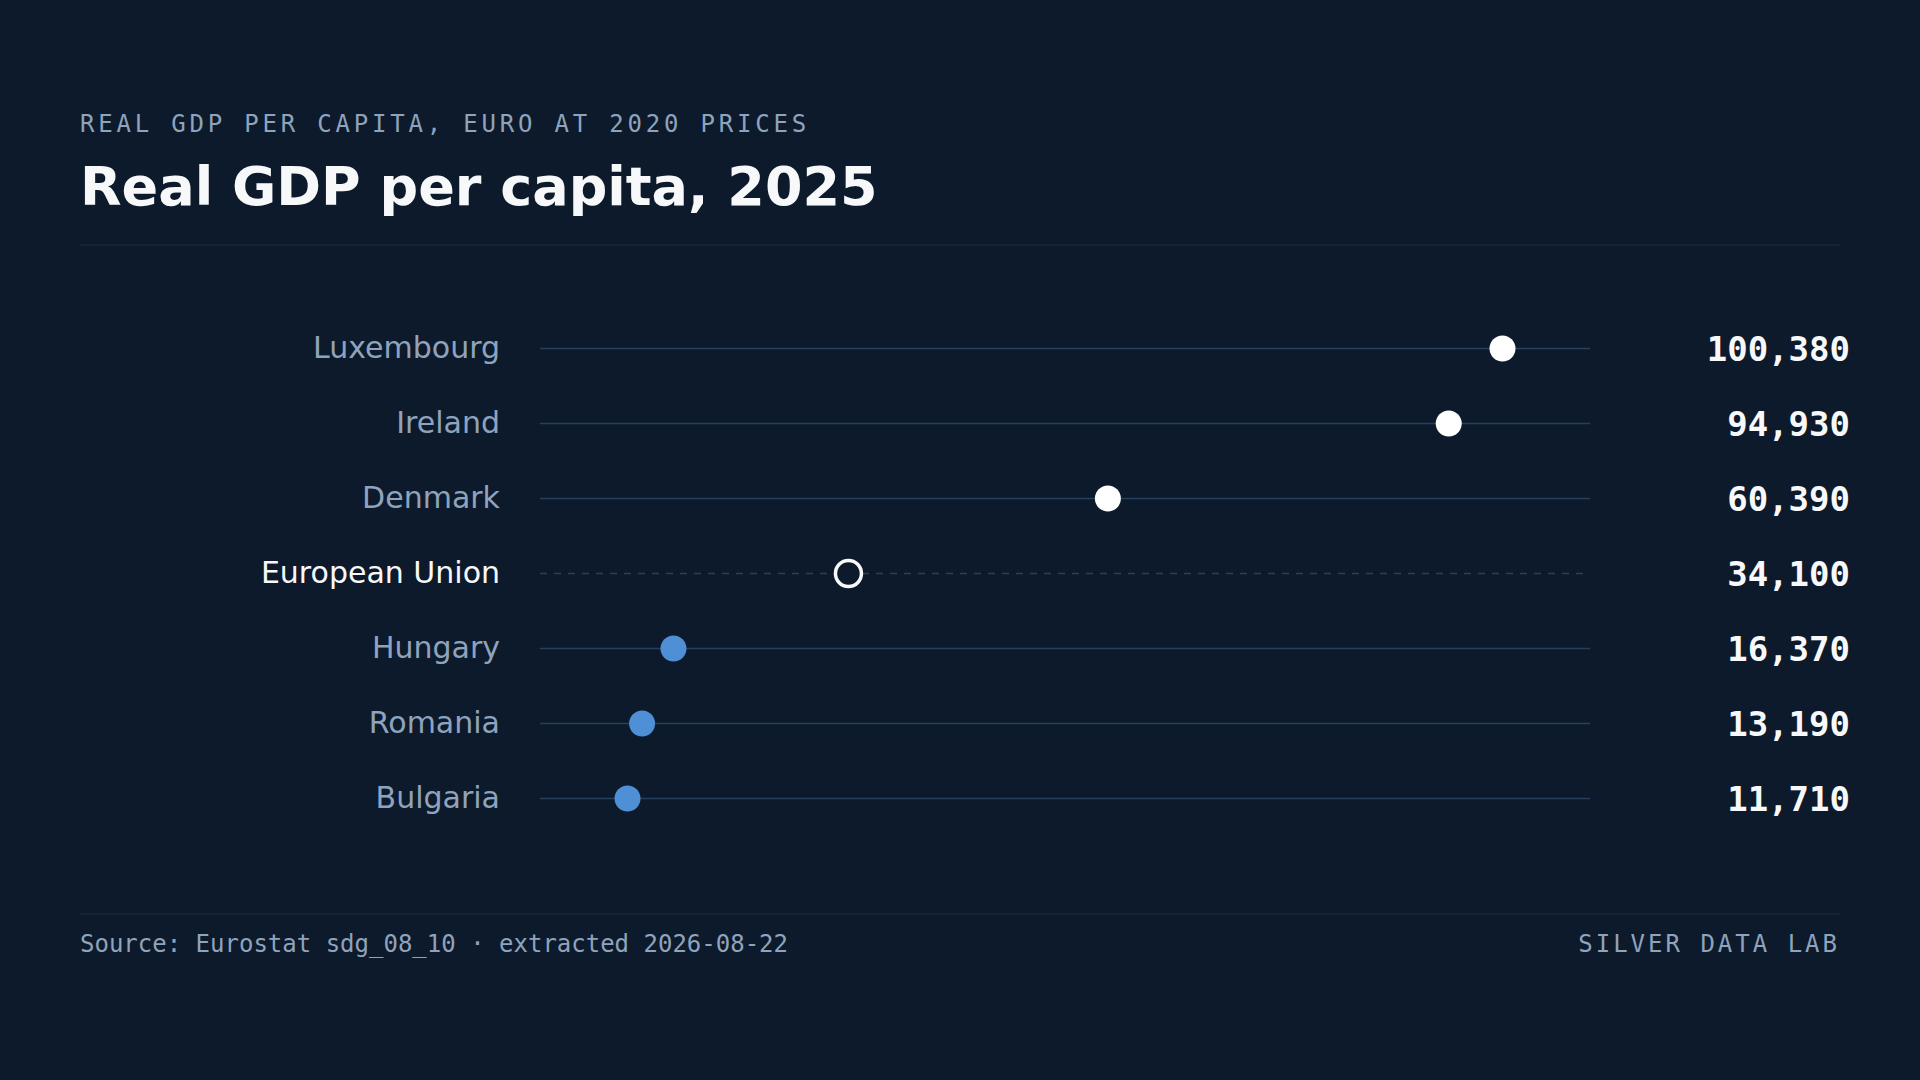
Bulgaria's GDP per Person Is About a Third of the EU Average
EU real GDP per capita was 34,250 euro in 2025, at 2020 prices.
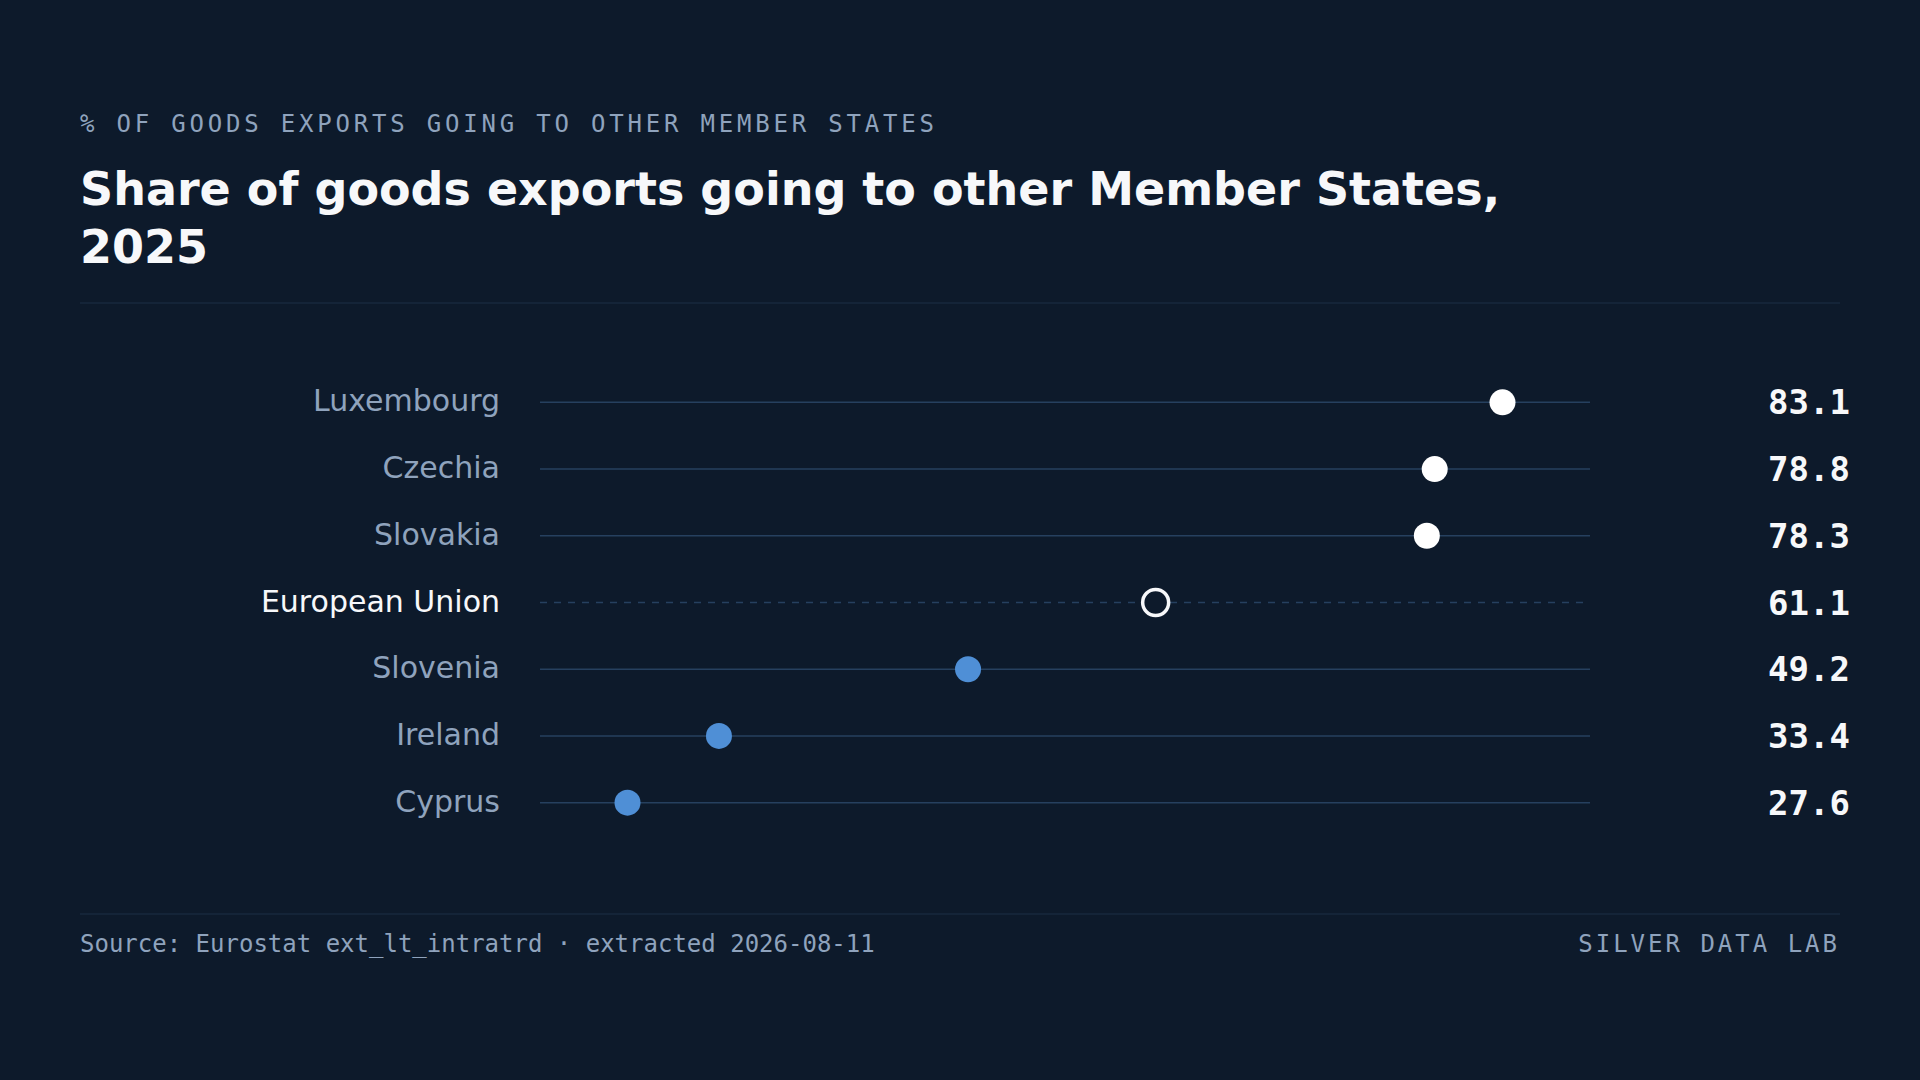
EU Countries Sell 61.1% of Their Goods Exports to Each Other
61.1% of the goods exported by EU Member States in 2025 went to other Member States.
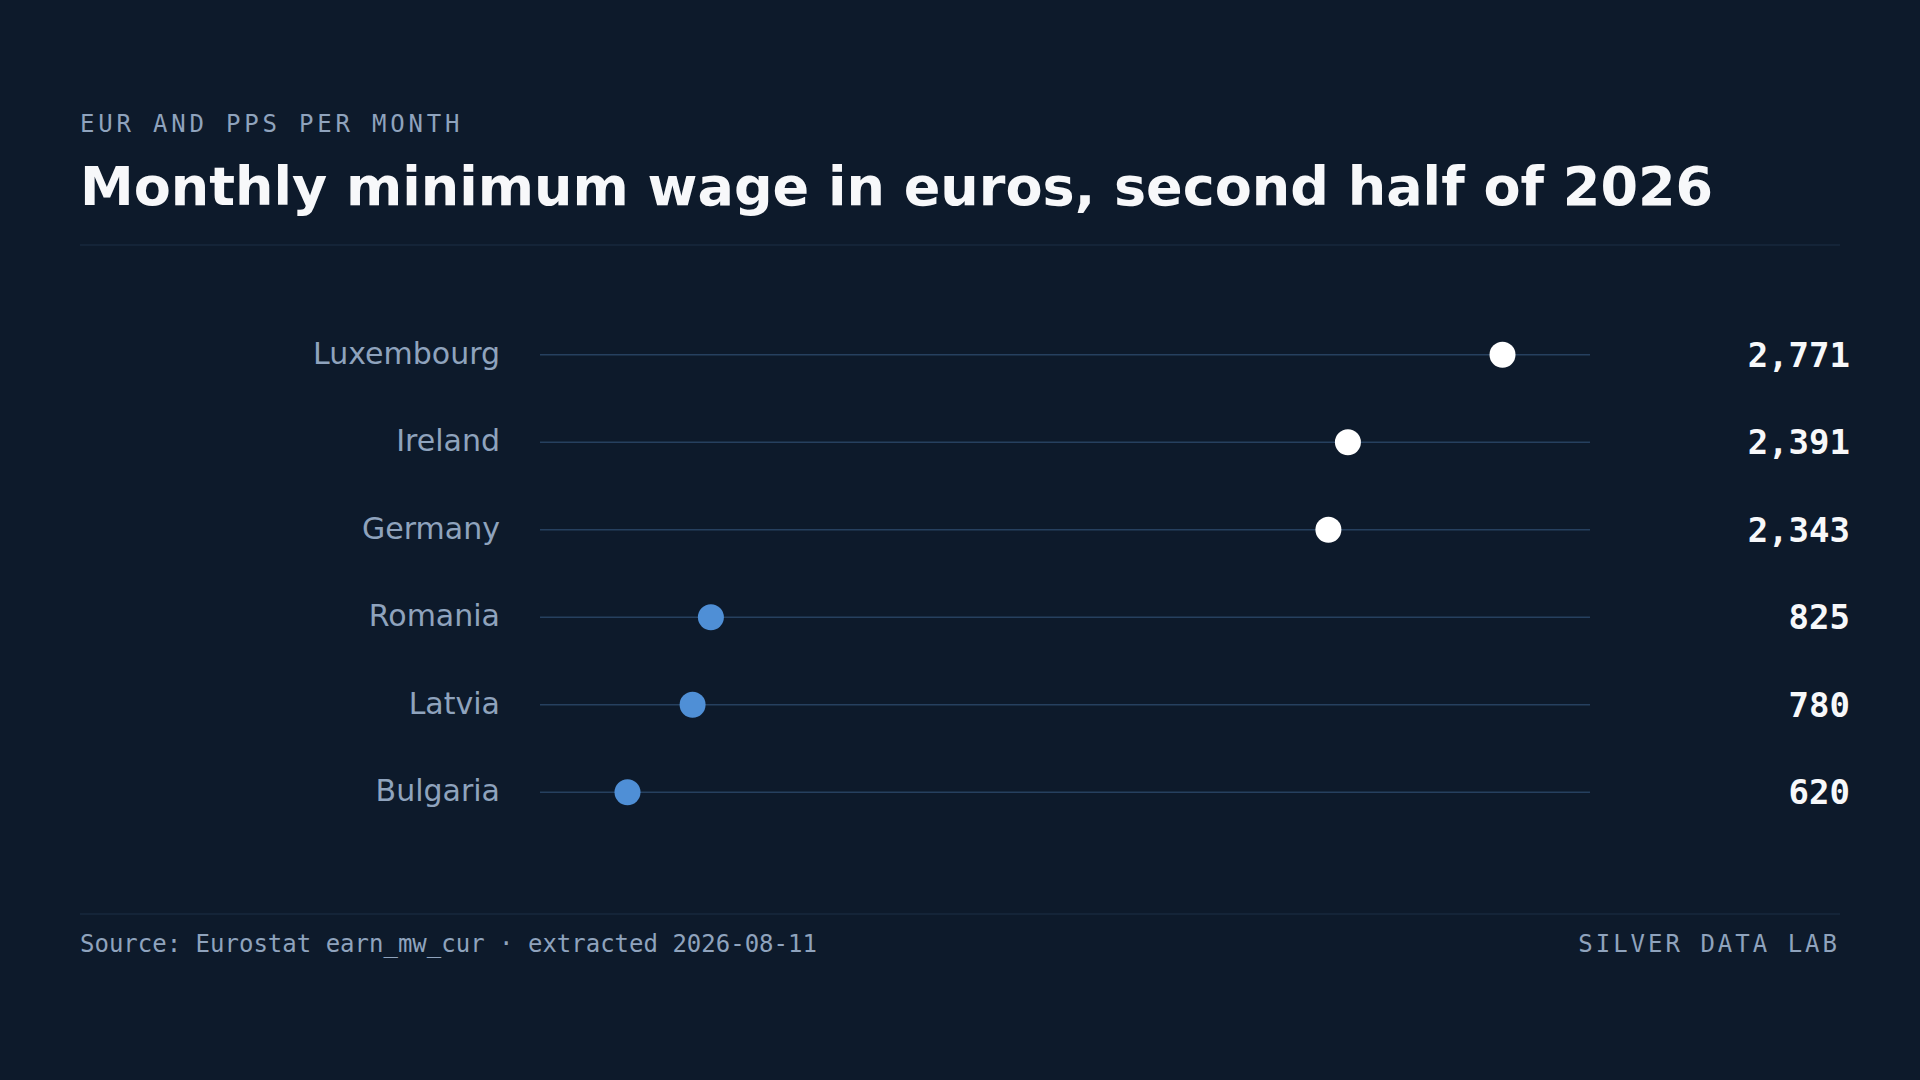
Germany's Legal Minimum Wage Buys More Than Any Other in the EU
22 of the 27 Member States set a statutory minimum wage. Austria, Denmark, Finland, Italy and Sweden do not, leaving pay floors to collective agreements.