Recycling Supplies Just 12.2% of the Materials the EU Uses
Silver Data Lab Research Desk · Statistical analysis · Published on 27 November 2025
This study is open to members only
Its sources, filters and extraction date are declared above, as they are for every study. Sign in to read the analysis in full.
- Data source
- Eurostat
- Reference period
- 2024
- Last updated
- 11 October 2026
Re-checked against the source on 11 August 2026. No value in its datasets has moved between the snapshots we hold. Every revision we have observed →
Key estimates
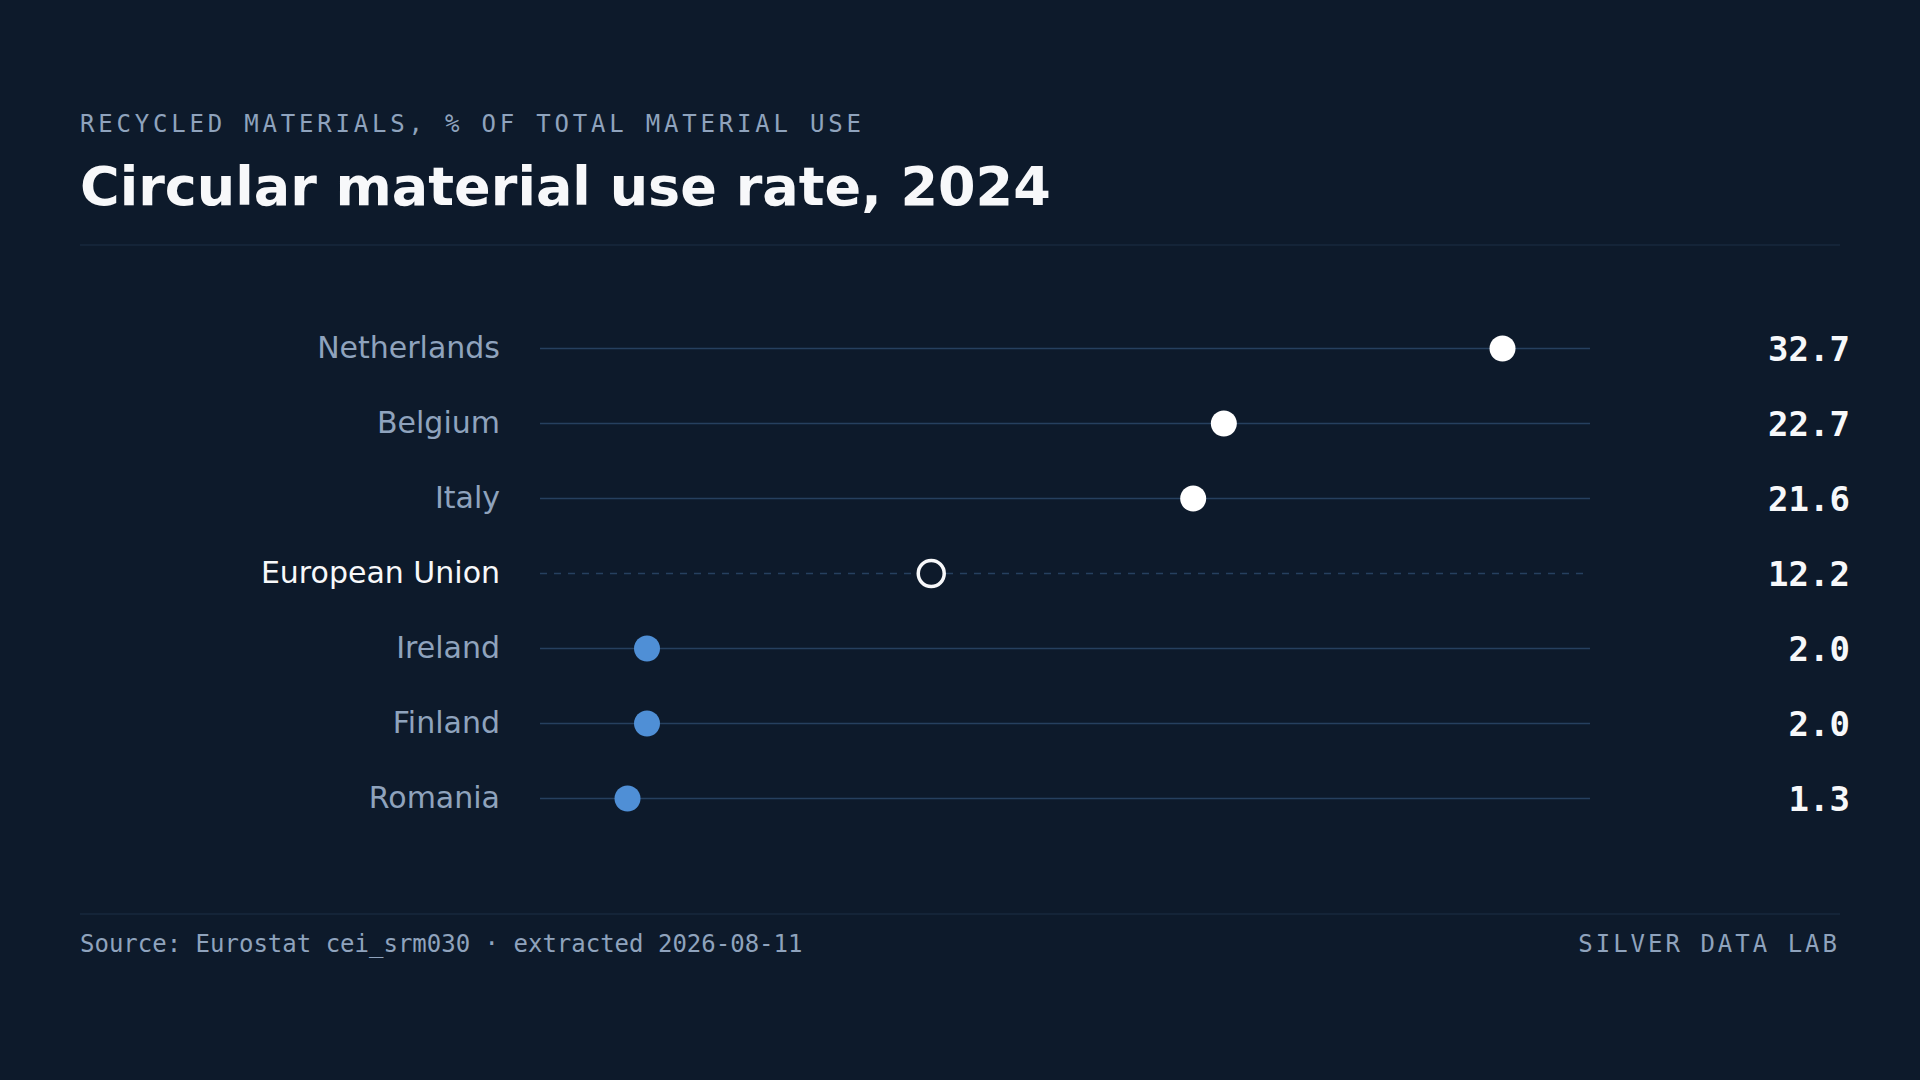
- 12.2% of the materials used in the EU in 2024 came from recycling rather than from new extraction or imports.
- The Netherlands records 32.7%, nearly a third, and Belgium 22.7%.
- Romania records 1.3%, Ireland 2.0% and Finland 2.0%.
- Nine Member States are above the EU rate and seventeen below it, with Slovakia exactly on it.
- The Dutch rate is 25 times the Romanian one.
The one indicator that measures circularity directly
Recycling rates measure what happens to waste. The circular material use rate measures something harder and more useful: of all the material an economy puts into use in a year, what proportion came back round rather than being dug up, grown or imported.
For the European Union in 2024 the answer was 12.2%. Roughly one eighth.
The other seven eighths were new material entering the economy for the first time.
The Netherlands, and why it leads
The Netherlands records 32.7%, well ahead of Belgium at 22.7% and Italy at 21.6%. Estonia at 20.5% completes the group above 20%.
Two things push the Dutch figure up, and only one of them is policy. The Netherlands has an established recycling and materials-recovery sector, which is the intended reading. It also has a small extractive sector and a dense economy, which means the denominator — total material consumption — is smaller than it would be in a country quarrying its own aggregates.
The rate is a ratio, and a country can raise it by recycling more or by extracting less. Both are visible in this ranking and the indicator does not separate them.
The bottom, and why it is not a ranking of effort
Romania records 1.3%, Ireland and Finland 2.0% and Portugal 3.0%.
Ireland and Finland are the entries that matter here, because neither is a poor country and neither has weak environmental administration. Finland has a large forestry and mining sector; Ireland extracts substantial volumes of aggregates for construction. In both, the volume of primary material moving through the economy is very large relative to the recycled fraction, and the rate falls accordingly.
Reading this as a league table of environmental commitment would therefore be a mistake. It ranks material composition, and material composition follows industrial structure at least as much as it follows policy.
What a 12.2% rate implies
The Union has a target-setting framework built around raising this figure, and the arithmetic of doing so is unforgiving. Roughly seven eighths of material use is primary, and much of that is construction minerals and fossil fuels — categories that are either difficult to recycle or destroyed in use.
Doubling the rate would not mean doubling recycling. It would mean changing what the economy is built out of.
Circular material use rate, 2024
| Country | % of material use | Gap to EU averagepercentage points, derived |
|---|---|---|
| Netherlands | 32.7i | +20.5 |
| Belgium | 22.7i | +10.5 |
| Italy | 21.6i | +9.4 |
| European Unionaggregate | 12.2i | — |
| Ireland | 2.0i | −10.2 |
| Finland | 2.0i | −10.2 |
| Romania | 1.3i | −10.9 |
Flags carried by the source on these values: i value imputed by Eurostat
This table as data: CSV · JSON
Every Member State for this indicator+
Members see every Member State for this indicator here, not only the rows the ranking prints. Become a Member
What these figures cannot tell you
- A ratio with two moving parts
- The rate rises if recycled material increases or if total material consumption falls. A country with a small extractive sector scores higher than an identical country that quarries its own stone, without recycling any more.
- Fossil fuels and construction dominate the denominator
- Much of the material entering a modern economy is fossil fuel, which is burnt, and construction minerals, which stay in place for decades. Neither is available for recirculation in the year it is used, which caps how high this rate can realistically go.
- Traded waste crosses borders
- Recyclable material is imported and exported, and it is counted where it enters use. A country that exports its recyclate for processing elsewhere records it differently from one that processes it domestically.
- 2024, and a slow-moving series
- Material flow accounts are compiled with a long lag and move gradually. A single year's reading is a position rather than a trend, and short-run changes can reflect construction activity more than recycling behaviour.
Frequently asked questions
- What is the EU circular material use rate?
- 12.2% in 2024. That is the share of all materials used in the EU economy that came from recycling rather than from new extraction, growth or import.
- Which EU country is the most circular?
- The Netherlands, at 32.7% in 2024, followed by Belgium at 22.7% and Italy at 21.6%. Part of the Dutch figure reflects a small extractive sector rather than recycling performance alone.
- Which EU country is the least circular?
- Romania at 1.3%, with Ireland and Finland both at 2.0%. Ireland and Finland have large extractive and forestry sectors, which enlarge total material use and lower the ratio regardless of how much they recycle.
- Is the circular material use rate the same as a recycling rate?
- No. A recycling rate measures what share of waste is recycled. This measures what share of all material entering the economy came from recycling — a much larger denominator that includes fossil fuels and construction minerals, most of which cannot re-enter use in the same year.
Methodological note
The circular material use rate is published by Eurostat as the ratio of circular use of materials to overall material use, where circular use is measured as recovery of waste in domestic processing plants minus imported waste destined for recovery, plus exported waste destined for recovery abroad.
Values are for 2024, the most recent year available for all 27 Member States at the extraction date.
The counts of Member States above and below the EU rate, and the ratio between the highest and lowest, are derived by Silver Data Lab from the published rates.
Source data
The underlying series can be inspected and re-downloaded from the Eurostat data browser. The filters below are the ones applied.
Circular material use rate
cei_srm030
- Filters applied:
- freq=A · unit=PC · time=2024
- Extracted:
- 2026-08-11
- Source last updated:
- 2025-11-24
Download the data
The data the study you have just read is built on, exactly as it was downloaded and archived.
Yours as a Member.
Data downloadable by Members
How to cite
Record the vintage as well as the study: the figures on this page are the ones extracted on the dates below.
Silver Data Lab Research Desk (2025). Recycling Supplies Just 12.2% of the Materials the EU Uses. Silver Data Lab, published 27 November 2025, last updated 11 October 2026. https://www.silverdatalab.com/studies/circular-material-use-in-the-eu
- Data: Eurostat, Circular material use rate (cei_srm030), filters freq=A, unit=PC, time=2024; extracted 2026-08-11; source last updated 2025-11-24. https://doi.org/10.2908/cei_srm030
Silver Data Lab's analysis is licensed CC BY 4.0. The statistics remain their publisher's and keep its terms of reuse.
Ask the research desk
A question about this study — a definition, a filter, a break in the series, what the figures can and cannot support — answered by the desk that made the extraction.
Members can write to the research desk
Other studies on the same dataset
Studies where the same country leads or trails
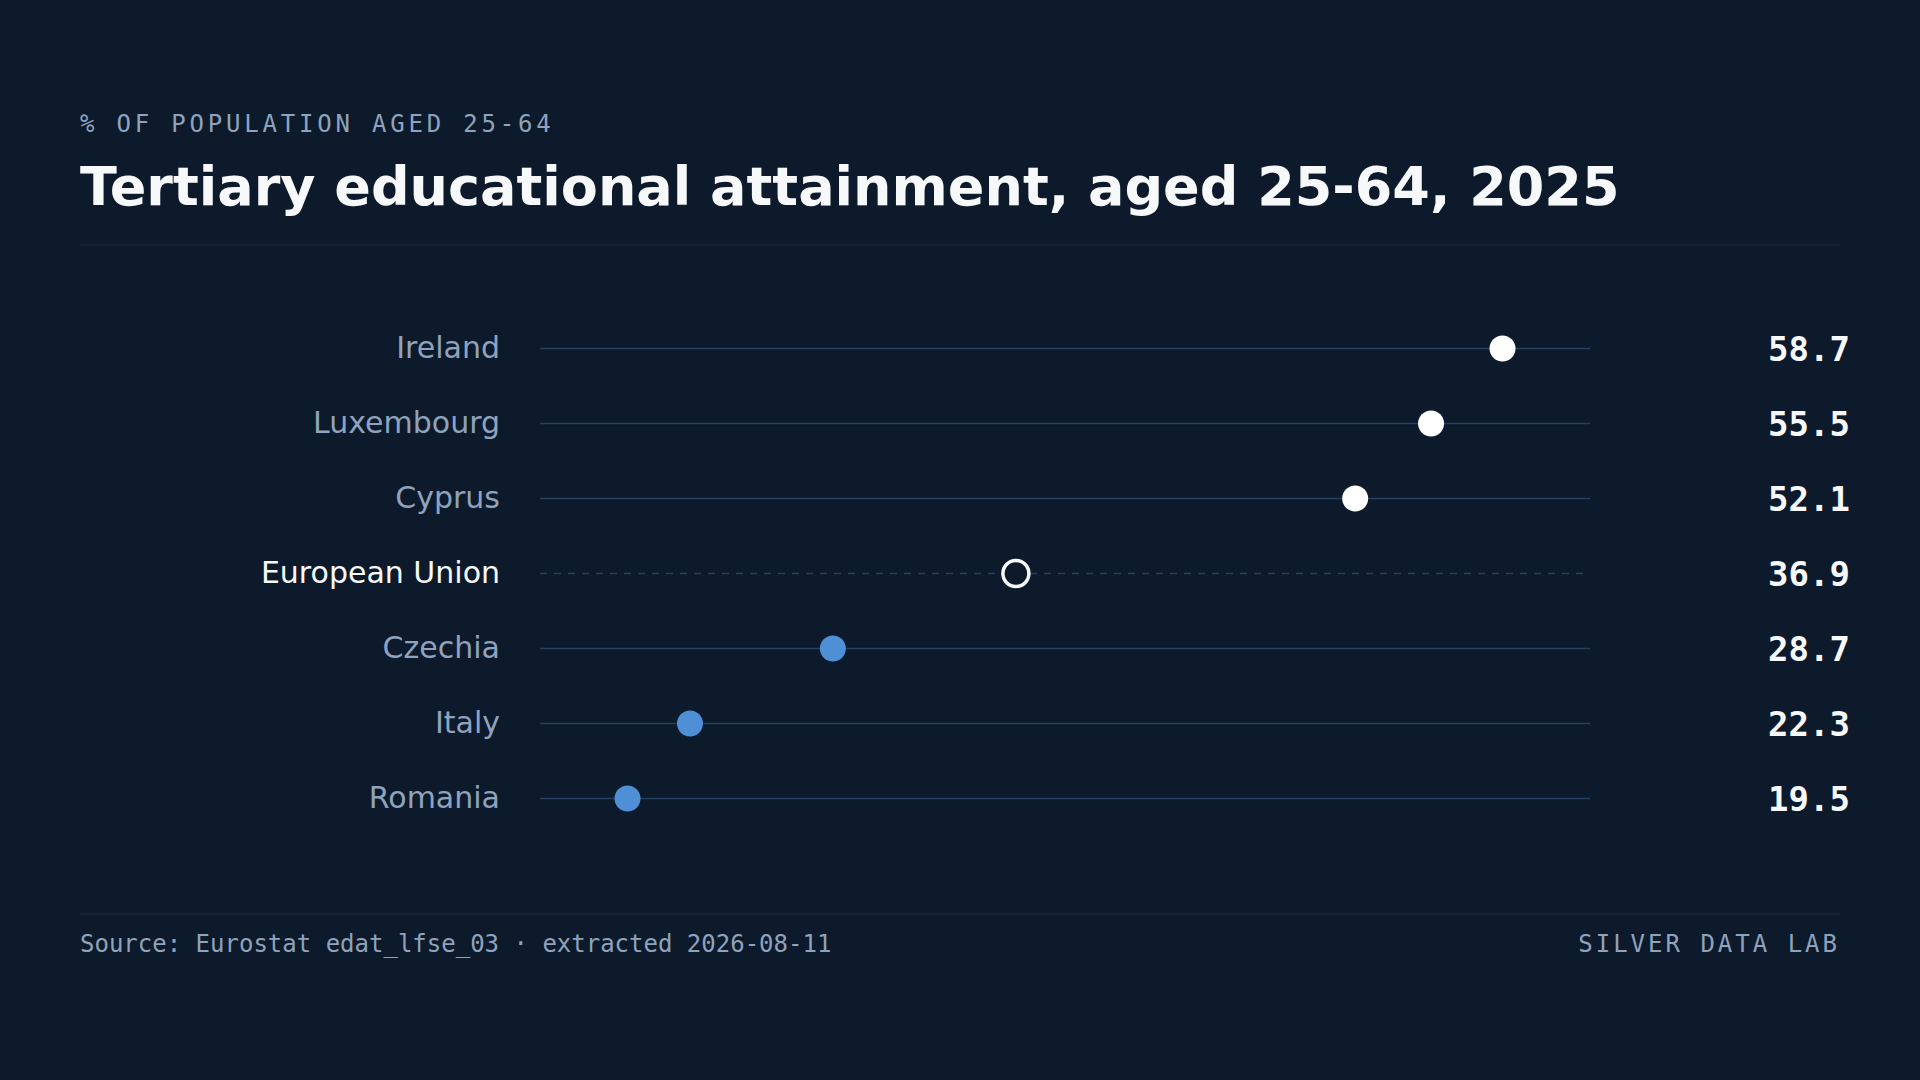
A Degree Is Three Times as Common Among Adults in Ireland as in Romania
36.9% of people aged 25 to 64 in the EU held a tertiary qualification in 2025.
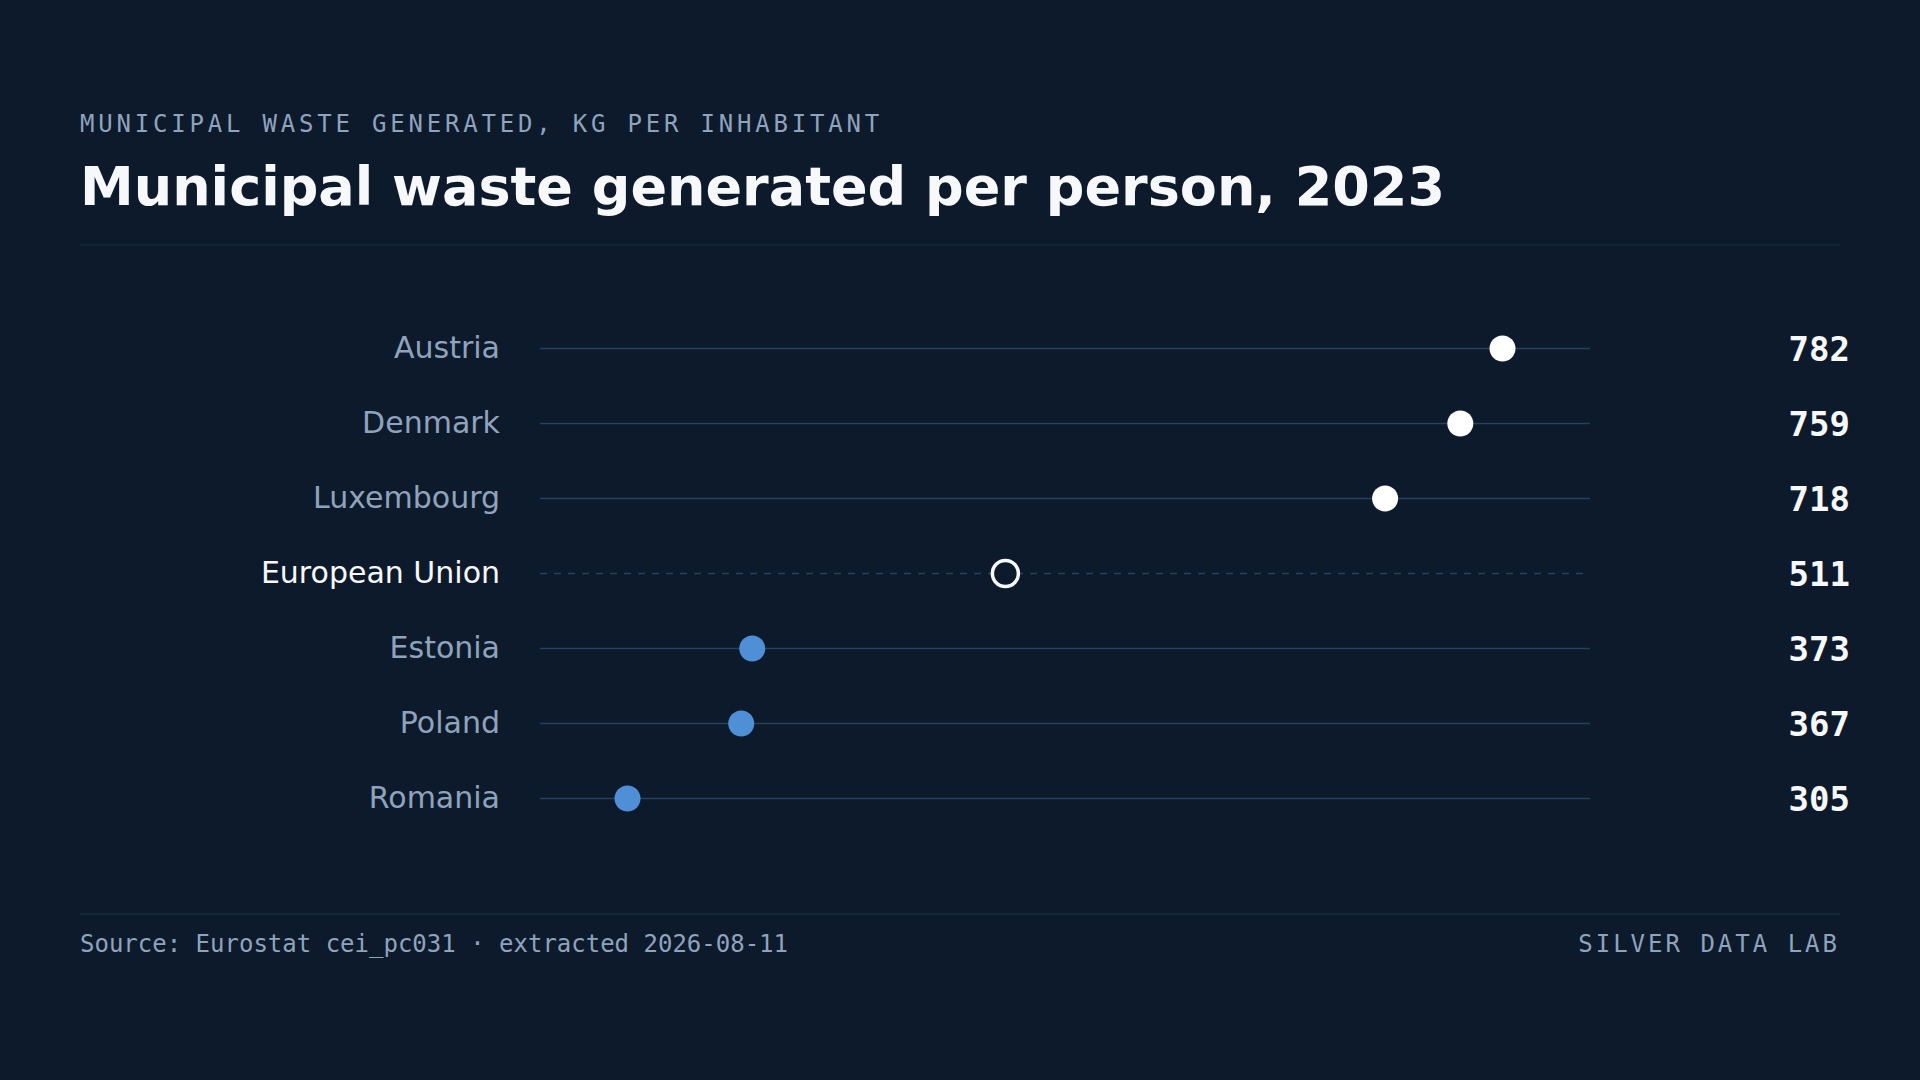
Austria Produces More Rubbish per Person Than Any Other EU Country
The EU generated 510 kg of municipal waste per inhabitant in 2023 — about 1.4 kg per person per day.
For Its Population, Croatia Has the Most Tourist Overnight Stays in the EU
The EU recorded 6,978 tourist nights per 1,000 inhabitants in 2025, about 7.0 nights per resident.