Brussels Is 2,200 Times More Crowded Than Northern Sweden
Silver Data Lab Research Desk · Statistical analysis · Published on 28 February 2026
- Data source
- Eurostat
- Reference period
- 2024
- Last updated
- 21 October 2026
Re-checked against the source on 16 September 2026. No value in its datasets has moved between the snapshots we hold. Every revision we have observed →
Key estimates
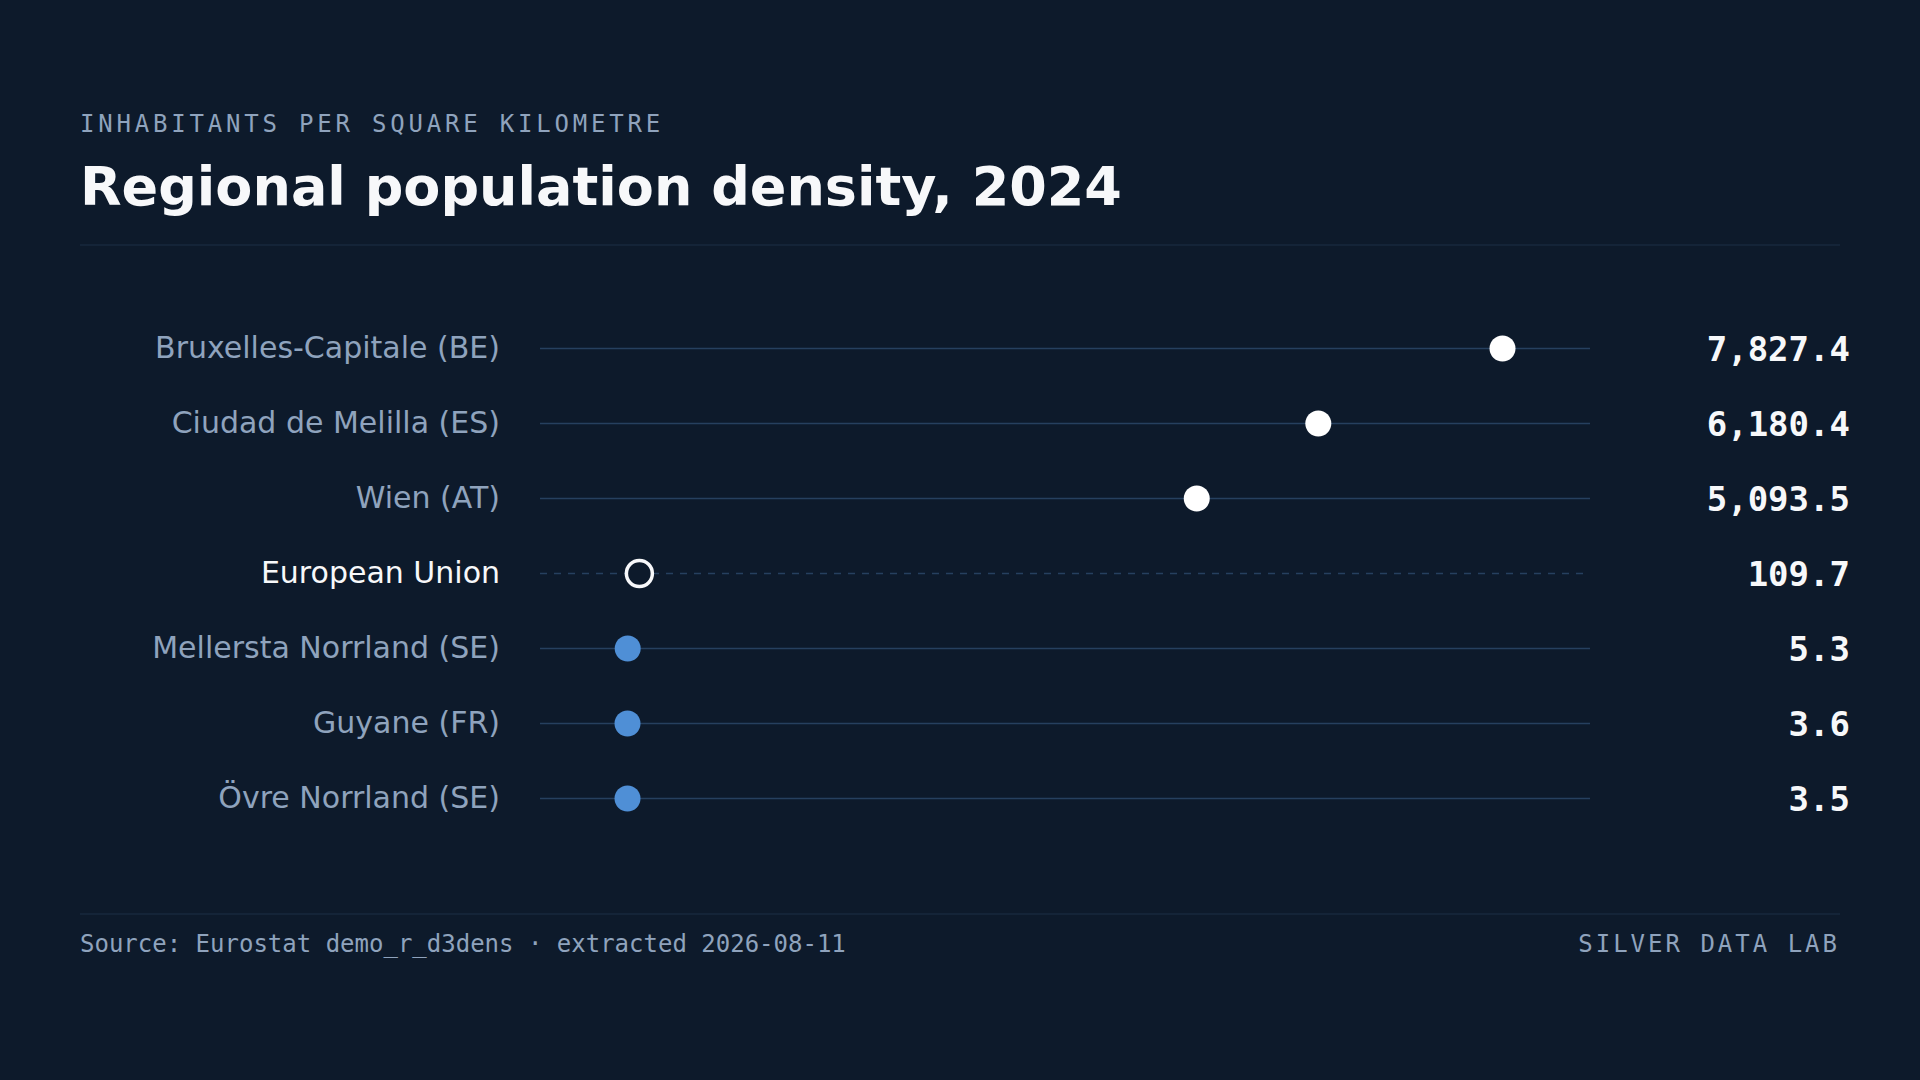
- The EU averages 109.7 inhabitants per square kilometre.
- Brussels records 7,827 people per square kilometre, the densest region in the Union.
- Övre Norrland in northern Sweden records 3.5 — a ratio of about 2,200 to one.
- Vienna at 5,094 and Berlin at 4,343 are the third and fourth densest regions in the Union.
- Two of the three emptiest EU regions are in northern Sweden; the third is French Guyane.
The widest spread in European statistics
Population density across EU regions runs from 7,827 inhabitants per square kilometre to 3.5. That is a ratio of roughly 2,200 to one, and by a wide margin the largest ratio this site has measured on any indicator.
The EU average is 109.7 per square kilometre.
Why this ranking is mostly about administrative boundaries
Brussels tops the list at 7,827, followed by Ciudad de Melilla at 6,180, Vienna at 5,094, Berlin at 4,343, Ciudad de Ceuta at 4,169, Budapest at 3,305 and Prague at 2,869.
Each of these is a city that constitutes a statistical region — a NUTS 2 region — on its own. Where a capital is its own region, its density is a city density. Where a capital sits inside a larger region — Madrid, Warsaw, Rome — that region includes surrounding countryside and the figure falls accordingly.
The ranking therefore reflects how each Member State drew its statistical regions at least as much as how its people are distributed. Comparing Brussels with a French or Polish region is comparing a city to a province.
That is a real limit on the indicator, and it is why the interesting comparison is at the other end.
The empty north
Övre Norrland in northern Sweden records 3.5 inhabitants per square kilometre, Guyane 3.6 and Mellersta Norrland 5.3. Pohjois- ja Itä-Suomi in Finland records 6.2.
These are large regions of forest, mountain and, in Guyane's case, rainforest. Övre Norrland alone covers more than a third of Sweden's area and holds one twentieth of its people; Guyane is an eighth of the territory of France and holds one person in every two hundred and thirty.
Unlike the top of the ranking, these figures are not artefacts of boundary drawing. Northern Sweden and Finland are genuinely among the least populated inhabited places in the world outside the Arctic and central Asia, and no plausible way of drawing regions would change that.
What density is supposed to explain, and what can be checked here
Density is usually invoked to explain other things: how much people drive, whether public transport can be run at reasonable cost, how far a hospital is, how crowded housing gets. It is worth separating what this study can support from what it cannot.
It cannot support any of it directly. Density here is measured by region; every indicator it is meant to explain is measured on this site by country. A national figure can neither confirm nor refute a claim about one region inside it.
And the national figures do not line up the way the expectation would suggest. On the share of inland passenger-kilometres travelled by car, Finland is third in the Union at 75.4%, which fits — but Sweden records 67.3%, below the EU figure of 69.2% and seventeenth of twenty-seven, and the Netherlands, the most densely populated large Member State, is second at 77.0%. Severe housing deprivation runs the same way round: of the twenty-six Member States with a 2023 figure, Malta records the lowest rate and the Netherlands the fourth lowest, and those two are the densest in the Union.
None of that refutes the regional intuition, which may well hold within a country. It means the intuition needs regional data to test, and a density ranking is not that test.
Reading the chart
The dots on the figure show rank order rather than proportion. A scale that placed 3.5 and 7,827 proportionally would compress every region except the top three into a single line at the left edge, which would communicate less than the numbers do.
Regional population density, 2024
| Country | inhabitants per km² | Gap to EU averagederived |
|---|---|---|
| Bruxelles-Capitale (BE) | 7,827.4 | +7,717.7 |
| Ciudad de Melilla (ES) | 6,180.4 | +6,070.7 |
| Wien (AT) | 5,093.5 | +4,983.8 |
| European Unionaggregate | 109.7ep | — |
| Mellersta Norrland (SE) | 5.3 | −104.4 |
| Guyane (FR) | 3.6 | −106.1 |
| Övre Norrland (SE) | 3.5 | −106.2 |
Flags carried by the source on these values: ep estimated, provisional
This table as data: CSV · JSON
Every Member State for this indicator+
Members see every Member State for this indicator here, not only the rows the ranking prints. Become a Member
Embed this chart
Paste this code into a page. The frame carries the source and the extraction date, and links back to the study.
What these figures cannot tell you
- The top of the ranking is an artefact of boundaries
- Where a city is its own NUTS 2 region, its density is a city density; where a capital sits inside a wider region, the figure includes countryside. This makes the upper half of the ranking a comparison of administrative practice as much as of settlement.
- An average conceals internal concentration
- A large region with one dense city and empty surroundings records a moderate average. Density at NUTS 2 level says little about how people within a region are actually distributed.
- Land area includes uninhabitable terrain
- Mountain, forest and ice are counted in the denominator. Inland water is not: Eurostat divides by land area rather than total area, which is why a lake-covered region is not made to look emptier than it is. Regions with large uninhabitable dry land still record low densities that overstate how empty their habitable land is.
- Six codes in the table are not missing regions
- The dataset lists six EU codes with no value for 2024 — one Croatian, two Dutch and three Portuguese — and every one of them is a superseded code carrying an older NUTS vintage in its own label, replaced by codes that do have values. Counting them as regions without data would overstate the gaps in the table. Two current regions are genuinely missing, however: Grad Zagreb and Sjeverna Hrvatska do not appear in this extraction at all, so it covers 242 of the Union's 244 NUTS 2 regions.
Frequently asked questions
- Which is the most densely populated EU region?
- Brussels, at 7,827 inhabitants per square kilometre in 2024, followed by Ciudad de Melilla at 6,180 and Vienna at 5,094. All are cities that form a statistical region on their own, so their figures are city densities rather than regional ones.
- Which is the emptiest EU region?
- Övre Norrland in northern Sweden, at 3.5 inhabitants per square kilometre, with Guyane at 3.6 and Mellersta Norrland at 5.3. Northern Sweden and Finland are among the least populated inhabited areas in the world outside the Arctic.
- What is the average population density in the EU?
- 109.7 inhabitants per square kilometre in 2024. Regional figures span more than three orders of magnitude around that average.
- Why do capital regions dominate the top of the ranking?
- Because of how statistical regions are drawn. Brussels, Vienna, Berlin and Hamburg are each a NUTS 2 region consisting of a city alone, while Madrid, Warsaw and Rome sit inside regions that include surrounding countryside and record lower densities as a result.
Methodological note
Eurostat publishes population density by NUTS 2 region as inhabitants per square kilometre, derived from regional population and land area.
Values are for 2024 and cover the 242 EU NUTS 2 regions in the extraction, all of which have a published density; the Union has 244, and the two Croatian regions missing here are named in the limitations. Regions of candidate and EFTA countries present in the dataset are excluded, as are six superseded codes that carry an older NUTS vintage in their label and no value. The EU average shown is the published EU27 figure.
The ratio between the densest and emptiest region is computed by Silver Data Lab, as is the statement that it is the widest ratio any ranking on this site publishes, which was checked against every ranking in the corpus.
The shares of national area and population quoted for Övre Norrland and Guyane are derived from two further extractions, declared below. They are deliberately given as shares rather than as the figures behind the density: the area series extracted here is total area, while the density Eurostat publishes is population over land area, so dividing this population by this area would not reproduce the density in the ranking.
The car figures are from the modal split series, also declared below and shared with the car dependency study on this site. The severe housing deprivation series is declared below as well, with its own filters and extraction date, and is shared with the companion study on that indicator; it is a 2023 reading against this ranking's 2024. Both are national series, and the text says so rather than reading them as regional evidence.
Source data
This study draws on 5 datasets from Eurostat. Each can be inspected and re-downloaded from its catalogue, and the filters below are the ones applied.
Population density by NUTS 3 region
demo_r_d3dens
- Filters applied:
- freq=A · unit=PER_KM2 · time=2024
- Extracted:
- 2026-08-11
- Source last updated:
- 2026-02-25
Area by NUTS 3 region
reg_area3
- Filters applied:
- freq=A · landuse=TOTAL · unit=KM2 · time=2024
- Extracted:
- 2026-09-16
- Source last updated:
- 2026-01-22
Population on 1 January by broad age group, sex and NUTS 3 region
demo_r_pjanaggr3
- Filters applied:
- freq=A · unit=NR · sex=T · age=TOTAL · time=2024
- Extracted:
- 2026-09-16
- Source last updated:
- 2026-08-28
Modal split of air, sea and inland passenger transport
tran_hv_ms_psmod
- Filters applied:
- freq=A · vehicle=CAR · unit=PC · time=2024
- Extracted:
- 2026-08-27
- Source last updated:
- 2026-08-26
Severe housing deprivation rate by age, sex and poverty status
ilc_mdho06a
- Filters applied:
- freq=A · age=TOTAL · sex=T · rskpovth=TOTAL · unit=PC · time=2023
- Extracted:
- 2026-08-11
- Source last updated:
- 2026-05-21
Download the data
The data the study you have just read is built on, exactly as it was downloaded and archived.
Yours as a Member.
Data downloadable by Members
How to cite
Record the vintage as well as the study: the figures on this page are the ones extracted on the dates below.
Silver Data Lab Research Desk (2026). Brussels Is 2,200 Times More Crowded Than Northern Sweden. Silver Data Lab, published 28 February 2026, last updated 21 October 2026. https://www.silverdatalab.com/studies/population-density-in-eu-regions
- Data: Eurostat, Population density by NUTS 3 region (demo_r_d3dens), filters freq=A, unit=PER_KM2, time=2024; extracted 2026-08-11; source last updated 2026-02-25. https://doi.org/10.2908/demo_r_d3dens
- Data: Eurostat, Area by NUTS 3 region (reg_area3), filters freq=A, landuse=TOTAL, unit=KM2, time=2024; extracted 2026-09-16; source last updated 2026-01-22. https://doi.org/10.2908/reg_area3
- Data: Eurostat, Population on 1 January by broad age group, sex and NUTS 3 region (demo_r_pjanaggr3), filters freq=A, unit=NR, sex=T, age=TOTAL, time=2024; extracted 2026-09-16; source last updated 2026-08-28. https://doi.org/10.2908/demo_r_pjanaggr3
- Data: Eurostat, Modal split of air, sea and inland passenger transport (tran_hv_ms_psmod), filters freq=A, vehicle=CAR, unit=PC, time=2024; extracted 2026-08-27; source last updated 2026-08-26. https://doi.org/10.2908/tran_hv_ms_psmod
- Data: Eurostat, Severe housing deprivation rate by age, sex and poverty status (ilc_mdho06a), filters freq=A, age=TOTAL, sex=T, rskpovth=TOTAL, unit=PC, time=2023; extracted 2026-08-11; source last updated 2026-05-21. https://doi.org/10.2908/ilc_mdho06a
Silver Data Lab's analysis is licensed CC BY 4.0. The statistics remain their publisher's and keep its terms of reuse.
Ask the research desk
A question about this study — a definition, a filter, a break in the series, what the figures can and cannot support — answered by the desk that made the extraction.
Members can write to the research desk
Other studies on the same dataset
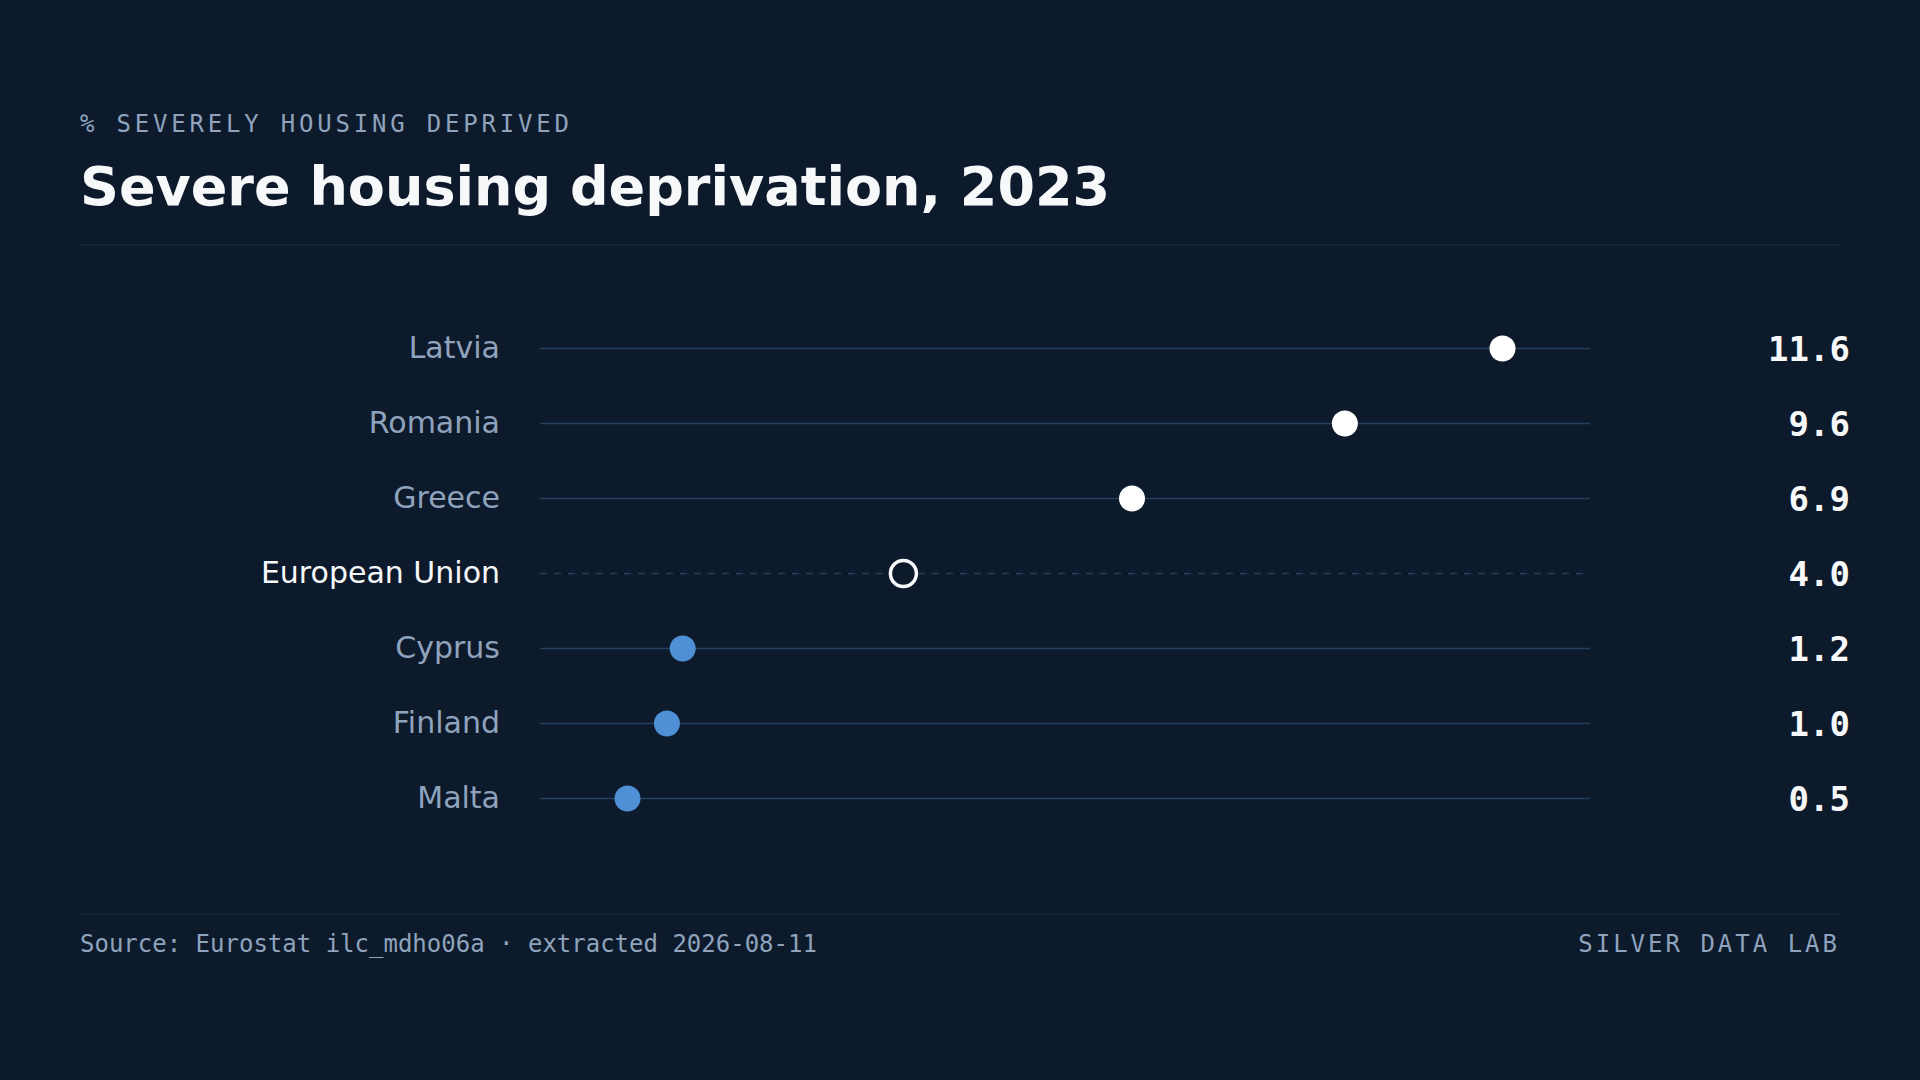
More Than One Latvian in Nine Lives in a Crowded, Run-Down Home
4.0% of the EU population lived in severely deprived housing in 2023.
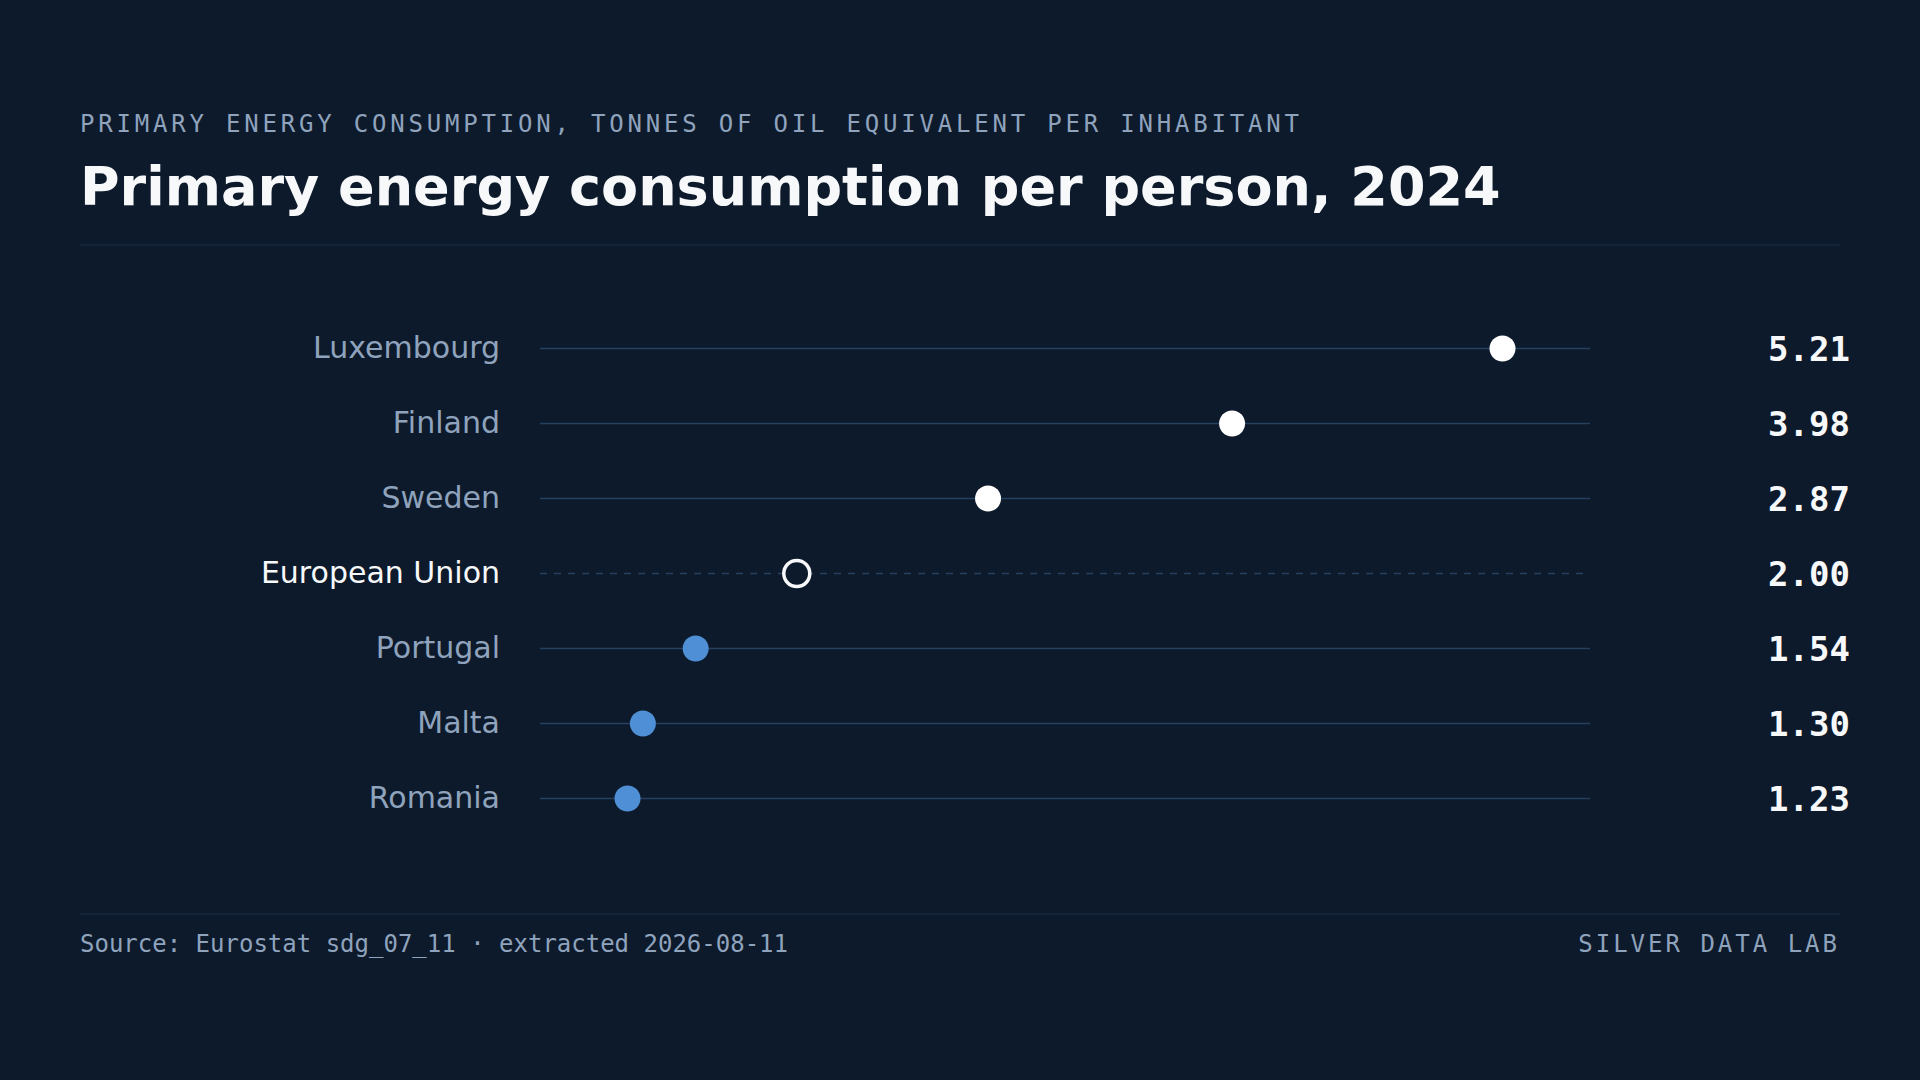
Romania Uses Less Energy per Person Than Any Other EU Country
The EU consumed 2.0 tonnes of oil equivalent per inhabitant in final energy in 2024.
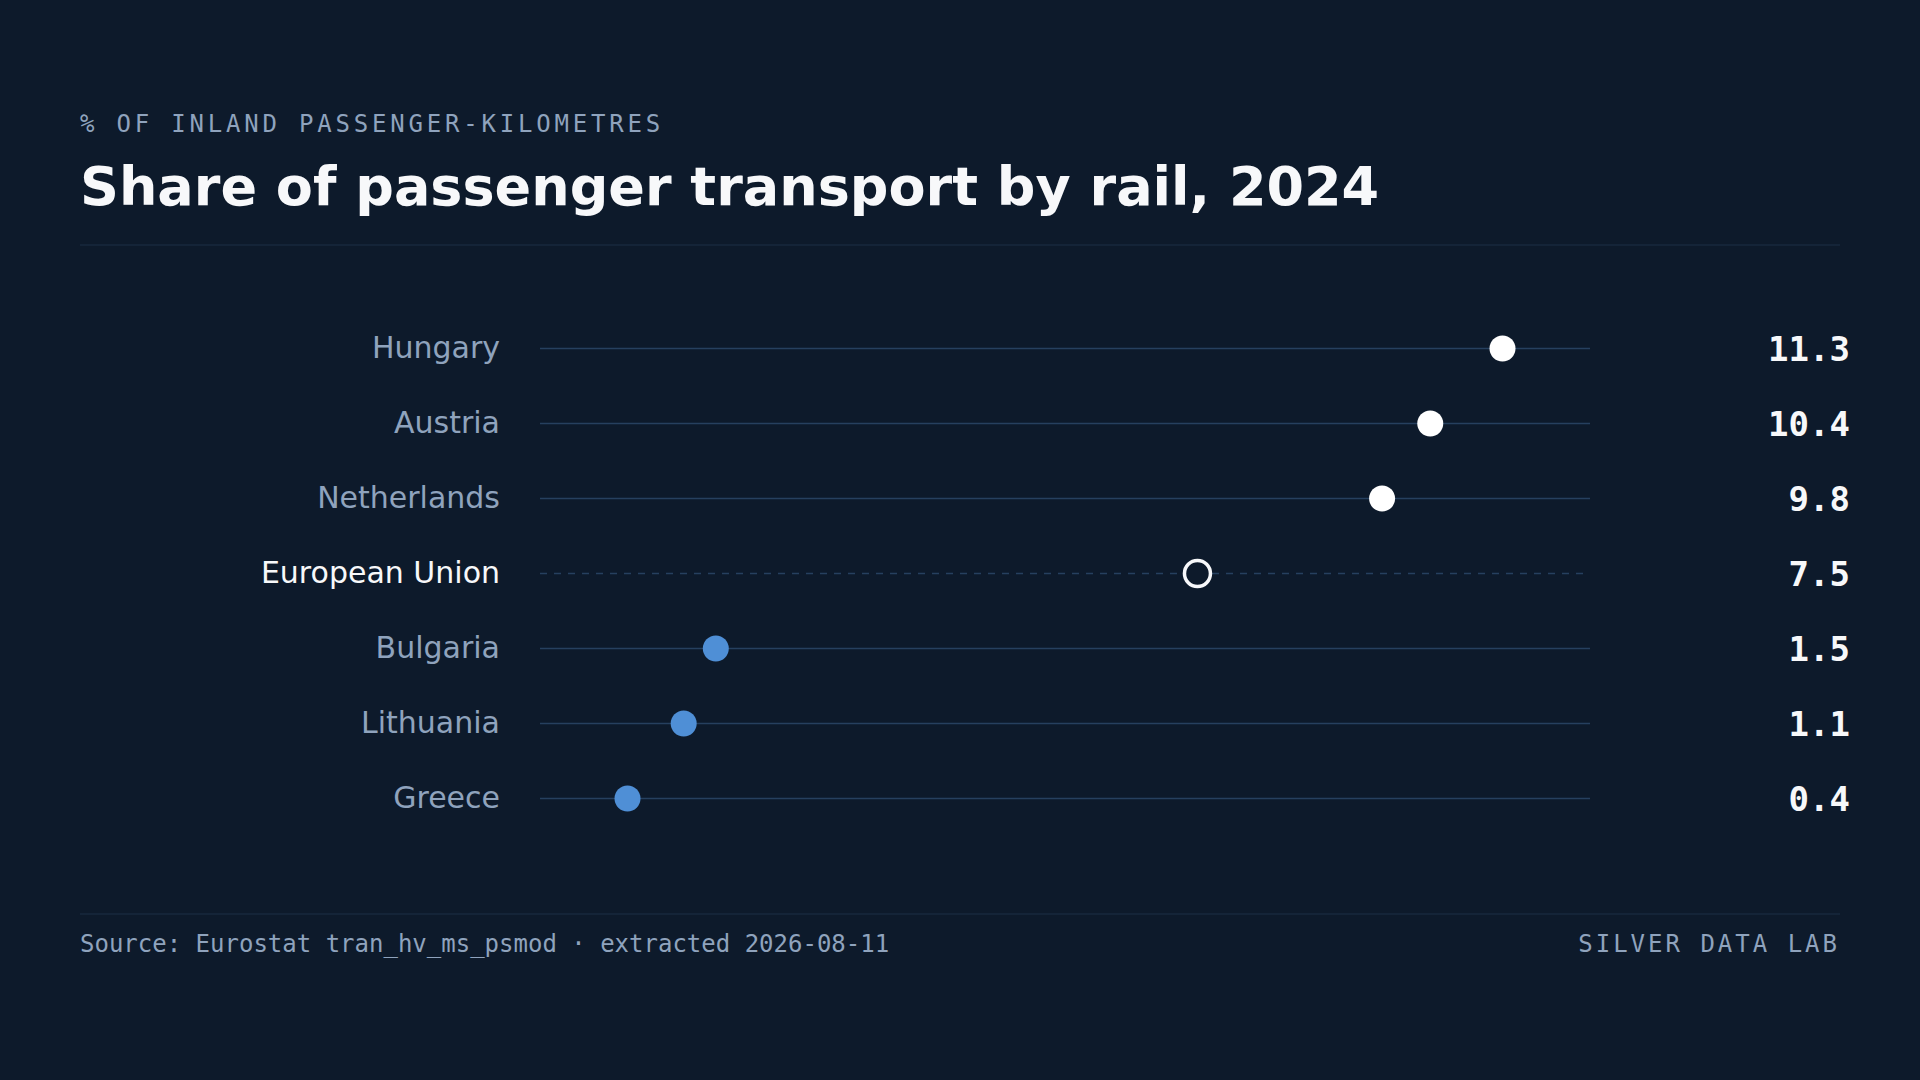
Two EU Countries Have No Railway at All
Trains carried 7.5% of EU passenger-kilometres in 2024, on a measure that counts flights and ferries alongside cars, buses and trains.