Jobs in High-Tech Industries Are Most Common in the Regions of EU Capitals
Silver Data Lab Research Desk · Statistical analysis · Published on 20 October 2026
- Data source
- Eurostat
- Reference period
- 2025
- Last updated
- 20 October 2026
Re-checked against the source on 20 October 2026. No value in its datasets has moved between the snapshots we hold. Every revision we have observed →
Key estimates
- In 2025 the twelve EU regions with the largest share of their workers in high-tech industries all contain their country's capital; Bratislavský kraj, the region of Bratislava, leads at 14.3%, about one job in seven.
- In 20 of the 22 Member States divided into more than one region, the capital region has the highest share; in Belgium Walloon Brabant, south of Brussels, leads at 9.8%, and in the Netherlands the province of Utrecht at 8.1%.
- The three Member States whose highest and lowest regions are furthest apart are the three whose capital regions top the ranking: Czechia, with a derived gap of 11.2 points, Slovakia, 10.5, and Hungary, 9.9.
- Among values published without a reliability warning, the lowest are Calabria at 1.3%, Nord-Est in Romania at 1.4% and Sud-Muntenia, also in Romania, at 1.5%; the five regions below Calabria all carry Eurostat's low-reliability flag.
- No region of today's 27 Member States reached 10% in 2014, against eleven in 2025, though that comparison spans the 2021 break in the survey behind the table.
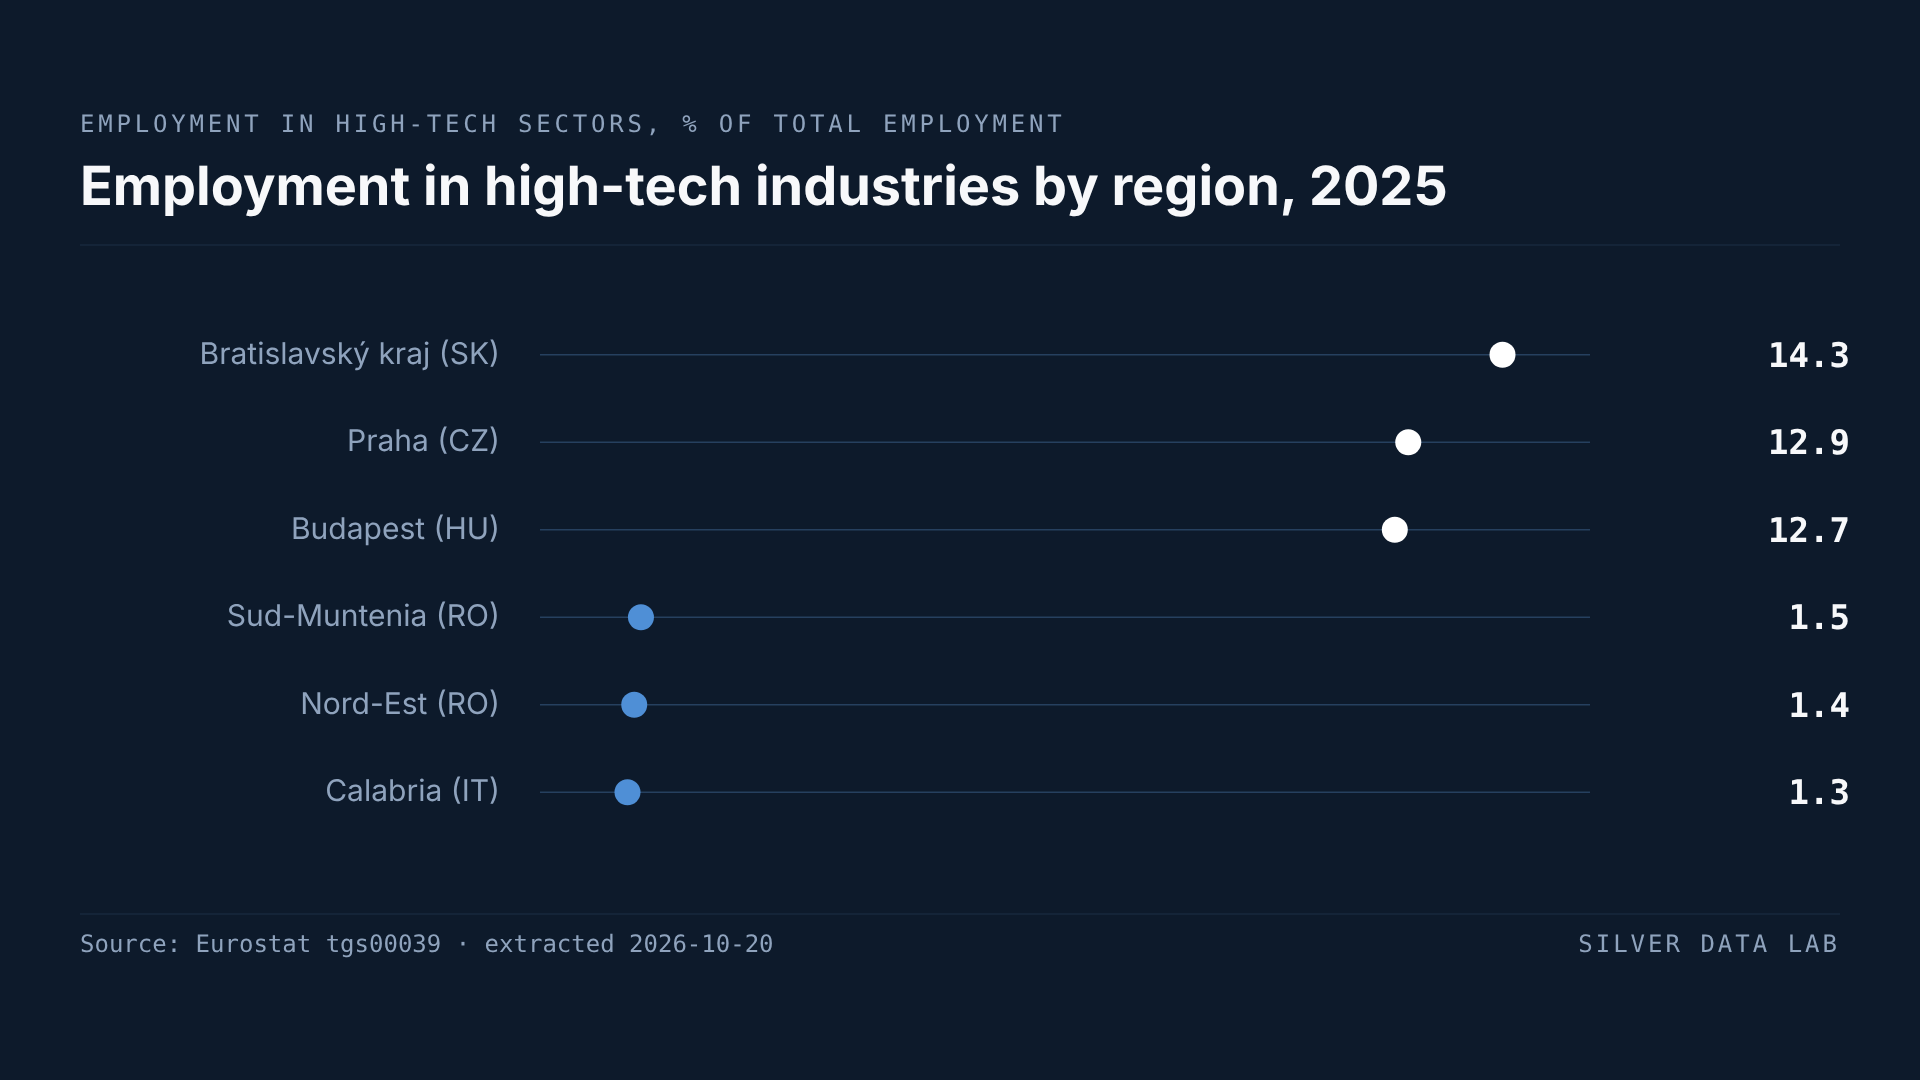
Where one job in seven is in high tech
In 2025, 14.3% of the people in work in Bratislavský kraj, the region formed by the Slovak capital and the districts around it, were employed in high-tech industries: about one job in seven, the largest share of any region in the European Union. Praha, the region that is the city of Prague, followed at 12.9%, then Budapest at 12.7% and Grad Zagreb, the City of Zagreb, at 12.2%.
Eight more regions come before the first one without a national capital in it. Eastern and Midland, the Irish region that includes Dublin, records 11.6%; Warszawski stołeczny, Warsaw and the counties around it, 11.5%; Sostinės regionas, the region of Vilnius, 11.3%; Hovedstaden, the Copenhagen region, 11.2%; Stockholm 10.8%; Yugozapaden, the south-west of Bulgaria including Sofia, 10.2%; Berlin 10.0%; and Helsinki-Uusimaa, the region of Helsinki, 9.9%. The twelve highest shares in the Union therefore all belong to regions that contain their country's capital, and the first eleven are the only regions where at least one job in ten is in these industries. None of the twelve values carries a flag.
What the table counts as high-tech
Eurostat draws the line by industry, not by occupation. Two kinds of manufacturing count: pharmaceuticals, and computers, electronic and optical products. So do six kinds of service: film, television and music production; radio and television broadcasting; telecommunications; computer programming and IT consultancy; information services such as data processing, hosting and web portals; and scientific research and development. In NACE, the EU's classification of economic activities, these are divisions 21 and 26 of manufacturing and divisions 59 to 63 and 72 of services.
Everyone employed in those industries is counted, whatever their job: a sales manager at a drug maker is in the figure, while a software engineer working for a car maker or a bank is not. The share is taken of all employed people aged 15 to 74 who live in the region, as measured by the EU Labour Force Survey, the household survey every Member State runs on common rules.
These industries are a narrow slice of a wider group Eurostat calls knowledge-intensive activities. Every one of them belongs to that group, which also takes in finance, law and accounting, education, health and public administration.
The capital comes first in twenty countries
The table is drawn on NUTS 2, the middle tier of the classification Eurostat uses to divide the Union into territories of broadly comparable population, 244 regions in all. Estonia, Cyprus, Latvia, Luxembourg and Malta are a single region each; the other 22 Member States are divided into several. In 20 of those 22, the region containing the capital has the highest share in the country.
The size of the lead varies a great deal. Bratislavský kraj's 14.3% is three times that of the next Slovak region, Východné Slovensko in the east of the country, at 4.7%: a lead of 9.6 points by derived difference, the widest of any capital region. Berlin's is the narrowest, 0.9 points over Karlsruhe, the administrative region in the north-west of Baden-Württemberg, at 9.1%. Of the twenty capital regions that lead their country, Attiki, the region of Athens, has the lowest share, 5.7%.
Belgium and the Netherlands are the two exceptions, and in both the leader lies next to the capital. In Belgium it is Walloon Brabant, the province south of Brussels, at 9.8%, ahead of the Brussels-Capital Region at 8.2%; Flemish Brabant, the province that encircles the capital region, comes third at 7.4%. In the Netherlands the province of Utrecht, at 8.1%, is ahead of Noord-Holland, the province of Amsterdam, at 6.8%.
In both exceptions the way the survey counts people may play a part. It records each worker in the region where they live, not the one where they work, so a resident of Walloon Brabant employed by a software firm in Brussels counts in Walloon Brabant. How much of the province's lead that explains, the table cannot say.
The widest gaps are in the countries at the top
The three Member States in which the highest and the lowest region lie furthest apart are the three whose capital regions head the EU ranking. In Czechia the derived gap is 11.2 percentage points: 12.9% in Prague against 1.7% in Severozápad, the north-western corner of the country, a share less than a seventh of the capital's. In Slovakia it is 10.5 points, between Bratislavský kraj and Západné Slovensko, the west of the country beyond the capital region, at 3.8%. In Hungary it is 9.9 points, between Budapest and Dél-Alföld, the southern part of the Great Hungarian Plain, at 2.8%.
Croatia follows at 9.4 points, between the City of Zagreb and Jadranska Hrvatska, the Adriatic coast, at 2.8%. In Slovakia and in Croatia no region other than the capital's reaches 5%. Poland comes next at 8.8 points and Denmark at 8.6, where Syddanmark, the south of the country, records 2.6% against 11.2% in the Copenhagen region.
Every one of these gaps is measured between values Eurostat publishes without a reliability warning, and Poland's would be wider on the flagged ones. Its lowest unflagged region is Lubelskie, in the east, at 2.7%; three Polish regions publish lower values carrying the low-reliability flag and four publish none. Counting the flagged 1.8% of Mazowiecki regionalny, the part of Mazowieckie province outside the Warsaw capital region, the Polish gap would be 9.7 points, ahead of Croatia's.
At the other end, the two Slovenian regions are the closest pair: Zahodna Slovenija, the western half that includes Ljubljana, records 7.9% and Vzhodna Slovenija, the east, 4.9%, 3.0 points apart.
Outside the capitals
Walloon Brabant is thirteenth in the Union, the first region on the list without a capital. Karlsruhe and Southern, the Irish region that takes in Cork and Limerick, both record 9.1%, and Oberbayern, Upper Bavaria around Munich, 8.9%. Of the 25 highest shares, 20 are in capital regions; the other five are those four and Utrecht. Among the regions just below them are two more that ring a capital: Pest, the county that surrounds Budapest, at 7.6%, and Flemish Brabant at 7.4%.
The bottom of the ranking
Among the values published without a reliability warning, the lowest is Calabria's, at the southern tip of Italy, at 1.3%. Bratislavský kraj's share is eleven times larger, by derived ratio. Nord-Est, in north-eastern Romania, records 1.4% and Sud-Muntenia, the region that surrounds Bucharest, 1.5%. Five regions sit lower still, and every one of those values is flagged by Eurostat as of low reliability: Sud-Est in Romania at 0.8%, Thessalia and Peloponnisos in Greece at 1.1%, and Ipeiros in Greece and Poitou-Charentes in western France at 1.2%, the French value also flagged as differing in definition.
Half of the 225 regions with a value are at 4.2% or less, under a third of the Bratislava region's share. Romania shows the distance inside a single country: four of its eight regions are below 2%, three of them without a reliability warning, while Bucureşti-Ilfov, the capital and its surrounding county, records 9.4%.
A rise almost everywhere, across a break
In 2014 no region of today's 27 Member States had one job in ten in these industries; the highest was Eastern and Midland, at 9.8%. In 2025 eleven did. Of the 209 regions with a value under the same code in both years, 196 recorded a higher share in 2025, ten a lower one and three the same.
That comparison crosses 1 January 2021, when the EU Labour Force Survey moved to a new legal framework and Eurostat marked a break in every Member State's series, as well as earlier and later breaks in individual countries. The rise is not the break alone: the share went up in 137 of 210 regions between 2014 and 2019, before it, and in 147 of 220 between 2021 and 2025, after it. How large the rise was, the series cannot say with precision.
The top was already made of capitals. In 2014 nine of the ten highest shares were in capital regions, and the other was Walloon Brabant. What moved is the order. Bratislavský kraj was sixth in 2014, at 8.7%, and Sostinės regionas, at 4.4% that year, recorded the largest rise of any region over the period, to 11.3%. Since 2021, under the current survey framework, the largest rise is the City of Zagreb's, from 8.0% to 12.2%.
Employment in high-tech industries by region, 2025
| Country | % of total employment |
|---|---|
| Bratislavský kraj (SK) | 14.3 |
| Praha (CZ) | 12.9 |
| Budapest (HU) | 12.7 |
| Sud-Muntenia (RO) | 1.5 |
| Nord-Est (RO) | 1.4 |
| Calabria (IT) | 1.3 |
This table as data: CSV · JSON
Every Member State for this indicator+
Members see every Member State for this indicator here, not only the rows the ranking prints. Become a Member
Embed this chart
Paste this code into a page. The frame carries the source and the extraction date, and links back to the study.
Gap between a country's highest and lowest region, 2025
| Country | percentage points (derived) |
|---|---|
| Czechia | 11.2 |
| Slovakia | 10.5 |
| Hungary | 9.9 |
| Croatia | 9.4 |
| Poland | 8.8 |
| Denmark | 8.6 |
This table as data: CSV · JSON
Every Member State for this indicator+
Members see every Member State for this indicator here, not only the rows the ranking prints. Become a Member
Embed this chart
Paste this code into a page. The frame carries the source and the extraction date, and links back to the study.
What these figures cannot tell you
- Workers are counted where they live
- The Labour Force Survey places each worker in the region of usual residence, which can differ from the region of the workplace. Where many people commute into a capital, a high-tech worker who lives outside it counts in the surrounding region: that may be part of why Walloon Brabant's share exceeds the Brussels-Capital Region's, and the table cannot separate it from where the jobs actually are. Capital regions are also drawn differently: Praha, Budapest, Berlin, Wien and the Brussels-Capital Region are the city alone, while Bratislavský kraj and Eastern and Midland take in the areas around the city.
- A survey break in 2021, and national ones
- On 1 January 2021 the EU Labour Force Survey moved to a new framework, and Eurostat flags a break in 2021 for every Member State. It also flags breaks in individual countries: Luxembourg in 2015, Denmark and Poland in 2016, Belgium, Denmark and Ireland in 2017, Hungary, Italy and Sweden in 2018, Bulgaria and Poland in 2019, Germany in 2020, Denmark in 2023, and Bulgaria and France in 2024. Every comparison between 2014 and 2025 on this page spans the 2021 break, and the shorter ones before and after it span national breaks in some countries, so changes should be read for their direction rather than their size.
- Low-reliability values, and regions with none
- The survey is a sample, so Eurostat withholds a value that rests on too few respondents and flags one that rests on few as of low reliability. 27 of the 225 values published for 2025 carry that flag, seven of them in Germany and five each in Greece and France. 19 of the 244 regions have no value for 2025, each marked by Eurostat as below the reliability limit. Åland, Valle d'Aosta, Ceuta, Melilla, the Azores, Madeira, the Greek island regions of Voreio Aigaio, Notio Aigaio and Ionia Nisia, and the French overseas departments of Guyane and Mayotte have none in any year of the extraction; Mayotte is covered by a separate annual survey. Trier, Dytiki Makedonia, Champagne-Ardenne, Martinique, Lubuskie, Opolskie, Warmińsko-mazurskie and Świętokrzyskie have none for 2025. Corsica's 4.7% is flagged as of low reliability as well as differing in definition, its sample being too small for a dependable regional figure.
- Spanish and French values follow a different rule
- Every Spanish and French value from 2021 onwards is flagged as differing in definition. The survey's own metadata gives the reason: both countries still test whether employees on temporary lay-off keep their job the way they did before the 2021 framework, so some people the current Regulation would not count as employed are counted there. Comparisons between regions of the same country are unaffected; comparisons of Spanish or French regions with regions elsewhere should allow for it.
- The industry decides, not the job
- The definition is sectoral. Every job in a pharmaceutical, electronics, telecommunications, software, broadcasting or research firm counts, including sales, administration and maintenance, while technical work done inside other industries does not: an engineer in a car plant or a programmer employed by a bank is outside the figure. A high share describes which industries employ a region's residents, not how skilled their jobs are.
- No EU or national figure in this table
- The table publishes no EU aggregate and no national values, and none is computed here: an average of regional shares would weigh every region equally whatever its size and leave out the 19 regions without a value. Eurostat publishes national shares in a separate table, htec_emp_nat2, which this study does not use.
- Region codes that no longer exist
- The table keeps codes from earlier editions of the regional classification. IE01, IE02, LT00, HU10, SI01 and SI02 are empty throughout; HR04, NL31, NL33, PT16, PT17 and PT18 carry values for the first years only, under their old boundaries, and their successors start later, so the City of Zagreb's series begins in 2016 and Utrecht's in 2019. Every comparison with 2014 is therefore made over the 209 regions that have a value under the same code in both years.
Frequently asked questions
- Which EU region has the highest share of jobs in high-tech industries?
- Bratislavský kraj, the region of the Slovak capital: 14.3% of its employed residents worked in high-tech industries in 2025, about one in seven. Prague follows at 12.9% and Budapest at 12.7%. These are shares of each region's employment, not counts of jobs.
- What does Eurostat count as a high-tech industry?
- Two branches of manufacturing, pharmaceuticals and computer, electronic and optical products, and six services: film, television and music production, broadcasting, telecommunications, computer programming and IT consultancy, information services, and scientific research and development. Everyone working in those industries is counted, whatever their job.
- Is the capital region always the highest in its country?
- In 20 of the 22 Member States that have more than one region, yes. The exceptions are Belgium, where Walloon Brabant, south of Brussels, records 9.8% against 8.2% in the Brussels-Capital Region, and the Netherlands, where the province of Utrecht records 8.1% against 6.8% in Noord-Holland, the province of Amsterdam.
- In which country do regions differ most?
- Czechia, by derived difference: Prague's 12.9% and the 1.7% of Severozápad, in the north-west of the country, are 11.2 percentage points apart. Slovakia follows at 10.5 points and Hungary at 9.9, and their capital regions are, with Prague's, the three highest in the Union.
- Why is there no EU average in the ranking?
- Because this regional table does not publish one, and an average worked out from 225 regional shares would treat a small region like a large one and leave out the regions without a value. Eurostat's national high-tech employment figures sit in a different table that this study does not use.
- Has the share of high-tech jobs grown?
- In most regions. No region of today's 27 Member States reached 10% in 2014 and eleven did in 2025, and of the 209 regions with a value under the same code in both years, 196 recorded a higher share. The comparison crosses the 2021 break in the EU Labour Force Survey, but the share also rose in most regions before the break and after it, so the direction holds even where the size of the change cannot be read exactly.
Methodological note
The study measures employment in high-technology sectors as a percentage of total employment, for each NUTS 2 region of the 27 Member States, both sexes together, from 2014 to 2025, as published in Eurostat's regional table of the indicator. High-technology sectors are high-technology manufacturing, NACE Rev. 2 divisions 21 and 26, and high-tech knowledge-intensive services, divisions 59 to 63 and 72, as listed in annex 3 of Eurostat's reference metadata for high-tech statistics. The figures come from the EU Labour Force Survey, cover employed people aged 15 to 74 and place them by region of residence.
The 2025 values cover 225 of the 244 regions of the current classification, in all 27 Member States. The table also carries regions of the United Kingdom, Norway, Switzerland, Iceland, Serbia, Montenegro, North Macedonia and Türkiye, which are excluded, and twelve codes from earlier editions of the classification, which are excluded as well. Every year, 2014 included, is read over the same 27 Member States: the United Kingdom's regions, published up to 2019, are left out although the country was then a member. Shares are quoted as Eurostat publishes them, to one decimal, with the low-reliability and definition-differs flags stated wherever a flagged value is named. A capital region is the NUTS 2 region containing the national capital, Amsterdam for the Netherlands; in the five Member States that form a single region, that region is the whole country.
Silver Data Lab derived the following from the published shares: the rank of each region among the 225 and within its own country; the number of regions at or above 10% in 2014 and in 2025; the number of capital regions among the 12 and the 25 highest shares of 2025 and the ten highest of 2014; each leading capital region's margin over the next region in its country; the gap between each country's highest and lowest regional share, taken over values without the low-reliability flag, which the second ranking shows, and Poland's gap including its flagged value; the ratio of Bratislavský kraj's share to Calabria's, to Východné Slovensko's and to the median, and of Prague's to Severozápad's; the share at or below which half of the 225 regions lie; the number of flagged and missing values, by country, and of Romanian regions below 2%; the number of regions whose share was higher, lower or unchanged between 2014 and 2025, between 2014 and 2019 and between 2021 and 2025, each over the regions with a value under the same code in both years; and the changes for Sostinės regionas from 2014 and for the City of Zagreb from 2021. Nothing else is computed.
Source data
The underlying series can be inspected and re-downloaded from the Eurostat data browser. The filters below are the ones applied.
Employed persons in high-tech sectors by NUTS 2 region
tgs00039
- Filters applied:
- freq=A · nace_r2=HTC · unit=PC_EMP · sex=T
- Extracted:
- 2026-10-20
- Source last updated:
- 2026-09-10
Download the data
The data the study you have just read is built on, exactly as it was downloaded and archived.
Yours as a Member.
Data downloadable by Members
How to cite
Record the vintage as well as the study: the figures on this page are the ones extracted on the dates below.
Silver Data Lab Research Desk (2026). Jobs in High-Tech Industries Are Most Common in the Regions of EU Capitals. Silver Data Lab, published 20 October 2026, last updated 20 October 2026. https://www.silverdatalab.com/studies/high-tech-jobs-by-region-in-the-eu
- Data: Eurostat, Employed persons in high-tech sectors by NUTS 2 region (tgs00039), filters freq=A, nace_r2=HTC, unit=PC_EMP, sex=T; extracted 2026-10-20; source last updated 2026-09-10. https://doi.org/10.2908/tgs00039
Silver Data Lab's analysis is licensed CC BY 4.0. The statistics remain their publisher's and keep its terms of reuse.
Ask the research desk
A question about this study — a definition, a filter, a break in the series, what the figures can and cannot support — answered by the desk that made the extraction.
Members can write to the research desk