The Poorest 40% of Europeans Receive 21.9% of Income
Silver Data Lab Research Desk · Statistical analysis · Published on 30 July 2026
This study is open to members only
Its sources, filters and extraction date are declared above, as they are for every study. Sign in to read the analysis in full.
- Data source
- Eurostat
- Reference period
- 2025
- Last updated
- 04 October 2026
Re-checked against the source on 24 October 2026. No value in its datasets has moved between the snapshots we hold. Every revision we have observed →
Key estimates
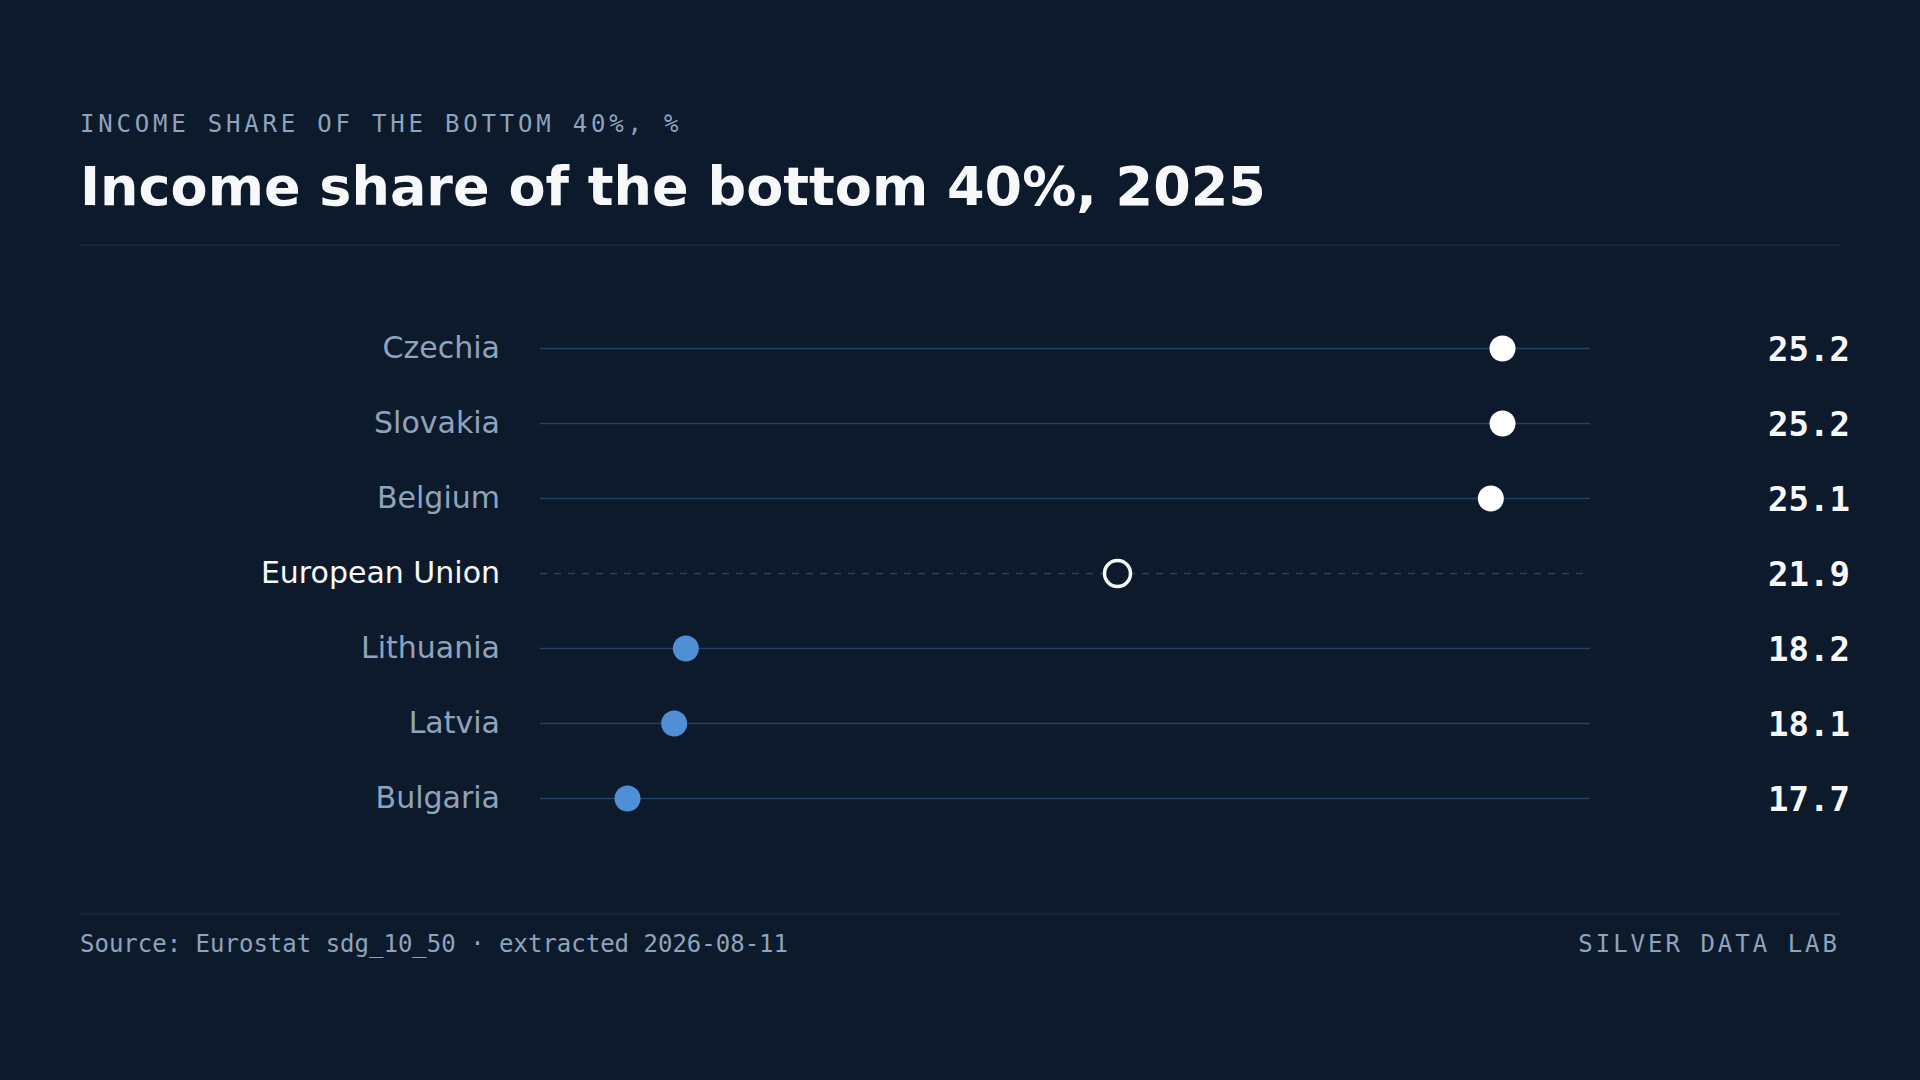
- The poorest 40% of the EU population received 21.9% of total income in 2025.
- Czechia and Slovakia record 25.2% and Belgium 25.1%, the most equal distributions in the Union.
- Bulgaria records 17.7%, Latvia 18.1% and Lithuania 18.2%.
- Under perfect equality the figure would be 40%; no Member State reaches 26%.
- The whole EU range is 7.5 percentage points, narrower than most indicators on this site.
A distribution measure with an obvious benchmark
Most inequality measures require explanation before a number means anything. This one does not. If income were shared equally, the poorest 40% of people would receive 40% of income. Whatever they actually receive, measured against 40, is the distance from equality.
Across the EU in 2025 they received 21.9%.
Slightly more than half of an equal share, for four Europeans in ten.
The most equal Member States
Czechia and Slovakia both record 25.2%, and Belgium 25.1%. Poland and Slovenia follow.
Czechia and Slovakia at the top is the result that separates this ranking from a ranking of national income. Neither is among the Union's wealthier Member States. Both distribute what they have more evenly than any of the countries that have more.
Belgium in third is the wealthy Member State that keeps company with them, and it is consistently near the top of European equality measures on any definition.
The least equal
Bulgaria records 17.7%, Latvia 18.1% and Lithuania 18.2%.
The same three Member States hold the top positions on the income quintile share ratio in the equality category of this site, which uses a different construction — the ratio of the top fifth to the bottom fifth — and reaches the same conclusion. When two measures with different arithmetic agree on the ordering, the ordering is a property of the distributions and not of the method.
Bulgaria is also the Member State with the lowest life satisfaction in the Union and the lowest volunteering rate. It is one of the few countries where the subjective and the distributional indicators point the same way.
The narrowness of the range
The full spread across the Union is 7.5 percentage points, from 17.7% to 25.2%.
By the standards of this site that is a narrow range. Energy import dependency spans 94 points, tourism intensity a factor of almost sixteen, childcare a factor of fifty-five. Income distribution varies far less between European countries than almost anything else measured about them.
That is worth stating because it cuts both ways. It means no Member State is an outlier in either direction, and it means no Member State is close to equality. The best-performing country in the Union gives its poorest 40% about five eighths of an equal share.
What the measure leaves out
This is disposable income after taxes and transfers, so it already includes the redistribution each Member State performs. It says nothing about wealth, which is distributed far more unequally than income everywhere it has been measured, and nothing about the market income distribution that tax and benefit systems act on.
Two countries with identical figures here can have very different market inequality and very different redistribution, and the indicator cannot distinguish a country that starts equal from one that is made equal.
Income share of the bottom 40%, 2025
| Country | % of total income | Gap to EU averagepercentage points, derived |
|---|---|---|
| Czechia | 25.2 | +3.3 |
| Slovakia | 25.2b | +3.3 |
| Belgium | 25.1 | +3.2 |
| European Unionaggregate | 21.9 | — |
| Lithuania | 18.2p | −3.7 |
| Latvia | 18.1 | −3.8 |
| Bulgaria | 17.7 | −4.2 |
Flags carried by the source on these values: b break in time series · p provisional
This table as data: CSV · JSON
Every Member State for this indicator+
Members see every Member State for this indicator here, not only the rows the ranking prints. Become a Member
What these figures cannot tell you
- Income, not wealth
- The measure covers annual disposable income. Wealth is distributed far more unequally than income in every country where both have been measured, and none of that appears here.
- After taxes and transfers
- The figure reflects income once redistribution has occurred. A country with high market inequality and strong redistribution can record the same value as one with low market inequality and little, and this measure cannot tell them apart.
- A national distribution
- Each figure describes the distribution within a Member State. It says nothing about differences in income level between Member States, where the gaps are much larger.
- Survey data
- Figures come from EU-SILC, a sample survey, and the highest incomes are under-represented in household surveys generally. Differences of a few tenths of a point between Member States are not meaningful.
Frequently asked questions
- What share of EU income goes to the poorest 40%?
- 21.9% in 2025. Under an equal distribution the figure would be 40%, so the poorest four Europeans in ten receive slightly more than half of an equal share.
- Which EU country distributes income most evenly?
- Czechia and Slovakia, both at 25.2%, with Belgium at 25.1%. Neither Czechia nor Slovakia is among the Union's wealthier Member States, which separates this ranking from a ranking of national income.
- Which EU country is the least equal on this measure?
- Bulgaria, at 17.7%, followed by Latvia at 18.1% and Lithuania at 18.2%. The same three Member States are the least equal on the income quintile share ratio, a measure built differently.
- Does this include wealth?
- No. It covers annual disposable income after taxes and transfers. Wealth is distributed considerably more unequally than income in every country where both have been measured.
Methodological note
Eurostat publishes the income share of the bottom 40% of the population from EU-SILC, based on equivalised disposable income after taxes and social transfers.
Values are for 2025 and cover all 27 Member States.
The comparison against the 40% equality benchmark is arithmetic and follows from the definition. The observation that this ranking agrees with the income quintile share ratio is made by Silver Data Lab across two studies on this site, each with its own extraction.
Source data
The underlying series can be inspected and re-downloaded from the Eurostat data browser. The filters below are the ones applied.
Income share of the bottom 40% of the population
sdg_10_50
- Filters applied:
- freq=A · statinfo=SHARE · time=2025
- Extracted:
- 2026-10-24
- Source last updated:
- 2026-10-23
Download the data
The data the study you have just read is built on, exactly as it was downloaded and archived.
Yours as a Member.
Data downloadable by Members
How to cite
Record the vintage as well as the study: the figures on this page are the ones extracted on the dates below.
Silver Data Lab Research Desk (2026). The Poorest 40% of Europeans Receive 21.9% of Income. Silver Data Lab, published 30 July 2026, last updated 04 October 2026. https://www.silverdatalab.com/studies/income-share-of-the-poorest-in-the-eu
- Data: Eurostat, Income share of the bottom 40% of the population (sdg_10_50), filters freq=A, statinfo=SHARE, time=2025; extracted 2026-10-24; source last updated 2026-10-23. https://doi.org/10.2908/sdg_10_50
Silver Data Lab's analysis is licensed CC BY 4.0. The statistics remain their publisher's and keep its terms of reuse.
Ask the research desk
A question about this study — a definition, a filter, a break in the series, what the figures can and cannot support — answered by the desk that made the extraction.
Members can write to the research desk
Studies where the same country leads or trails
Bulgaria's GDP per Person Is About a Third of the EU Average
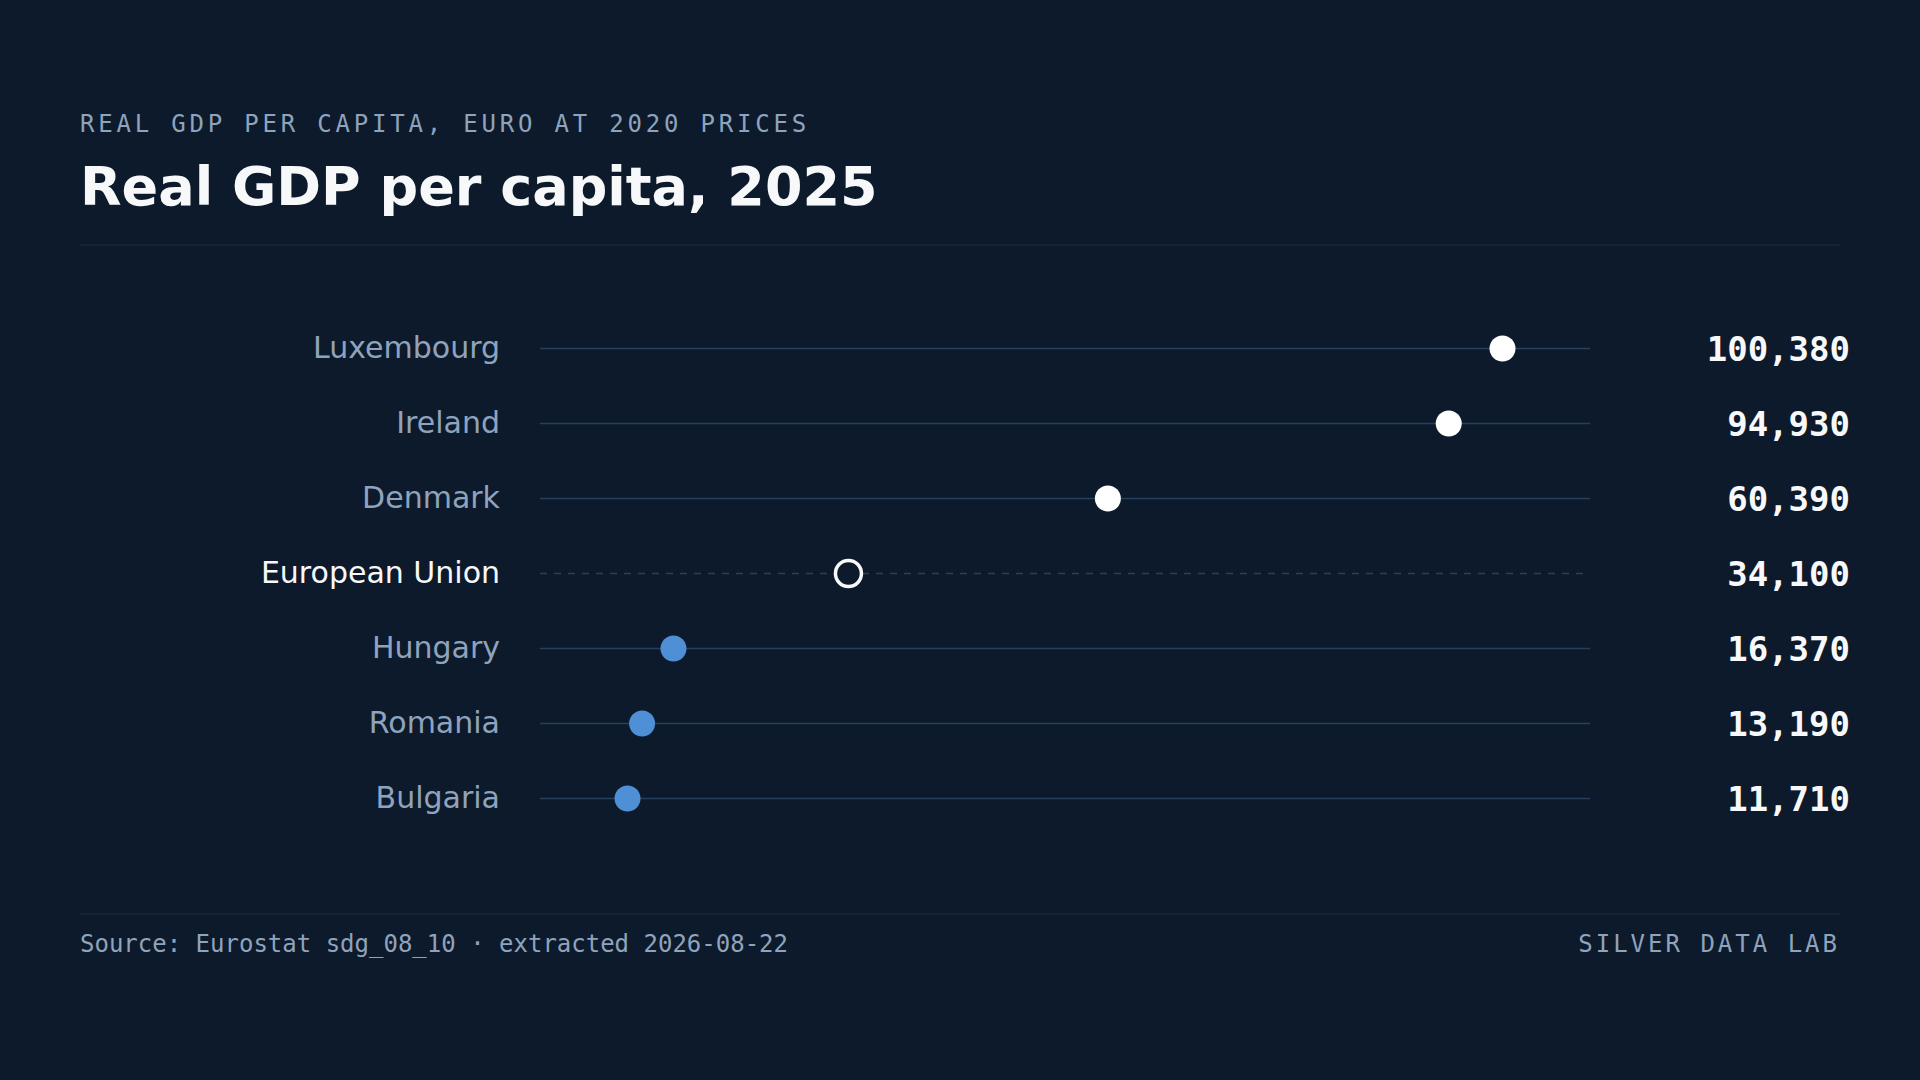
EU real GDP per capita was 34,250 euro in 2025, at 2020 prices.
GDP per Head Makes Luxembourg and Ireland Look Richer Than They Are
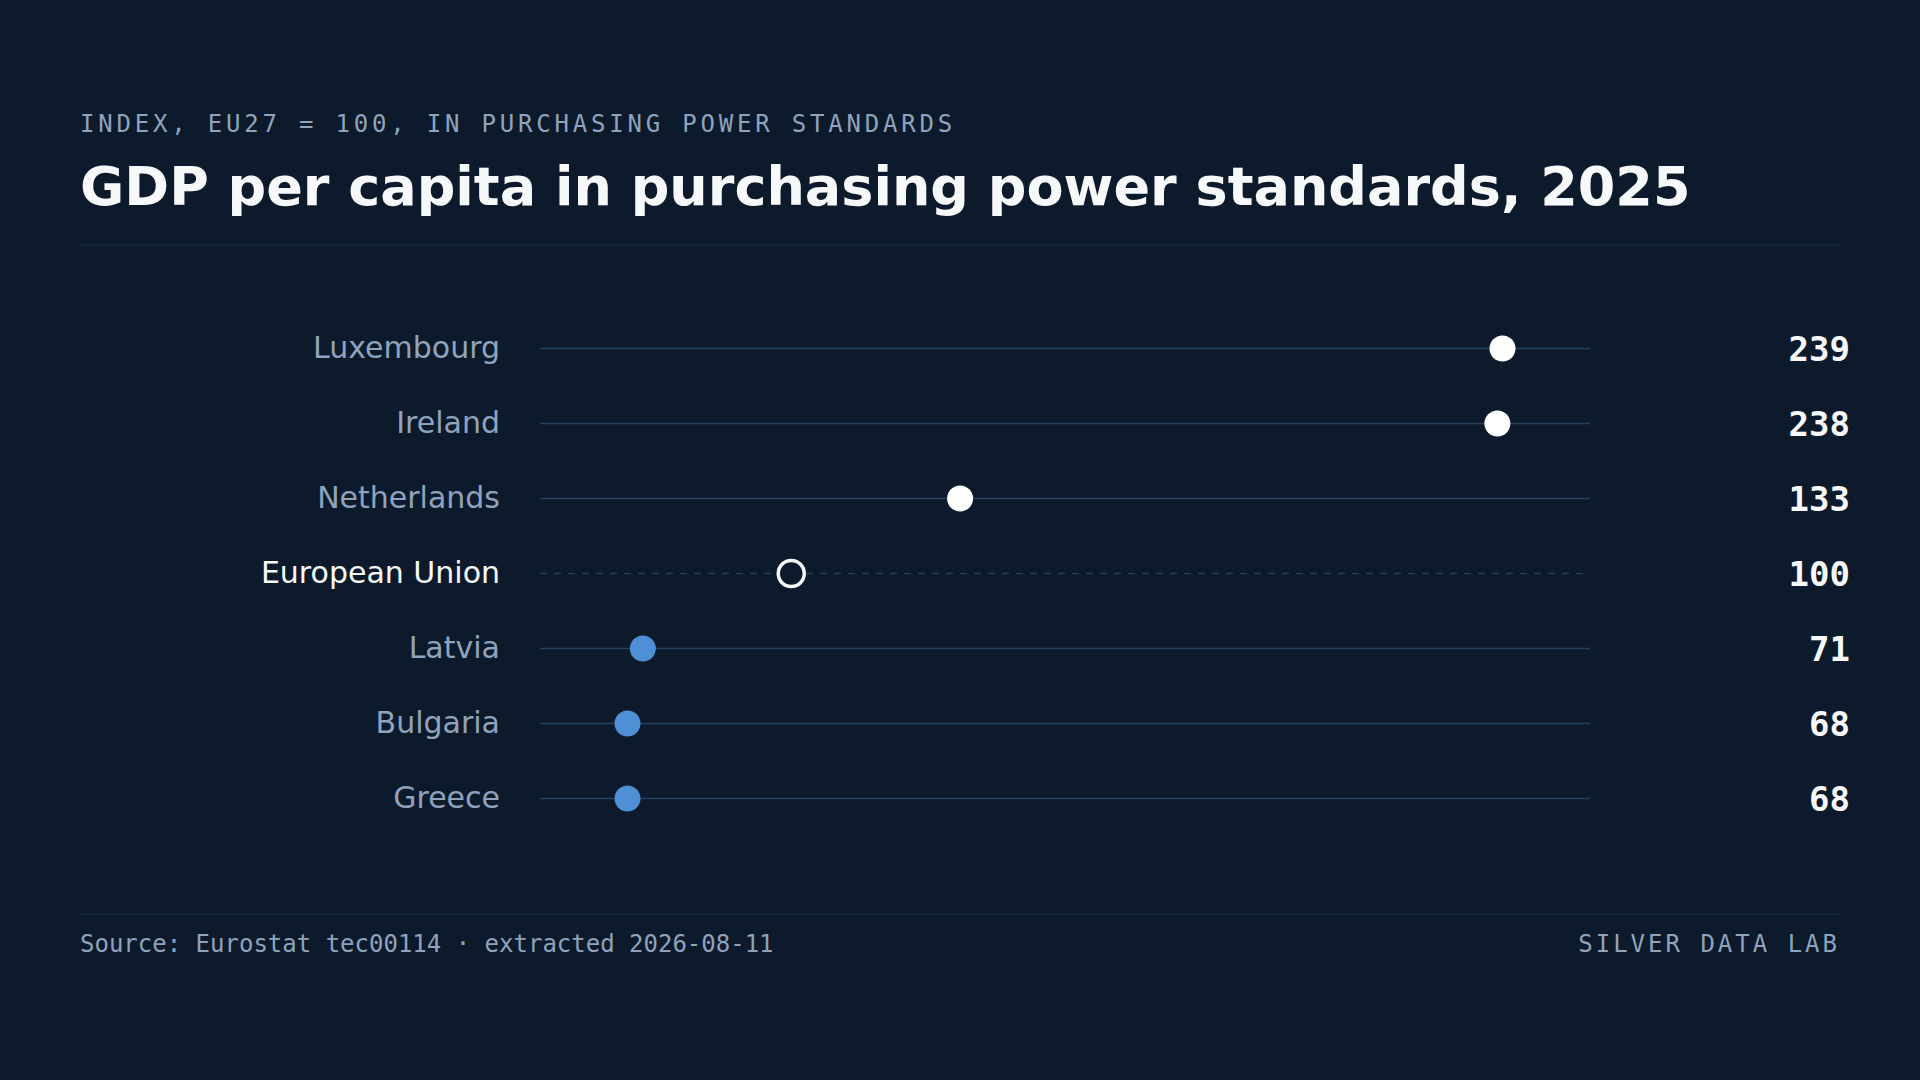
Luxembourg records 239 and Ireland 238 against an EU average of 100 — more than double the Union's output per head.
Germany's Legal Minimum Wage Buys More Than Any Other in the EU
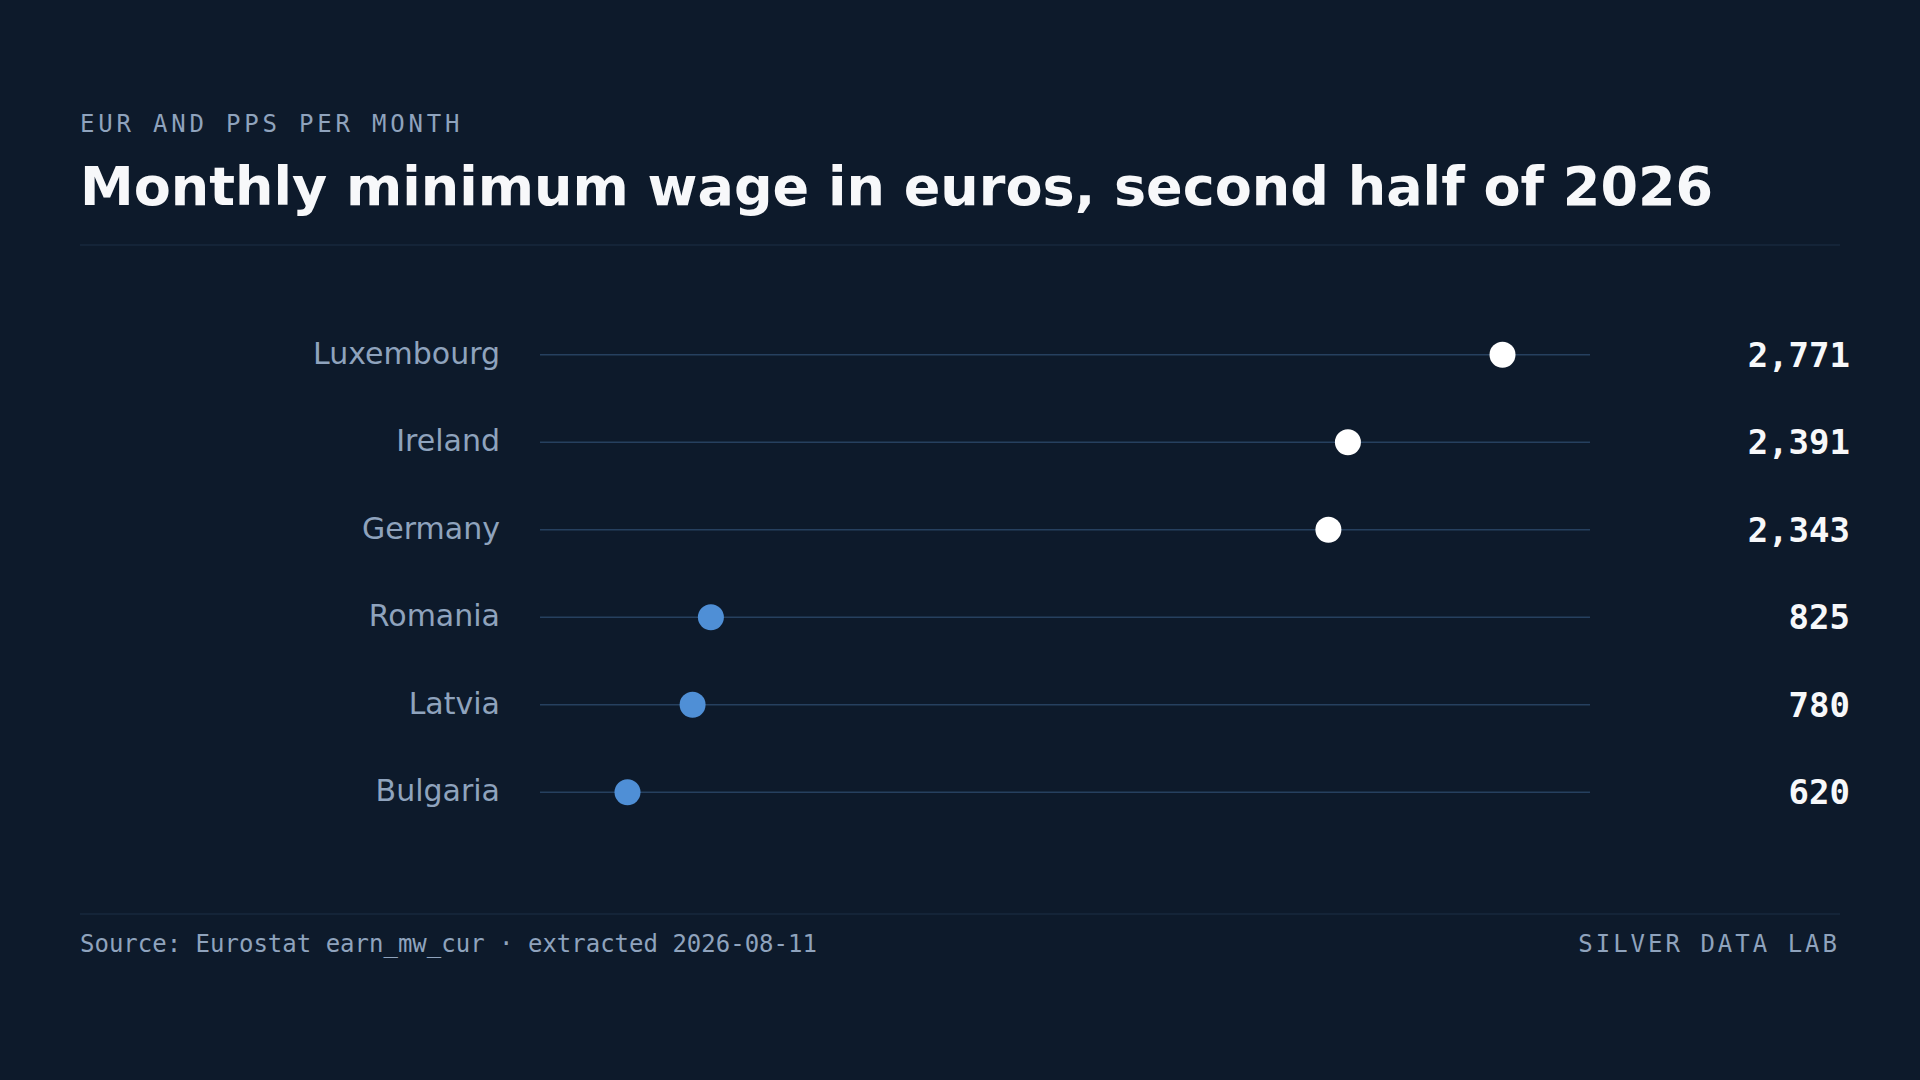
22 of the 27 Member States set a statutory minimum wage. Austria, Denmark, Finland, Italy and Sweden do not, leaving pay floors to collective agreements.