Germany's Legal Minimum Wage Buys More Than Any Other in the EU
Silver Data Lab Research Desk · Statistical analysis · Published on 03 August 2026
- Data source
- Eurostat
- Reference period
- Second half of 2026
- Last updated
- 11 October 2026
Re-checked against the source on 11 August 2026. No value in its datasets has moved between the snapshots we hold. Every revision we have observed →
Key estimates
- 22 of the 27 Member States set a statutory minimum wage. Austria, Denmark, Finland, Italy and Sweden do not, leaving pay floors to collective agreements.
- In euros the range runs from €2,771 a month in Luxembourg to €620 in Bulgaria — a ratio of 4.47 to 1.
- Adjusted for what the money buys, the same range runs from 2,164 to 935 purchasing power standards: a ratio of 2.31 to 1.
- Germany, third in euros, is first once prices are taken into account, ahead of Luxembourg.
- Romania gains eight places on the adjustment, from twentieth to twelfth, the largest move in either direction.
Two rankings of the same wage
A minimum wage is a legal amount, and comparing those amounts across borders is straightforward arithmetic. Comparing what they are worth is not. A wage floor is only meaningful against the prices it has to cover, and prices across the Union differ enough to reorder any ranking built on nominal values.
Eurostat publishes both. The same monthly minimum wages appear in euros and in purchasing power standards, an artificial currency in which one unit buys the same basket of goods in every Member State. The two rankings disagree in ways that change the conclusion.
The nominal picture
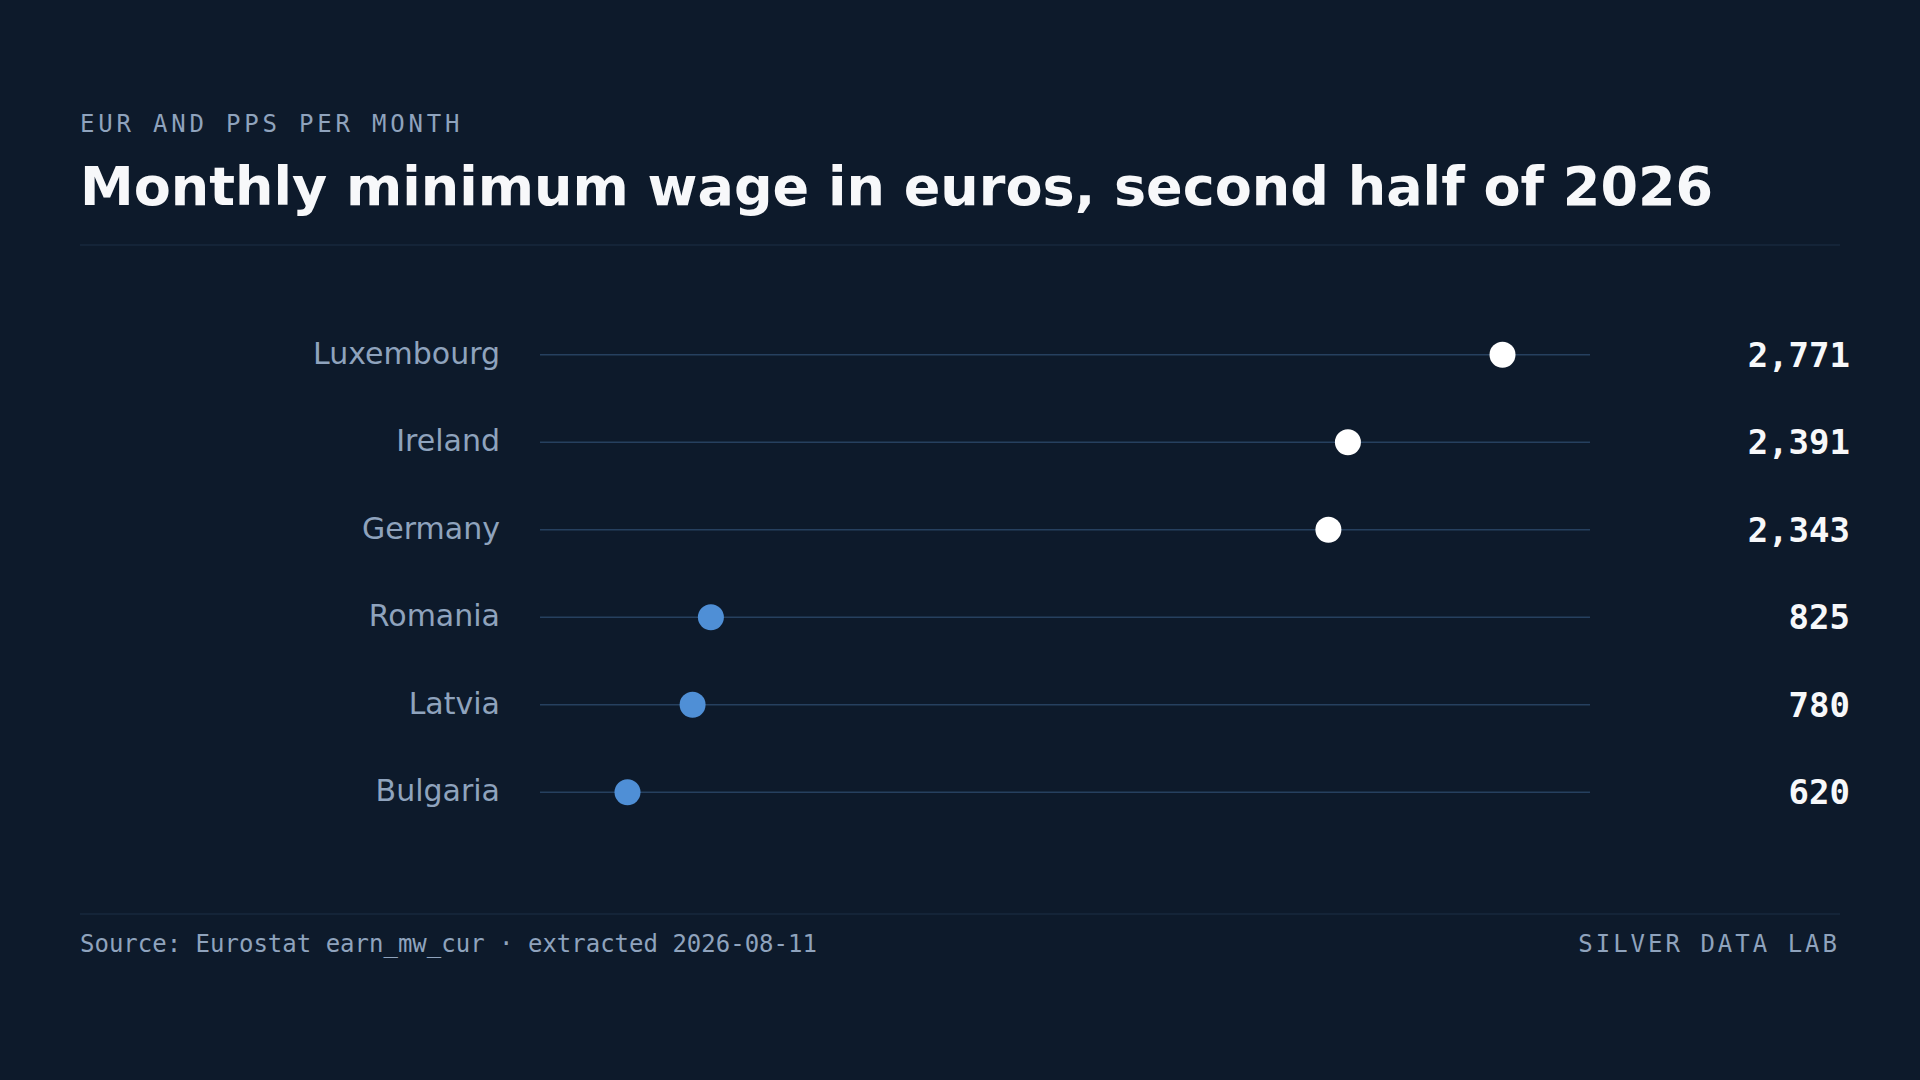
For the second half of 2026, the highest statutory minimum wage in the Union is Luxembourg's, at €2,771 a month, followed by Ireland at €2,391 and Germany at €2,343. The lowest are Bulgaria at €620, Latvia at €780 and Romania at €825.
Stated this way, the highest minimum wage in the EU is 4.47 times the lowest. It is the figure that makes the headline, and it overstates the difference in living standards it is usually taken to describe.
The picture after prices
Converted to purchasing power standards, the ranking changes at the top. Germany moves first at 2,164 units, ahead of Luxembourg at 2,108 and the Netherlands at 2,023. Luxembourg's nominal lead does not survive the price level it is earned in.
At the bottom, Estonia at 935 units replaces Bulgaria as the lowest, with Latvia at 938 and Bulgaria itself at 993 — the only one of the three nominal laggards to rise materially once its lower prices are counted.
The ratio between the highest and lowest falls from 4.47 to 2.31. Roughly half of Europe's apparent minimum wage inequality is a price effect rather than a difference in what workers can buy.
Who moves, and why it is not random
Romania makes the largest single move, from twentieth in euros to twelfth in purchasing power, a gain of eight places. Estonia makes the largest move in the other direction, from sixteenth to twenty-second, losing six. Cyprus loses four and Ireland three; Croatia gains three.
The pattern is a price-level pattern. Countries whose nominal wages are low but whose domestic prices are lower still climb; countries whose nominal wages look mid-table but sit in expensive economies fall. Estonia is the clearest case of the second kind, and it is a reminder that a euro figure imported into a national debate without adjustment can invert the comparison it was meant to support.
The five countries that are not on this chart
Austria, Denmark, Finland, Italy and Sweden appear nowhere in the ranking, because none of them legislates a minimum wage. Pay floors there are set by collective agreements, often sector by sector, and can be higher in practice than statutory minima elsewhere.
Their absence is a fact about how those labour markets are organised, not a gap in the data and certainly not a zero. Any chart of European minimum wages that shows twenty-seven bars is showing something that does not exist.
Monthly minimum wage in euros, second half of 2026
| Country | EUR per month |
|---|---|
| Luxembourg | 2,771 |
| Ireland | 2,391 |
| Germany | 2,343 |
| Romania | 825 |
| Latvia | 780 |
| Bulgaria | 620 |
This table as data: CSV · JSON
Every Member State for this indicator+
Members see every Member State for this indicator here, not only the rows the ranking prints. Become a Member
Embed this chart
Paste this code into a page. The frame carries the source and the extraction date, and links back to the study.
The same minimum wages in purchasing power standards, second half of 2026
| Country | PPS per month |
|---|---|
| Germany | 2,164 |
| Luxembourg | 2,108 |
| Netherlands | 2,023 |
| Bulgaria | 993 |
| Latvia | 938 |
| Estonia | 935 |
This table as data: CSV · JSON
Every Member State for this indicator+
Members see every Member State for this indicator here, not only the rows the ranking prints. Become a Member
Embed this chart
Paste this code into a page. The frame carries the source and the extraction date, and links back to the study.
What these figures cannot tell you
- Five Member States are absent by design
- Austria, Denmark, Finland, Italy and Sweden have no statutory minimum wage; pay floors are set through collective bargaining. They are excluded from every figure on this page. Their absence must never be rendered as zero, and rankings on this page are 'of the 22 Member States with a statutory minimum wage', not 'of the EU'.
- Purchasing power standards are estimates, not exchange rates
- PPS values come from price surveys of a common basket and carry the uncertainty of that construction. They are appropriate for comparing living standards across countries at a point in time, and inappropriate for tracking change over time, for which the euro series is the correct one.
- These are gross monthly amounts
- The figures are gross of tax and social contributions, which differ substantially across Member States. Two identical gross minima can leave very different amounts in a worker's hands, and this comparison does not attempt to model that.
- Monthly figures assume a national full-time month
- Where a minimum wage is legislated as an hourly rate, Eurostat converts it to a monthly figure using national conventions on full-time hours. Countries with shorter standard weeks are therefore compared on a different number of hours, and the monthly figures are not hourly rates.
Frequently asked questions
- Which EU country has the highest minimum wage?
- In euros, Luxembourg, at €2,771 a month in the second half of 2026, ahead of Ireland at €2,391 and Germany at €2,343. Adjusted for purchasing power the order changes: Germany is first at 2,164 PPS, ahead of Luxembourg at 2,108 and the Netherlands at 2,023.
- Which EU country has the lowest minimum wage?
- In euros, Bulgaria, at €620 a month. In purchasing power standards the lowest is Estonia at 935 PPS, with Latvia at 938 and Bulgaria at 993 — Bulgaria's lower domestic prices lift it above both.
- Which EU countries have no minimum wage?
- Austria, Denmark, Finland, Italy and Sweden have no statutory minimum wage. Pay floors in those countries are set by collective agreements, frequently sector by sector, and can exceed statutory minima elsewhere. They are excluded from the rankings on this page rather than counted as zero.
- Why compare wages in purchasing power standards?
- Because a wage is worth what it buys. Purchasing power standards are an artificial currency in which one unit buys the same basket of goods in every Member State, which strips out price level differences. Doing so cuts the gap between Europe's highest and lowest minimum wage from 4.47 times to 2.31 times.
Methodological note
Monthly minimum wages are published twice a year. This study uses the second semester of 2026, the most recent period available at the extraction date, in two currencies: euros and purchasing power standards.
Purchasing power standards are an artificial common currency in which one unit buys the same volume of goods and services in every Member State, which removes price level differences from the comparison.
Both ratios quoted — 4.47 in euros and 2.31 in purchasing power — are derived by Silver Data Lab by dividing the highest published value by the lowest, and are labelled as derived. The rank movements are likewise computed by us, by ranking the same 22 countries under each currency and taking the difference in position.
Source data
The underlying series can be inspected and re-downloaded from the Eurostat data browser. The filters below are the ones applied.
Monthly minimum wages — bi-annual data
earn_mw_cur
- Filters applied:
- freq=S · currency=EUR, PPS · time=2026-S2
- Extracted:
- 2026-08-11
- Source last updated:
- 2026-07-31
Download the data
The data the study you have just read is built on, exactly as it was downloaded and archived.
Yours as a Member.
Data downloadable by Members
How to cite
Record the vintage as well as the study: the figures on this page are the ones extracted on the dates below.
Silver Data Lab Research Desk (2026). Germany's Legal Minimum Wage Buys More Than Any Other in the EU. Silver Data Lab, published 03 August 2026, last updated 11 October 2026. https://www.silverdatalab.com/studies/minimum-wages-in-the-eu
- Data: Eurostat, Monthly minimum wages — bi-annual data (earn_mw_cur), filters freq=S, currency=EUR, PPS, time=2026-S2; extracted 2026-08-11; source last updated 2026-07-31. https://doi.org/10.2908/earn_mw_cur
Silver Data Lab's analysis is licensed CC BY 4.0. The statistics remain their publisher's and keep its terms of reuse.
Ask the research desk
A question about this study — a definition, a filter, a break in the series, what the figures can and cannot support — answered by the desk that made the extraction.
Members can write to the research desk
Studies where the same country leads or trails
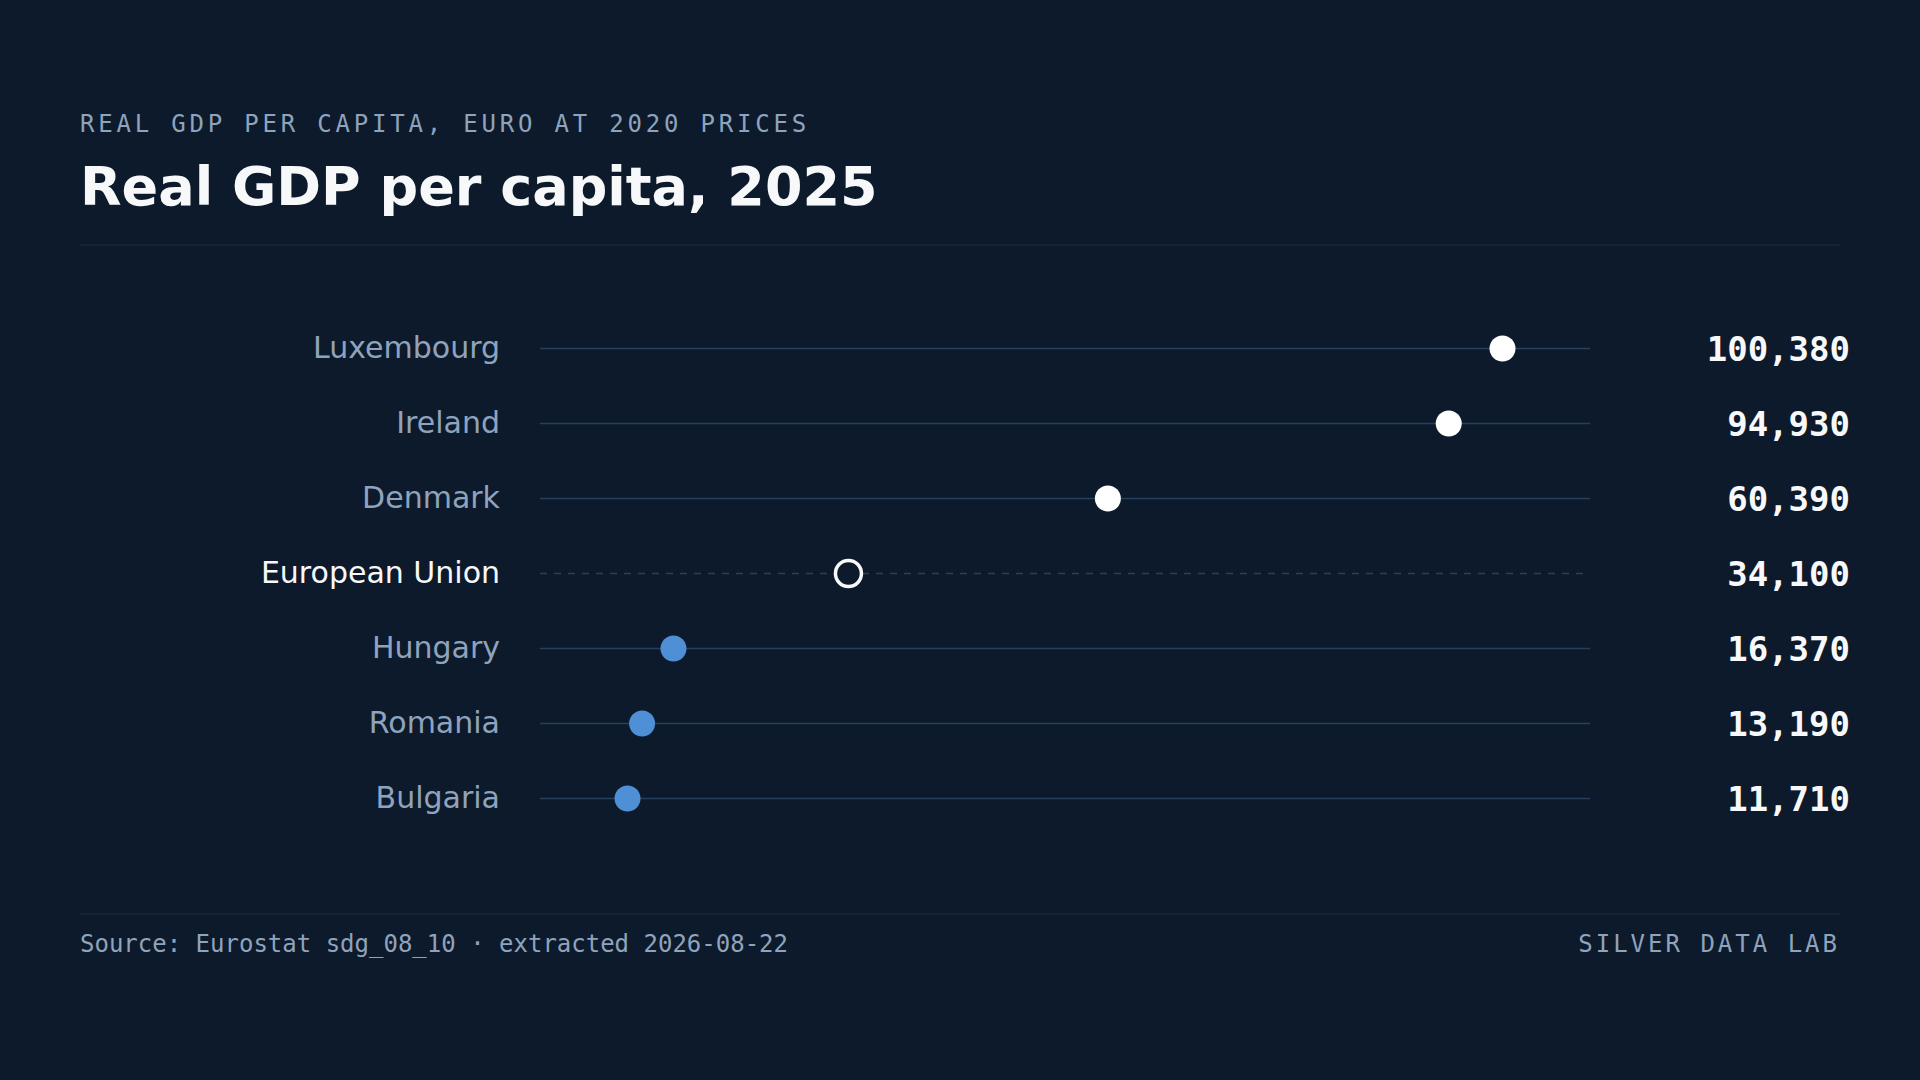
Bulgaria's GDP per Person Is About a Third of the EU Average
EU real GDP per capita was 34,250 euro in 2025, at 2020 prices.
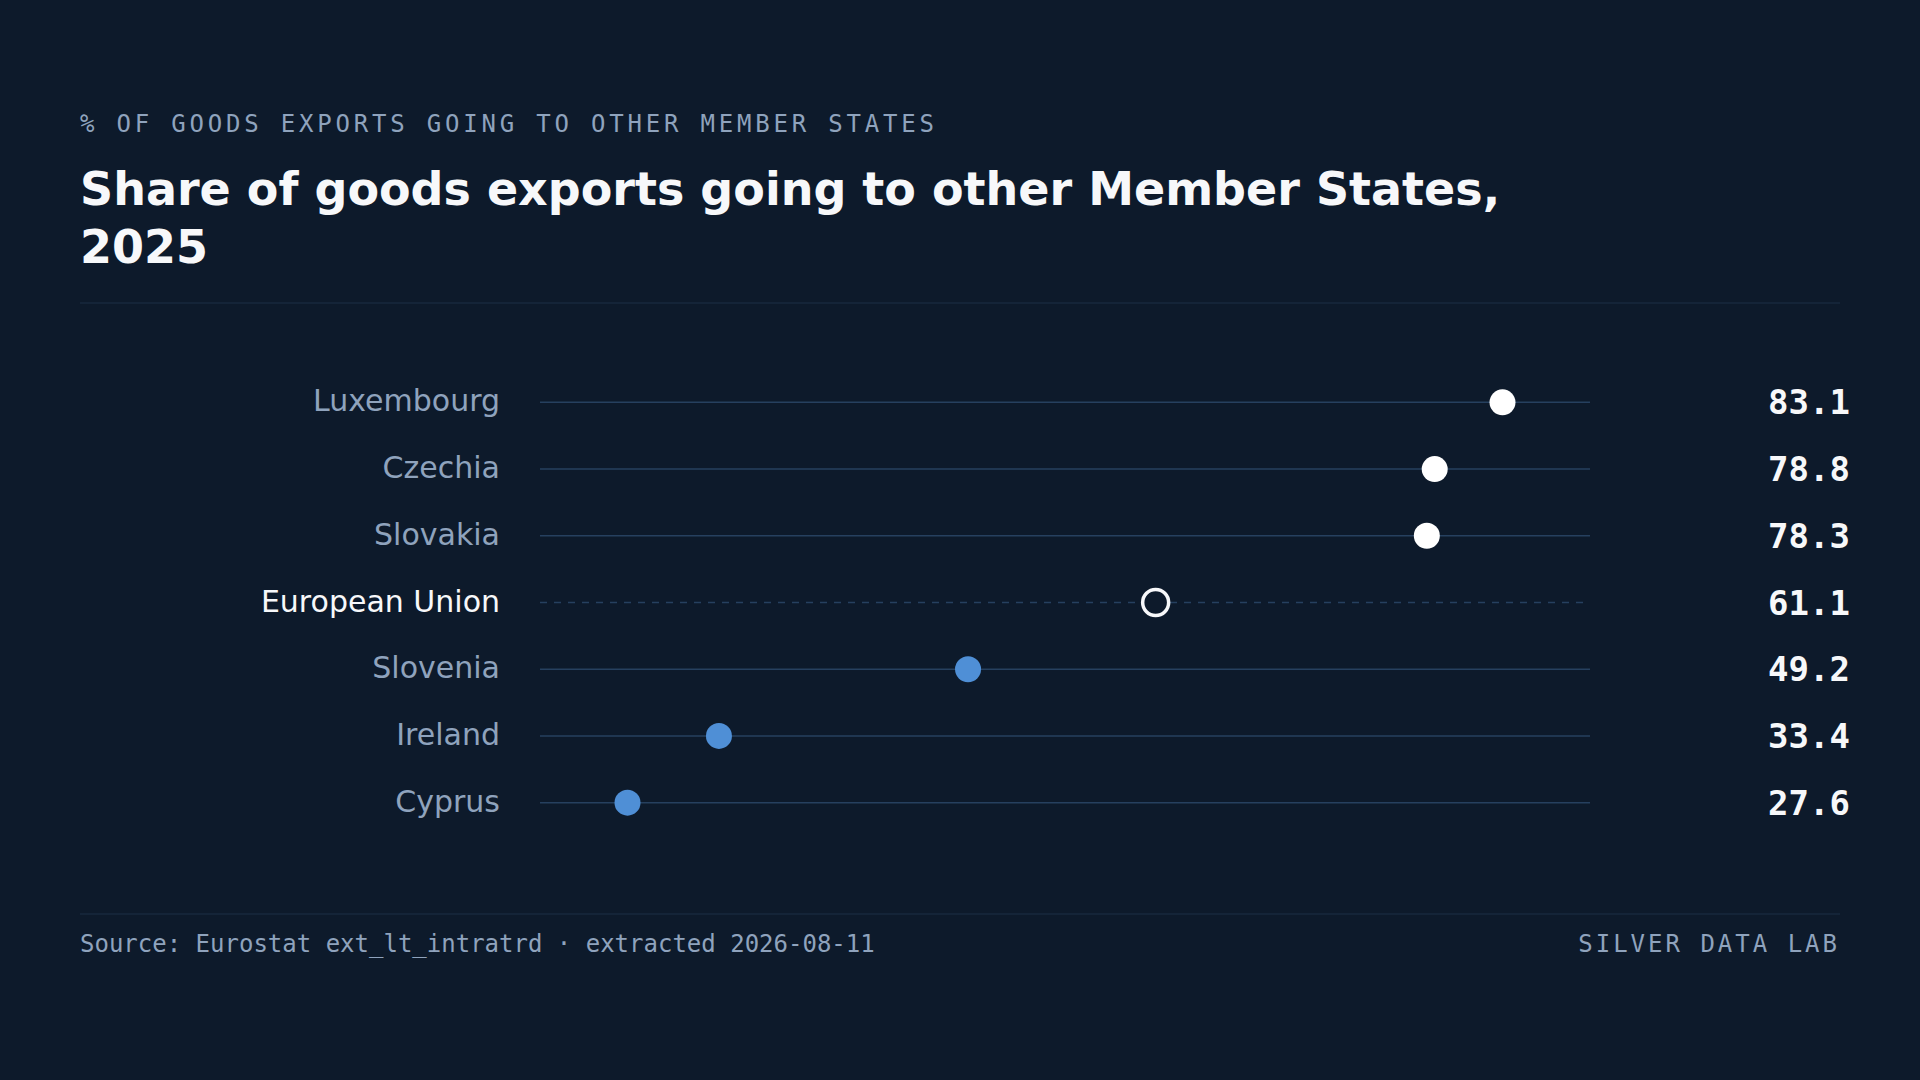
EU Countries Sell 61.1% of Their Goods Exports to Each Other
61.1% of the goods exported by EU Member States in 2025 went to other Member States.
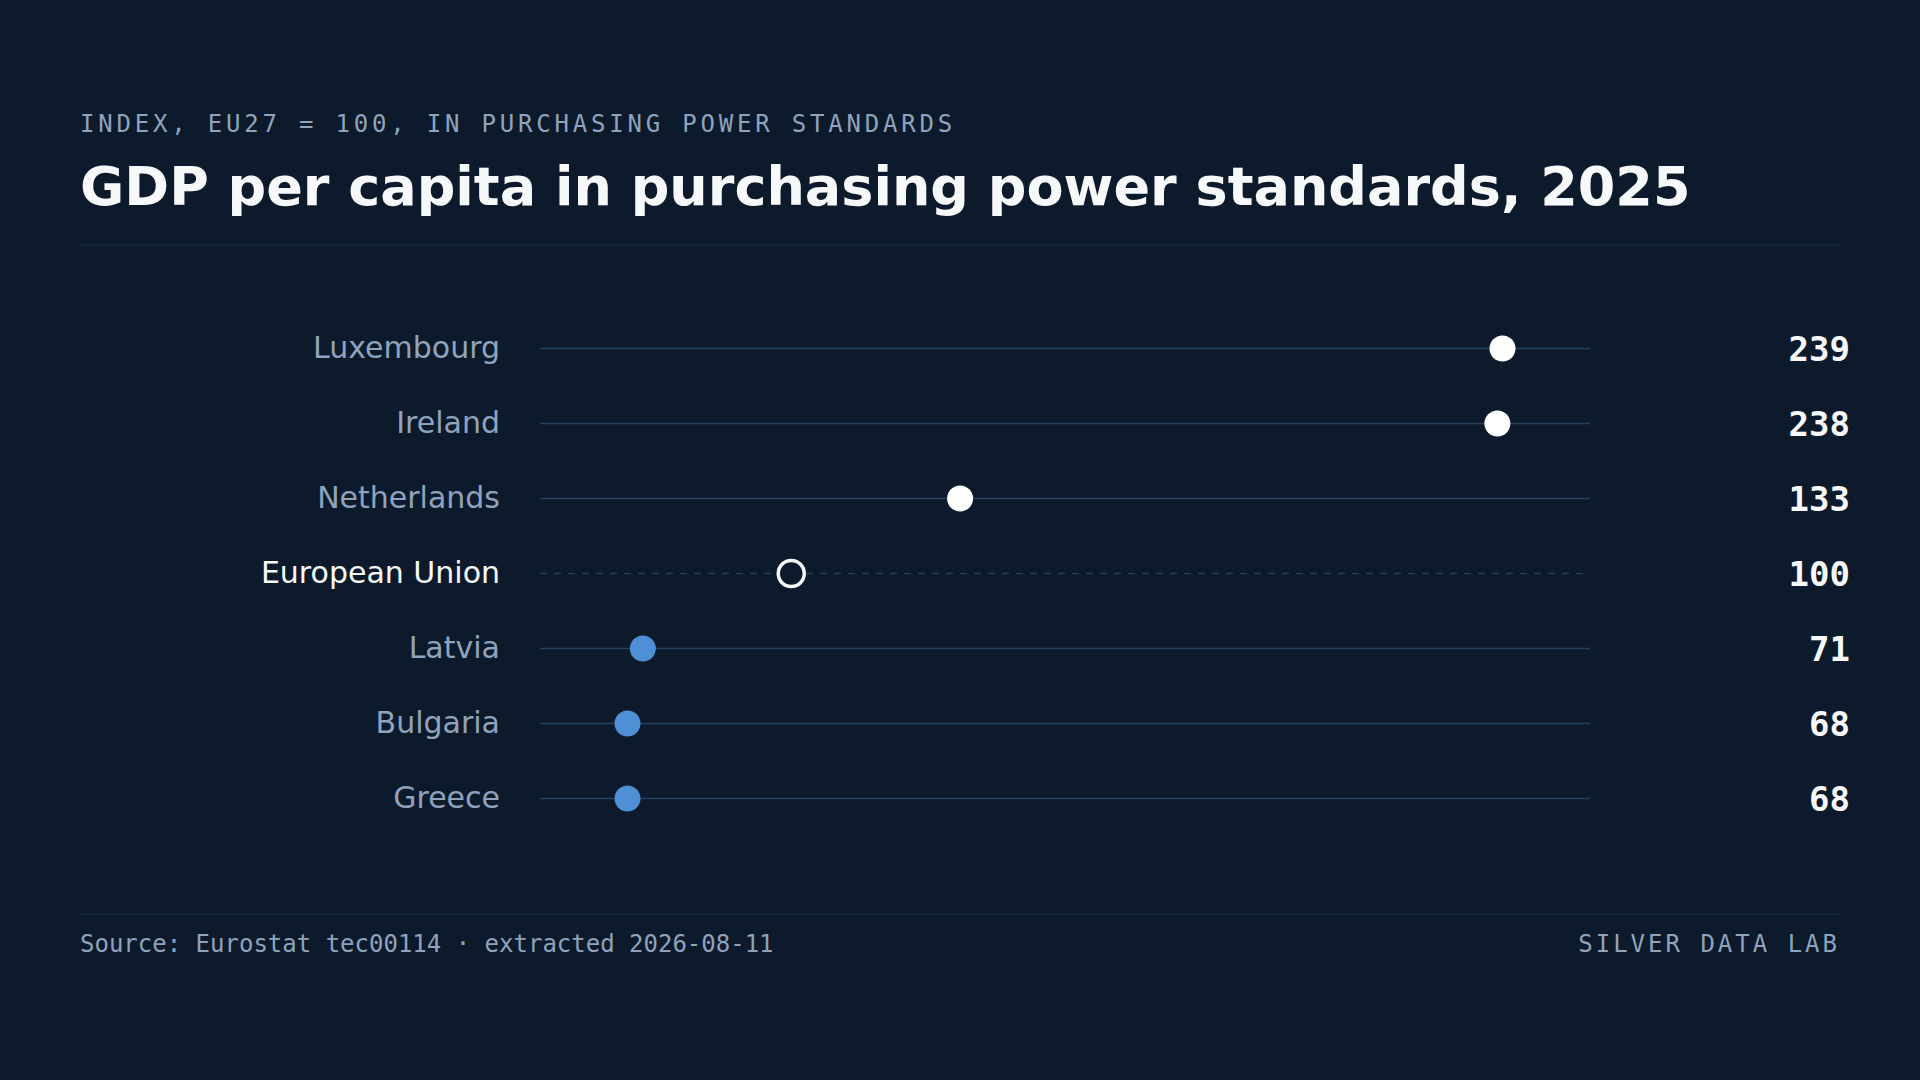
GDP per Head Makes Luxembourg and Ireland Look Richer Than They Are
Luxembourg records 239 and Ireland 238 against an EU average of 100 — more than double the Union's output per head.