Romanians Rate Their Lives Higher Than Germans Do
Silver Data Lab Research Desk · Statistical analysis · Published on 11 June 2026
- Data source
- Eurostat
- Reference period
- 2024
- Last updated
- 11 June 2026
Re-checked against the source on 21 October 2026. No value in its datasets has moved between the snapshots we hold. Every revision we have observed →
Key estimates
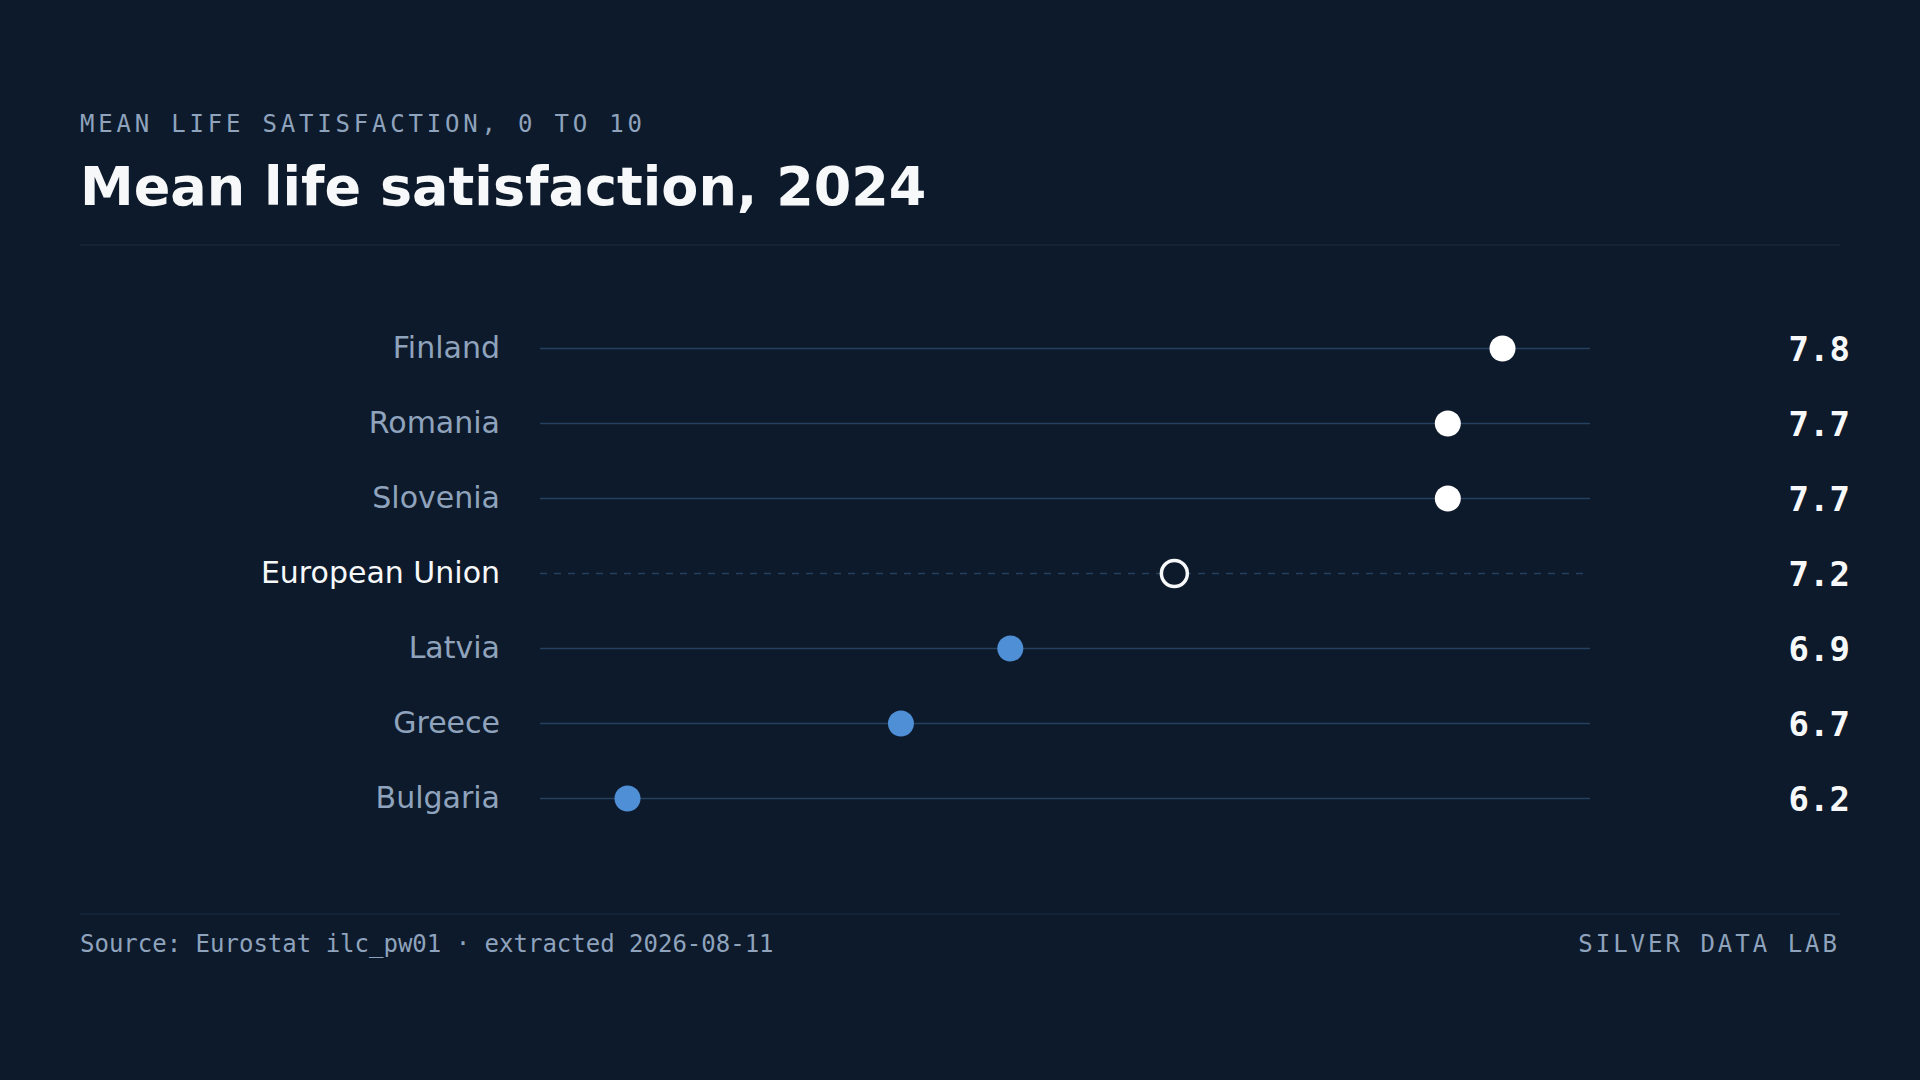
- Europeans aged 16 and over rated their overall life satisfaction at 7.2 out of 10 in 2024.
- Finland records the highest mean at 7.8, followed by Romania and Slovenia at 7.7.
- Bulgaria records 6.2, Greece 6.7 and Latvia 6.9.
- Germany records 7.0 and France 7.1 — both below the EU mean and below Romania and Poland.
- The entire range across the Union is 1.6 points on an eleven-point scale.
A survey question, asked the same way everywhere
Respondents are asked to rate their overall satisfaction with life on a scale from zero to ten. The mean of those answers is what this indicator reports.
For the EU in 2024 it was 7.2. The national means run from 7.8 to 6.2.
The ordering does not follow income
Finland records the highest mean at 7.8, which is consistent with what surveys of this kind usually find in the Nordic countries.
Immediately behind it are Romania and Slovenia at 7.7, and behind them Belgium, Denmark, the Netherlands, Austria and Poland at 7.6.
Romania at second place is the finding. It has the lowest tertiary attainment in the Union, the highest NEET rate, and one of the lowest income levels, all covered separately on this site. On this measure it sits above every large western Member State.
Poland at 7.6 is in the same position, and Slovakia at 7.3 and Czechia at 7.4 are above Germany.
Germany at 7.0 sits twenty-fourth of twenty-seven, ahead only of Latvia, Greece and Bulgaria. France records 7.1.
What to make of that
Two readings are available and this study cannot decide between them.
The first is that self-reported satisfaction genuinely does not track material conditions closely once a threshold is passed, and that a ranking of how people feel about their lives is entitled to differ from a ranking of what they have.
The second is that a zero-to-ten question is answered against a local reference point. What counts as a seven depends on what a respondent is comparing their life to, and that comparison is national rather than European. Under this reading the numbers are not measuring the same quantity in Bucharest and Berlin at all.
Both are plausible. Nothing in this dataset distinguishes them, and any account of the ranking that presents one of them as established is going beyond the evidence.
The low end
Bulgaria records 6.2, the lowest in the Union and 1.6 points below Finland. Greece at 6.7 and Latvia at 6.9 follow.
Bulgaria is also the lowest on volunteering and among the lowest on several material measures, so it is one of the few Member States where the subjective and objective rankings agree.
Why the range matters
The full spread across twenty-seven Member States is 1.6 points on a scale of eleven. That is narrow, and it is the most important feature of the distribution.
It means that most of the differences reported here are small, that a gap of a tenth of a point between two Member States carries no information, and that this indicator separates the extremes reasonably and the middle barely at all.
Mean life satisfaction, 2024
| Country | rating, 0 to 10 | Gap to EU averagederived |
|---|---|---|
| Finland | 7.8 | +0.6 |
| Romania | 7.7 | +0.5 |
| Slovenia | 7.7 | +0.5 |
| European Unionaggregate | 7.2 | — |
| Latvia | 6.9 | −0.3 |
| Greece | 6.7 | −0.5 |
| Bulgaria | 6.2 | −1.0 |
This table as data: CSV · JSON
Every Member State for this indicator+
Members see every Member State for this indicator here, not only the rows the ranking prints. Become a Member
Embed this chart
Paste this code into a page. The frame carries the source and the extraction date, and links back to the study.
What these figures cannot tell you
- Self-reported, and answered against a local reference
- Respondents rate their satisfaction relative to their own expectations and surroundings. Whether a seven in one country means the same as a seven in another is not established, and it is the central unresolved question about this indicator.
- The range is narrow
- The full spread across the Union is 1.6 points on an eleven-point scale. Differences of a tenth of a point between Member States should not be treated as meaningful, and the middle of the ranking is not well separated.
- Survey data
- Figures come from EU-SILC, a sample survey. They are estimates with sampling error rather than counts.
- A mean conceals its distribution
- Two countries with the same mean can have very different shares of people reporting very low satisfaction. This indicator does not show the spread within a country, which for some purposes matters more than the average.
Frequently asked questions
- How satisfied are Europeans with their lives?
- On average 7.2 out of 10 in 2024, for the population aged 16 and over. National means run from 7.8 in Finland to 6.2 in Bulgaria.
- Which EU country is the most satisfied?
- Finland, with a mean of 7.8 out of 10 in 2024, followed by Romania and Slovenia at 7.7 and then a group of five Member States at 7.6.
- Why does Romania score higher than Germany?
- Romania records 7.7 and Germany 7.0. Two explanations are available and this data cannot separate them: either self-reported satisfaction genuinely does not track material conditions closely, or a zero-to-ten question is answered against a national reference point rather than a European one, so the two figures are not measuring quite the same thing.
- Which EU country is the least satisfied?
- Bulgaria, at 6.2 out of 10 in 2024, followed by Greece at 6.7 and Latvia at 6.9. Bulgaria is one of the few Member States where the subjective ranking and the material ones agree.
Methodological note
Overall life satisfaction is collected in EU-SILC as a single question asking respondents to rate their satisfaction with life on a scale of 0 to 10. This study uses the mean rating for the population aged 16 and over, all education levels, both sexes.
Values are for 2024, the most recent year with complete coverage of the 27 Member States at the extraction date. The series is not annual throughout its history: earlier waves are 2013, 2018, 2021 and following years.
The comparisons with tertiary attainment, NEET rates and volunteering draw on companion studies on this site, each with its own extraction.
Source data
The underlying series can be inspected and re-downloaded from the Eurostat data browser. The filters below are the ones applied.
Overall life satisfaction by sex, age and educational attainment
ilc_pw01
- Filters applied:
- freq=A · statinfo=AVG · unit=RTG · isced11=TOTAL · life_sat=LIFE · sex=T · age=Y_GE16 · time=2024
- Extracted:
- 2026-10-21
- Source last updated:
- 2026-10-20
Download the data
The data the study you have just read is built on, exactly as it was downloaded and archived.
Yours as a Member.
Data downloadable by Members
How to cite
Record the vintage as well as the study: the figures on this page are the ones extracted on the dates below.
Silver Data Lab Research Desk (2026). Romanians Rate Their Lives Higher Than Germans Do. Silver Data Lab, published 11 June 2026, last updated 11 June 2026. https://www.silverdatalab.com/studies/life-satisfaction-in-the-eu
- Data: Eurostat, Overall life satisfaction by sex, age and educational attainment (ilc_pw01), filters freq=A, statinfo=AVG, unit=RTG, isced11=TOTAL, life_sat=LIFE, sex=T, age=Y_GE16, time=2024; extracted 2026-10-21; source last updated 2026-10-20. https://doi.org/10.2908/ilc_pw01
Silver Data Lab's analysis is licensed CC BY 4.0. The statistics remain their publisher's and keep its terms of reuse.
Ask the research desk
A question about this study — a definition, a filter, a break in the series, what the figures can and cannot support — answered by the desk that made the extraction.
Members can write to the research desk
Studies where the same country leads or trails
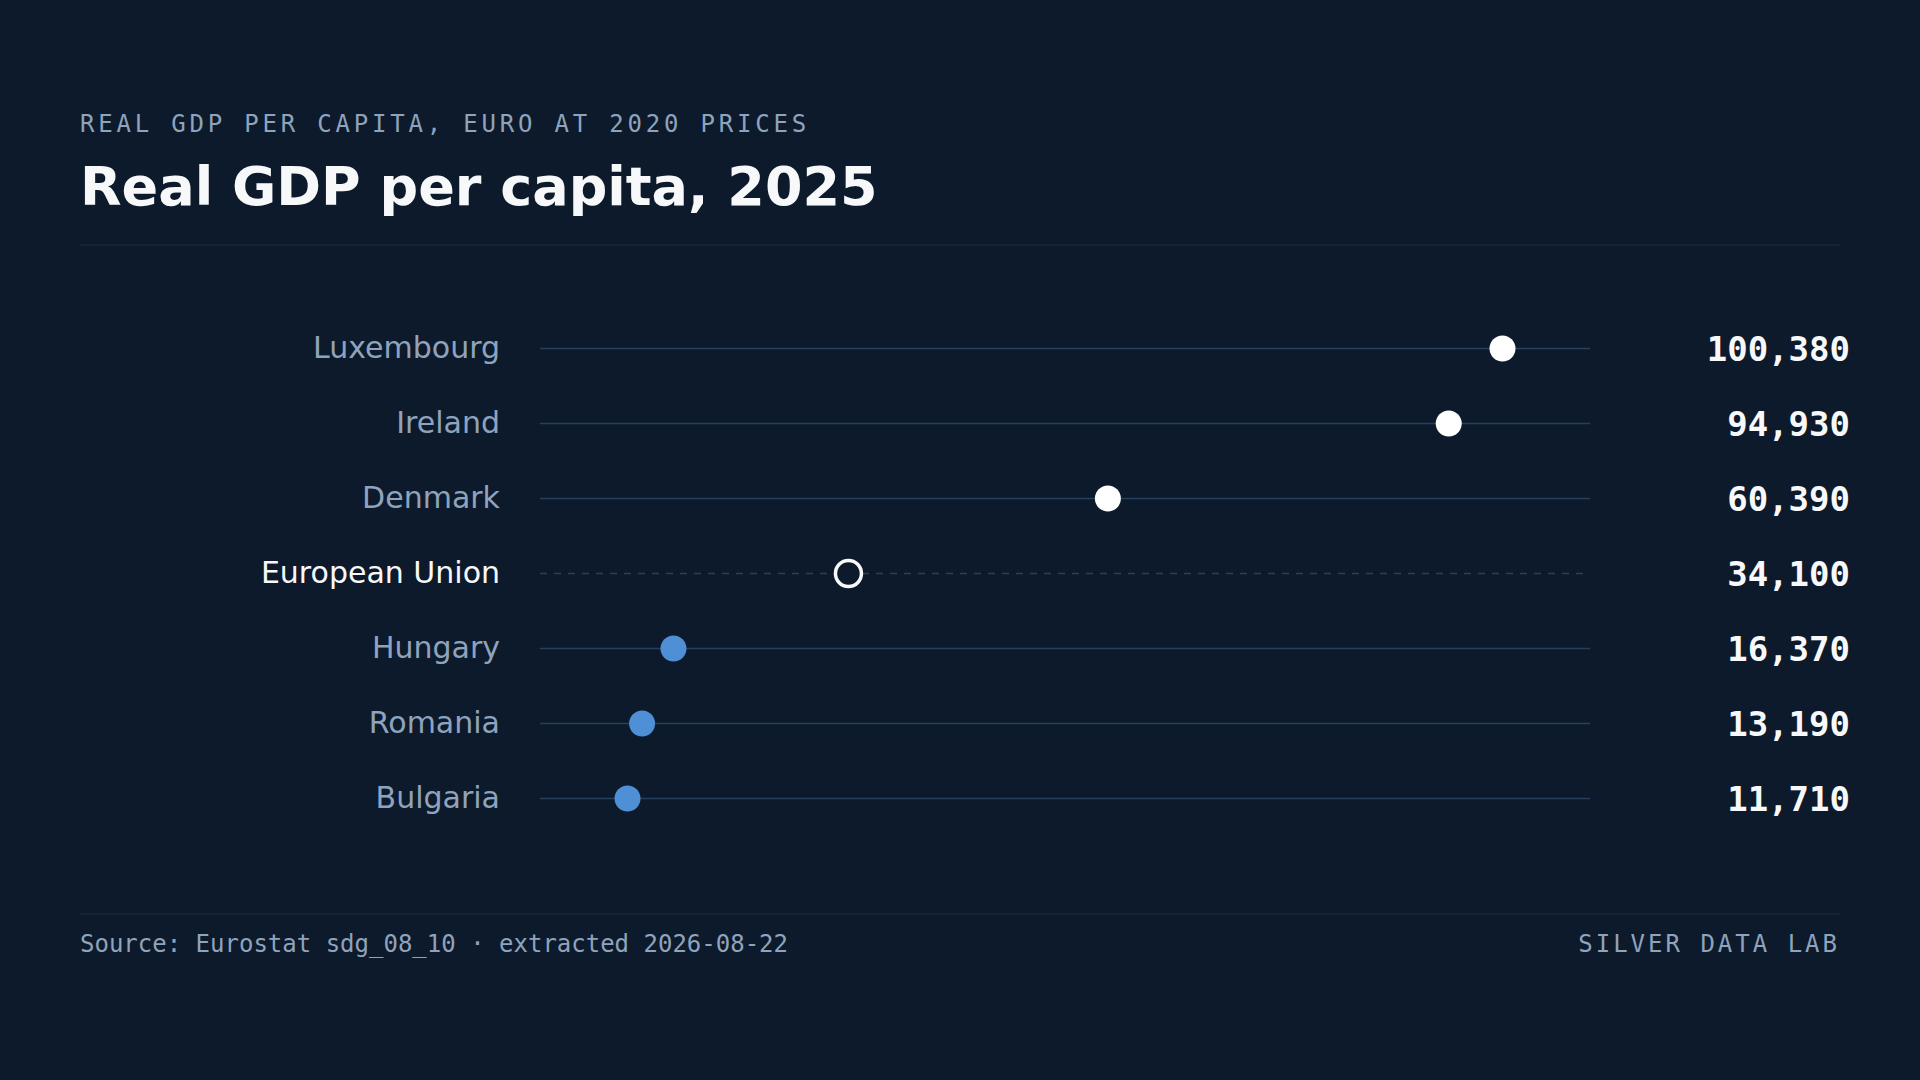
Bulgaria's GDP per Person Is About a Third of the EU Average
EU real GDP per capita was 34,250 euro in 2025, at 2020 prices.
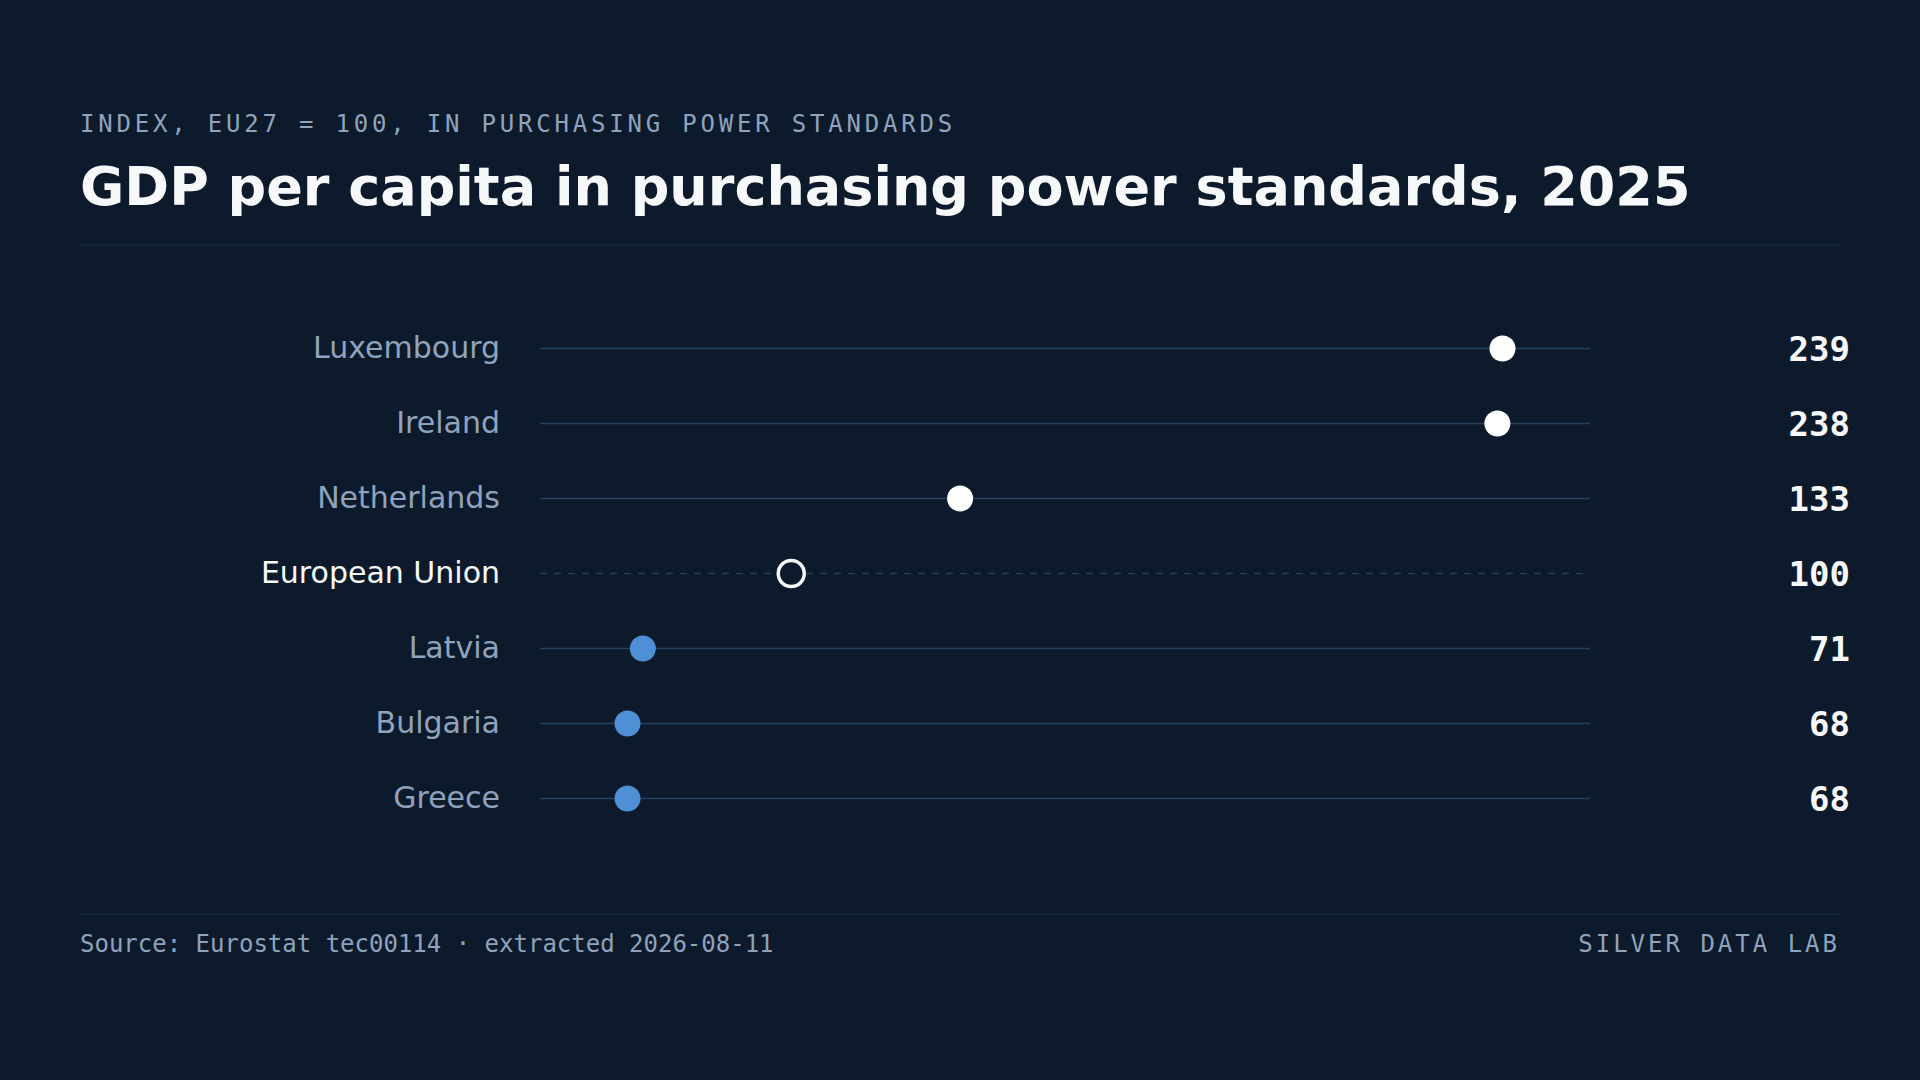
GDP per Head Makes Luxembourg and Ireland Look Richer Than They Are
Luxembourg records 239 and Ireland 238 against an EU average of 100 — more than double the Union's output per head.
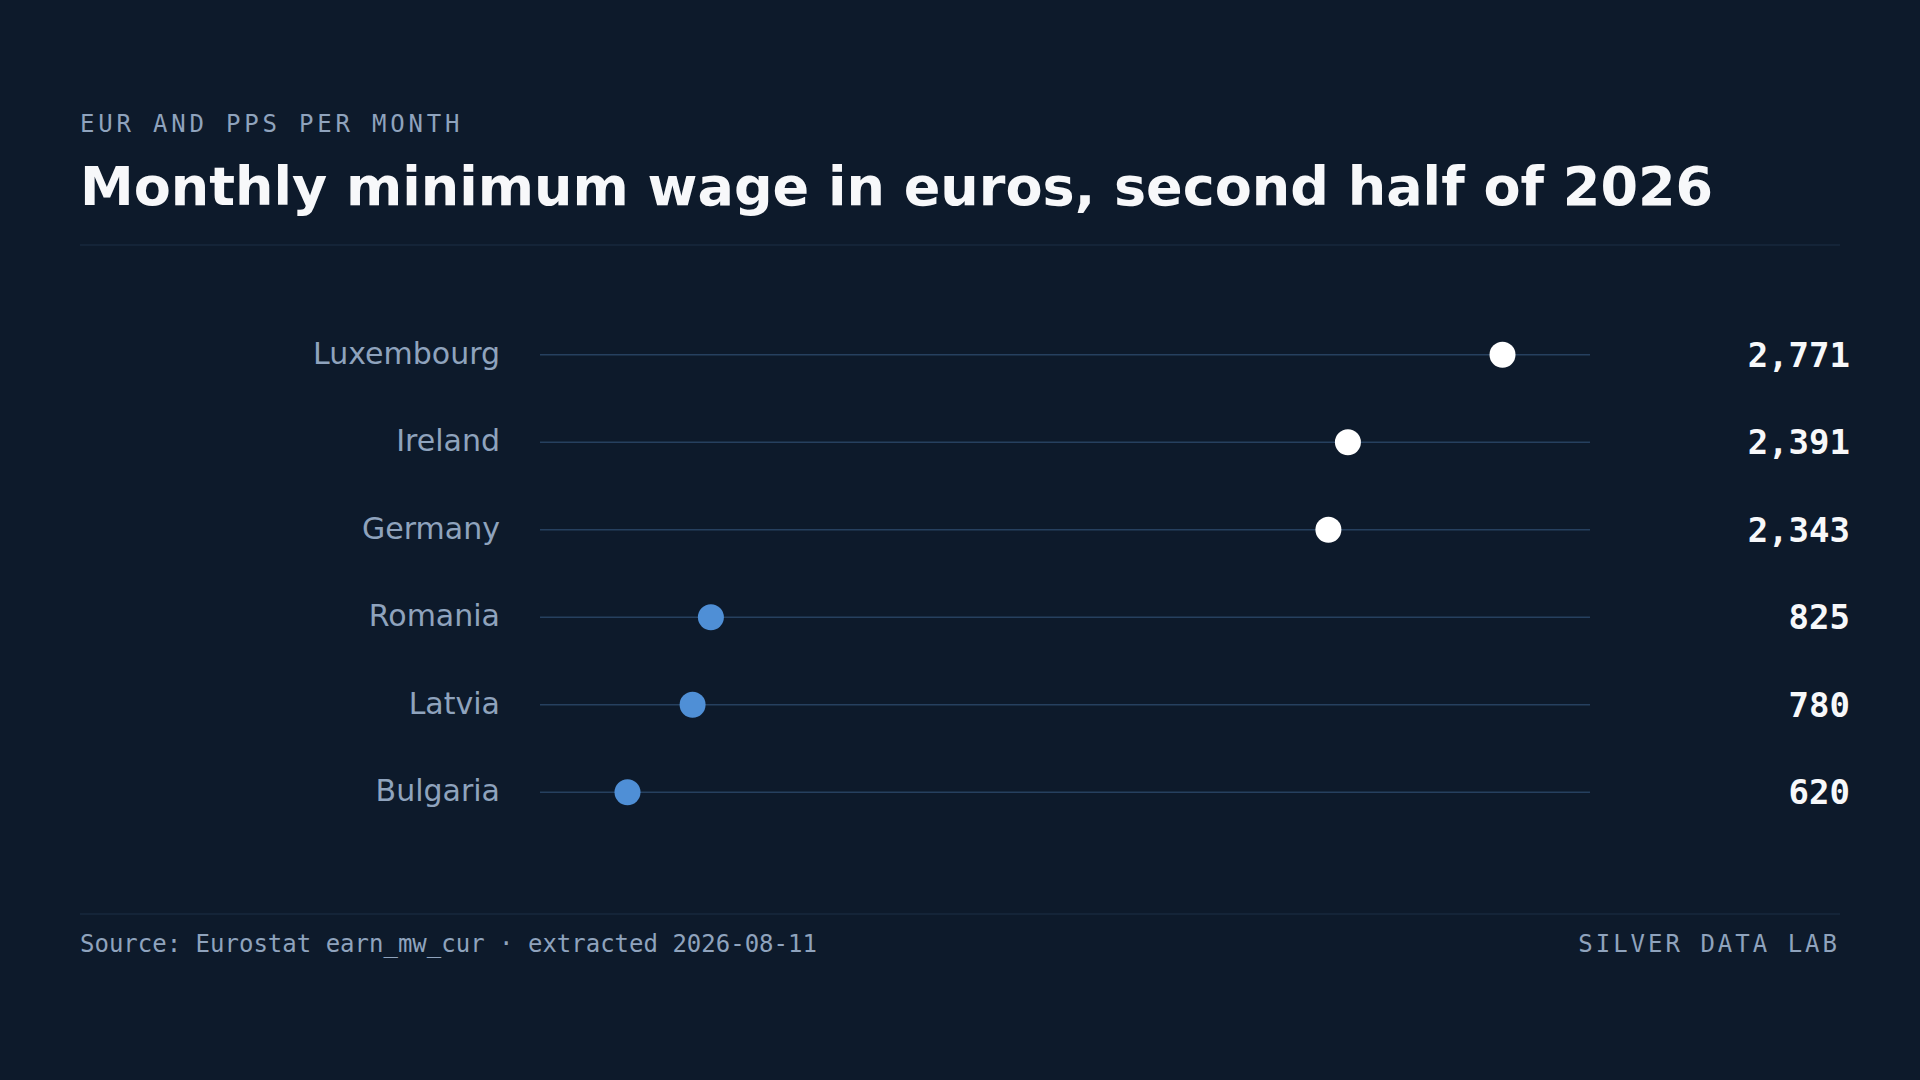
Germany's Legal Minimum Wage Buys More Than Any Other in the EU
22 of the 27 Member States set a statutory minimum wage. Austria, Denmark, Finland, Italy and Sweden do not, leaving pay floors to collective agreements.