In Sweden, Non-EU Citizens Are Unemployed at 3.5 Times the Rate of Swedes
Silver Data Lab Research Desk · Statistical analysis · Published on 03 July 2026
- Data source
- Eurostat
- Reference period
- 2025
- Last updated
- 11 October 2026
Re-checked against the source on 11 September 2026. 2 values in its datasets moved between snapshots; none is a figure stated on this page. Every revision we have observed →
Key estimates
- Non-EU citizens aged 20 to 64 faced 12.3% unemployment in the EU in 2025, against 5.2% for nationals.
- Sweden records 22.8% for non-EU citizens against 6.5% for nationals — a gap of 16.3 points, the widest in the Union.
- Finland records 20.7% against 8.0%, a gap of 12.7 points.
- In Greece the two rates are effectively equal: 8.7% for non-EU citizens against 8.8% for nationals.
- Eurostat publishes no non-EU rate for seven Member States, so this ranking covers twenty.
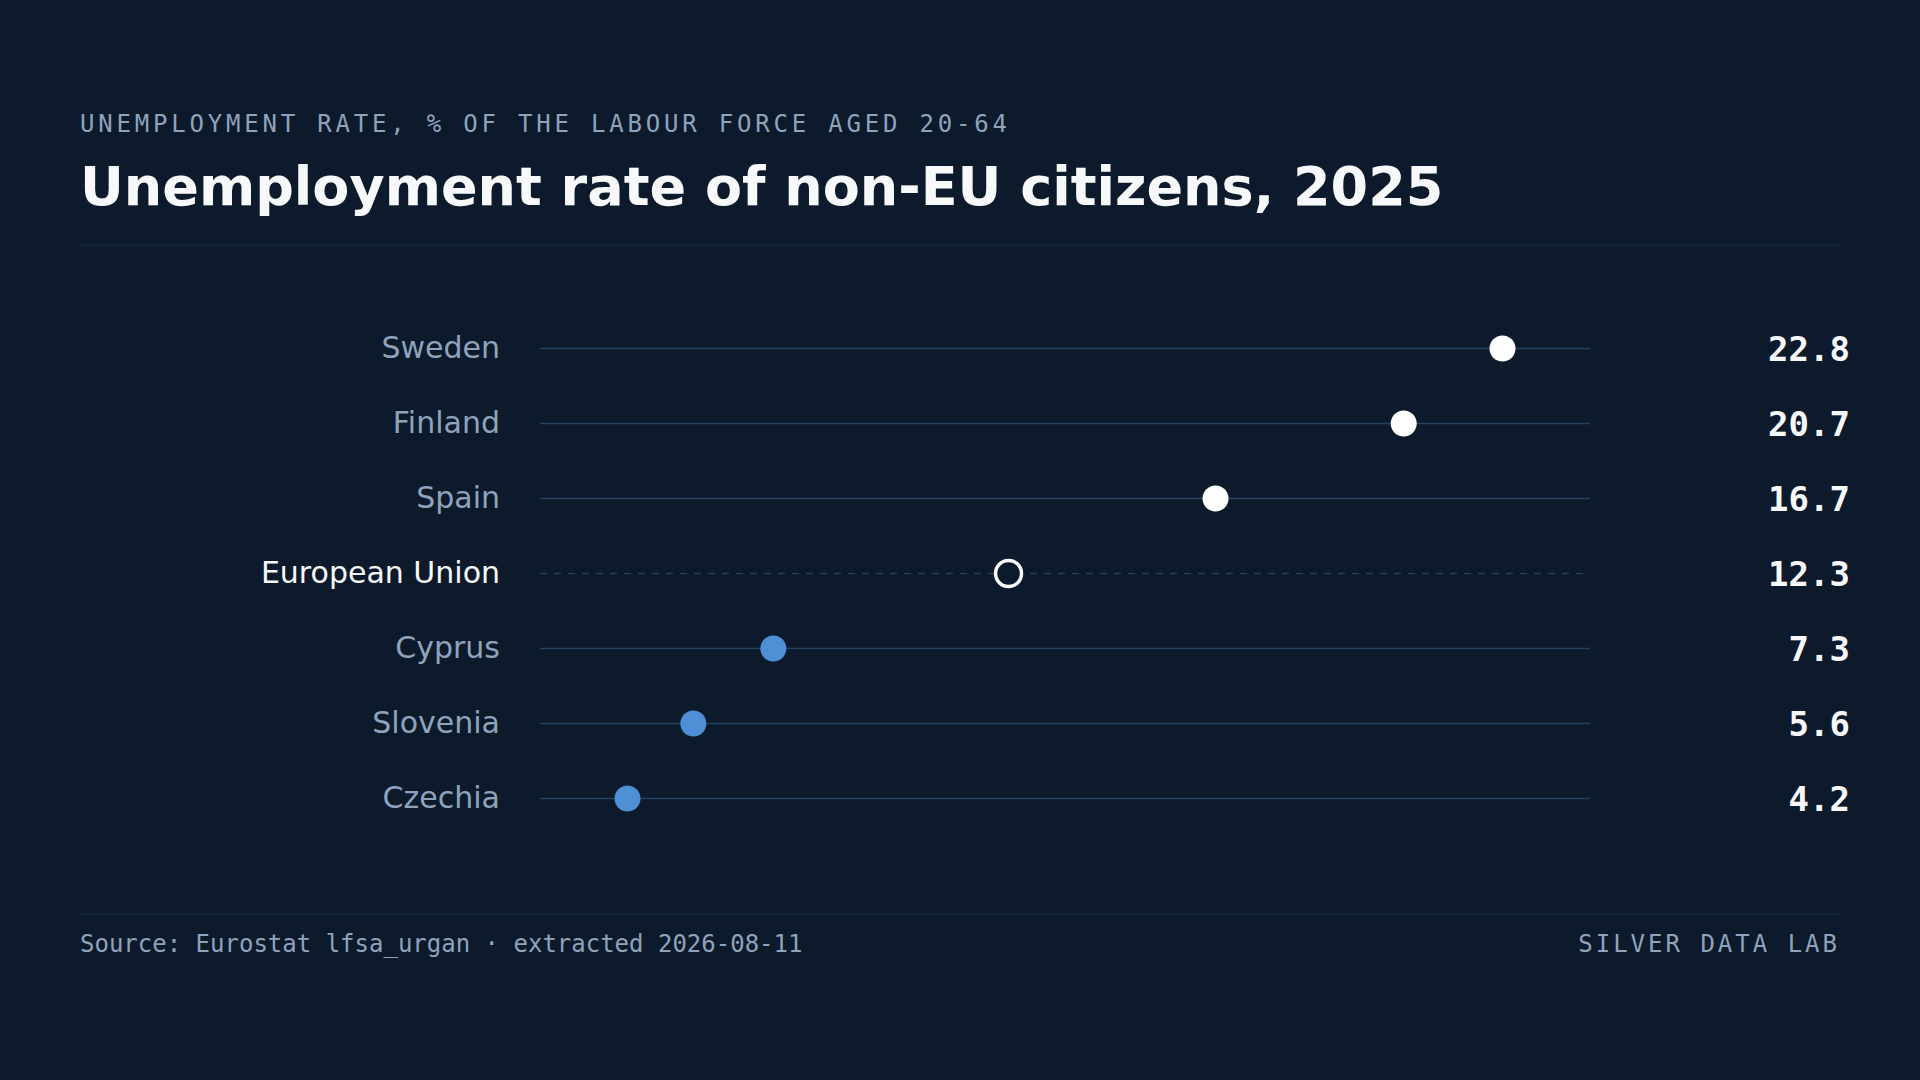
Two rates from the same labour force survey
The labour force survey records unemployment by citizenship, which allows the rate for nationals and the rate for citizens of non-EU countries to be read side by side.
For the EU in 2025 the two figures were 5.2% for nationals and 12.3% for non-EU citizens. Non-EU citizens in the Union are unemployed at roughly two and a third times the rate of nationals.
Behind that aggregate the national gaps vary more than either rate does.
Sweden and Finland
Sweden records 22.8% unemployment among non-EU citizens against 6.5% among nationals: a gap of 16.3 percentage points and a ratio of three and a half to one.
Finland is second at 20.7% against 8.0%, a gap of 12.7 points.
Both are countries with strong labour protections, high wage floors and well-funded integration programmes, and both have the widest gaps in the Union. That combination is the central puzzle in this data and it has more than one candidate explanation — the composition of recent arrivals, the share who came as refugees rather than for work, the difficulty of entering a labour market with high entry-level wages and formal qualification requirements.
None of those can be tested with this extraction, and this study does not adjudicate between them. What it establishes is that the countries with the most developed integration policy are not the countries with the smallest gaps, which rules out the simplest possible account.
Greece
Greece records 8.7% for non-EU citizens and 8.8% for nationals. The gap is negative by a tenth of a point, which is to say there is none.
Greek unemployment among nationals is among the highest in the Union, so parity here is not a sign that non-EU citizens are doing well. It is a sign that they are doing about as badly as everyone else — the gap closes from the wrong direction.
Czechia at 4.2% against 2.6%, Poland at 4.4% against 3.0% and Slovenia at 5.6% against 3.3% have the smallest positive gaps, all in tight labour markets where non-EU citizens are largely present as workers recruited into specific shortages.
The coverage problem
Eurostat publishes no non-EU citizen unemployment rate for Bulgaria, Denmark, Croatia, Hungary, Malta, Romania or Slovakia in 2025. In most of those the non-EU resident population is too small for the survey to produce a reliable estimate.
Denmark's absence is the one that limits this study most, because it is the Nordic Member State that would test the Swedish and Finnish pattern. Its exclusion is a gap in the evidence and not a neutral omission.
The twenty Member States covered here include all the Union's largest economies, so the EU aggregate is not materially affected. The ranking, however, is a ranking of twenty countries and should be read as one.
Unemployment rate of non-EU citizens, 2025
| Country | % of the labour force aged 20-64 | Gap to EU averagepercentage points, derived |
|---|---|---|
| Sweden | 22.8 | +10.5 |
| Finland | 20.7 | +8.4 |
| Spain | 16.7d | +4.4 |
| European Unionaggregate | 12.3 | — |
| Slovenia | 5.6 | −6.7 |
| Poland | 4.4 | −7.9 |
| Czechia | 4.2 | −8.1 |
Flags carried by the source on these values: d definition differs
This table as data: CSV · JSON
Every Member State for this indicator+
Members see every Member State for this indicator here, not only the rows the ranking prints. Become a Member
Embed this chart
Paste this code into a page. The frame carries the source and the extraction date, and links back to the study.
What these figures cannot tell you
- Seven Member States are missing
- Bulgaria, Denmark, Croatia, Hungary, Malta, Romania and Slovakia have no published non-EU rate for 2025, generally because their non-EU resident populations are too small for reliable survey estimation. This ranking covers the remaining twenty.
- Citizenship is not origin
- The measure is based on legal citizenship, not country of birth. Someone born abroad who has naturalised counts as a national, and how easily a country grants citizenship therefore affects who appears in each group. Countries with fast naturalisation move their most established migrants into the national figure.
- Unemployment excludes those not seeking work
- The rate is measured against the labour force, so people who are not working and not looking for work are outside it entirely. A low unemployment rate can coexist with very low employment, and the two must be read together.
- Composition is not controlled
- Non-EU citizens differ from nationals in age, education, language and time since arrival. None of that is adjusted for here, so the gaps reported are raw differences and not estimates of the effect of citizenship itself.
Frequently asked questions
- What is the unemployment rate for migrants in the EU?
- 12.3% for non-EU citizens aged 20 to 64 in 2025, against 5.2% for nationals of the reporting country — roughly two and a third times higher.
- Which EU country has the widest migrant employment gap?
- Sweden, where non-EU citizens face 22.8% unemployment against 6.5% for nationals: a gap of 16.3 percentage points. Finland follows at 20.7% against 8.0%.
- Are there EU countries with no gap?
- Greece, where non-EU citizens record 8.7% unemployment and nationals 8.8%. That parity is not a sign of successful integration: Greek unemployment among nationals is among the Union's highest, so the gap closes because everyone is doing badly rather than because migrants are doing well.
- Why are some countries missing from this comparison?
- Eurostat publishes no non-EU citizen rate for Bulgaria, Denmark, Croatia, Hungary, Malta, Romania or Slovakia in 2025, generally because their non-EU resident populations are too small for reliable survey estimates. The ranking covers the other twenty Member States.
Methodological note
Unemployment rates by citizenship are published by Eurostat from the EU labour force survey. This study uses the rate for the population aged 20 to 64, both sexes, for two citizenship groups: nationals of the reporting country, and citizens of countries outside the EU.
Values are for 2025. Seven Member States have no published non-EU rate for that year and are excluded from the ranking; the EU aggregate is as published.
The gaps between the two rates, and the ratios between them, are computed by Silver Data Lab by subtracting one published series from the other and are labelled as derived.
Source data
The underlying series can be inspected and re-downloaded from the Eurostat data browser. The filters below are the ones applied.
Unemployment rates by citizenship
lfsa_urgan
- Filters applied:
- freq=A · unit=PC · sex=T · age=Y20-64 · citizen=NAT, NEU27_2020_FOR · time=2025
- Extracted:
- 2026-09-11
- Source last updated:
- 2026-09-10
Download the data
The data the study you have just read is built on, exactly as it was downloaded and archived.
Yours as a Member.
Data downloadable by Members
How to cite
Record the vintage as well as the study: the figures on this page are the ones extracted on the dates below.
Silver Data Lab Research Desk (2026). In Sweden, Non-EU Citizens Are Unemployed at 3.5 Times the Rate of Swedes. Silver Data Lab, published 03 July 2026, last updated 11 October 2026. https://www.silverdatalab.com/studies/migrant-unemployment-in-the-eu
- Data: Eurostat, Unemployment rates by citizenship (lfsa_urgan), filters freq=A, unit=PC, sex=T, age=Y20-64, citizen=NAT, NEU27_2020_FOR, time=2025; extracted 2026-09-11; source last updated 2026-09-10. https://doi.org/10.2908/lfsa_urgan
Silver Data Lab's analysis is licensed CC BY 4.0. The statistics remain their publisher's and keep its terms of reuse.
Ask the research desk
A question about this study — a definition, a filter, a break in the series, what the figures can and cannot support — answered by the desk that made the extraction.
Members can write to the research desk
Studies where the same country leads or trails
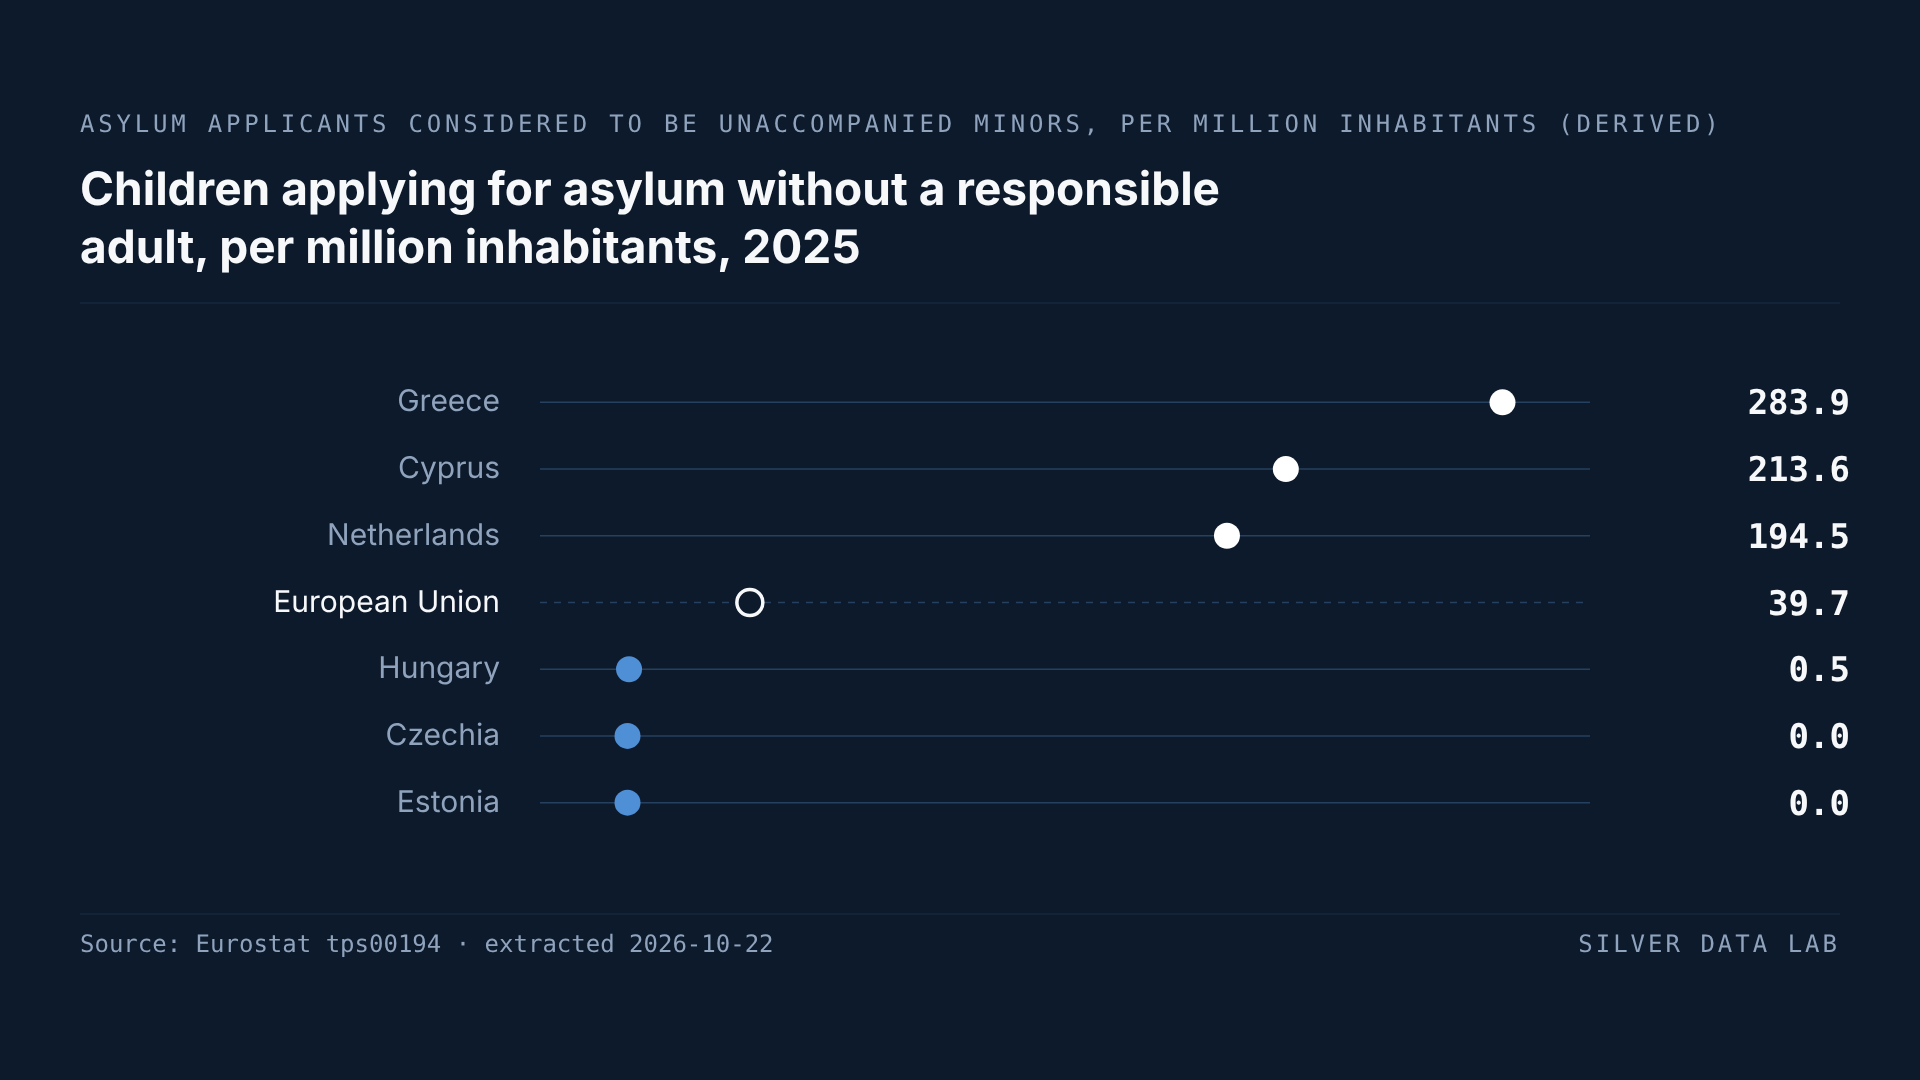
45.9% Fewer Children Sought Asylum Alone in the EU Than a Year Earlier
In 2025, 17,930 children applied for asylum in the EU without a parent or another adult responsible for them, against 33,160 in 2024: a derived fall of 45.9%, to the lowest figure since 2020.
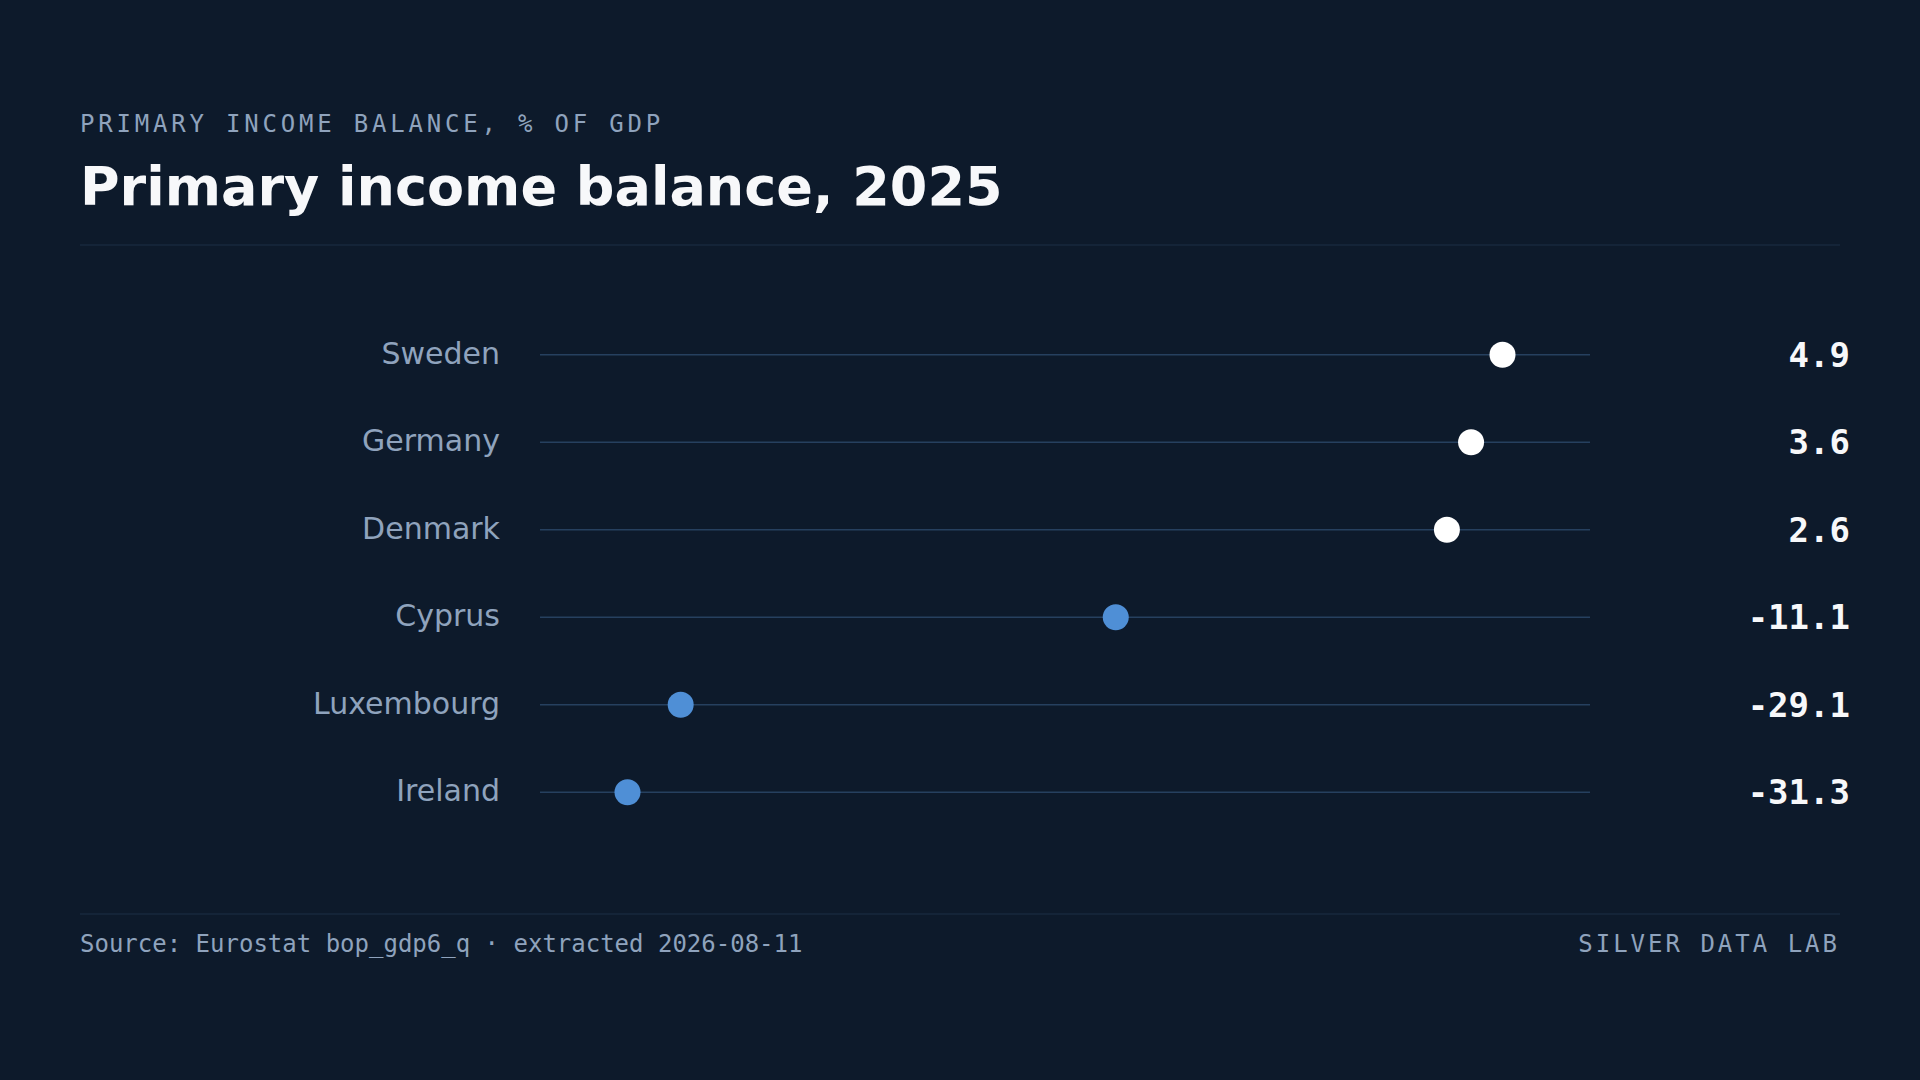
Ireland Pays Out More Income Abroad Than It Receives, a Net 28.6% of GDP
Ireland's net primary income outflow was 28.6% of GDP in 2025, second only to Luxembourg's 29.3%.
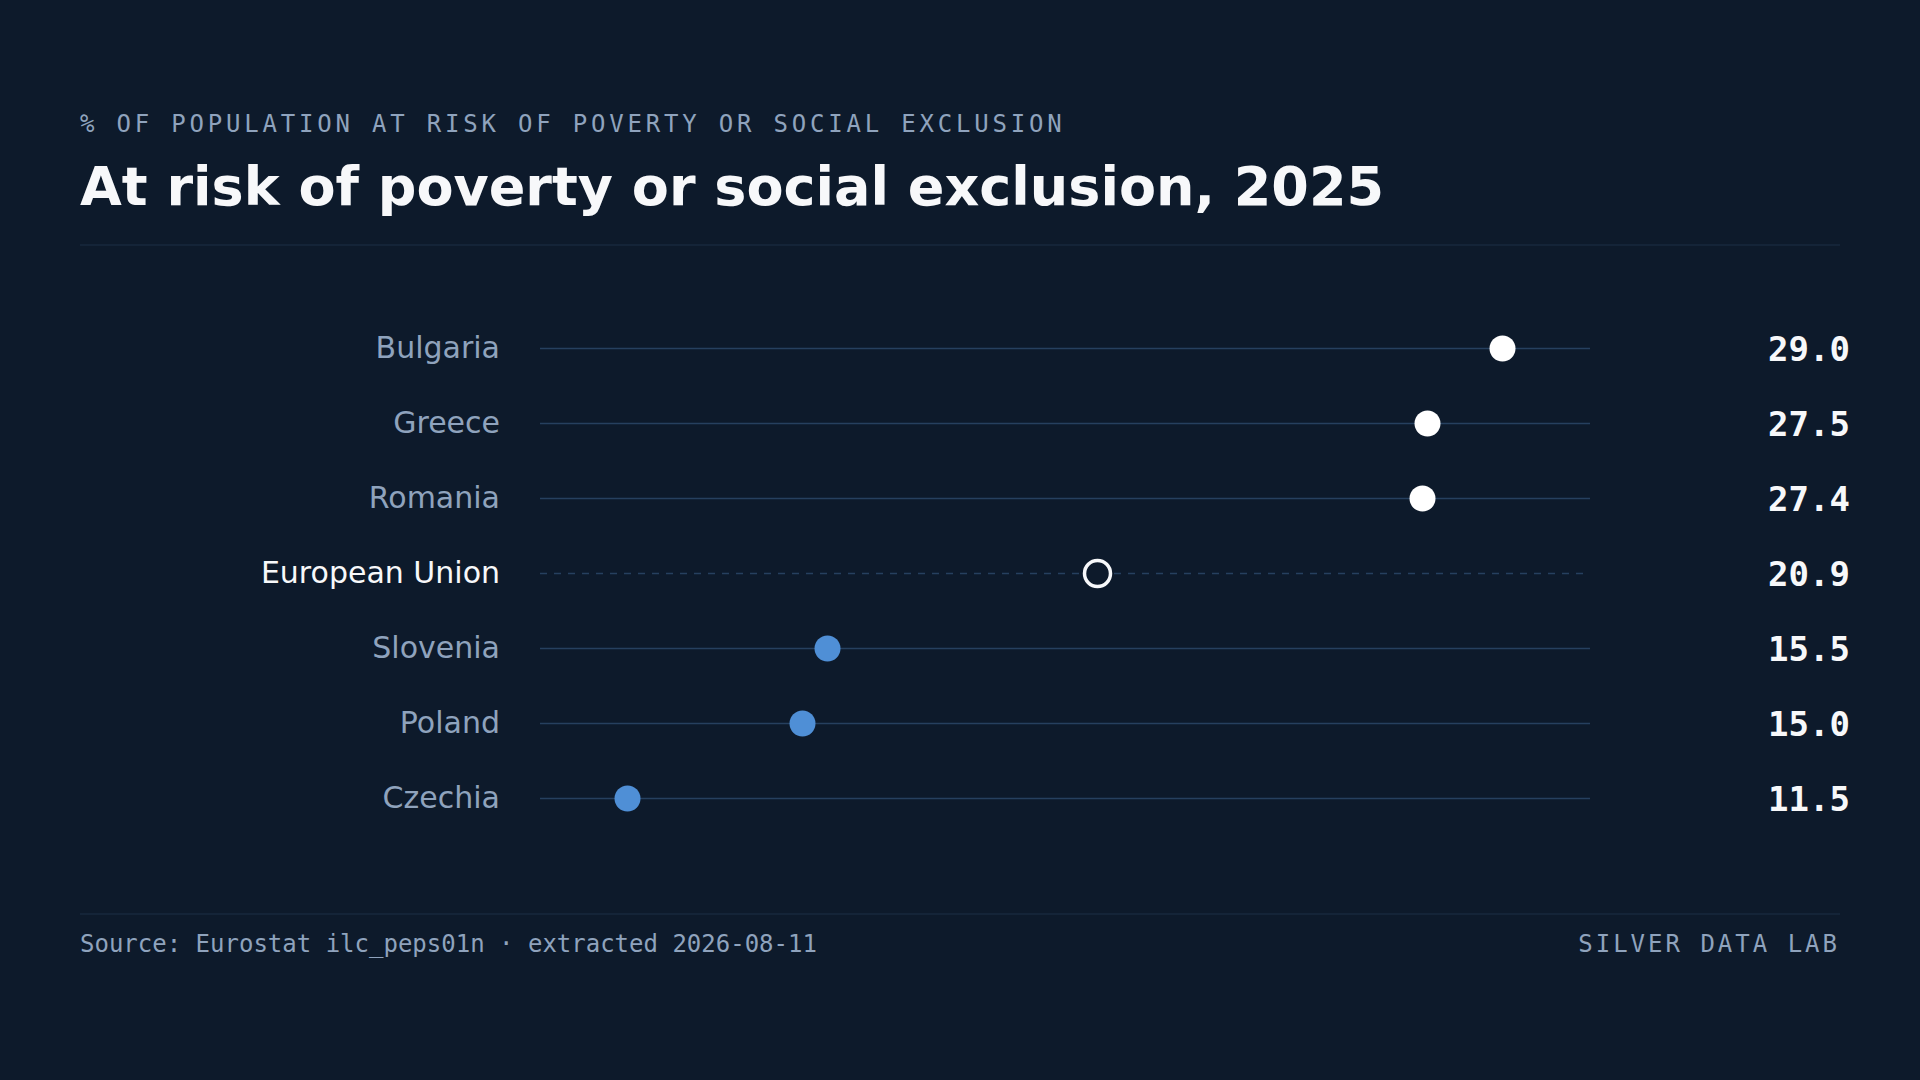
One in Five Europeans Is at Risk of Poverty or Exclusion
20.9% of the EU population was at risk of poverty or social exclusion in 2025 — roughly one person in five.