Ireland Pays Out More Income Abroad Than It Receives, a Net 28.6% of GDP
Silver Data Lab Research Desk · Statistical analysis · Published on 11 July 2026
- Data source
- Eurostat
- Reference period
- 2025
- Last updated
- 18 October 2026
Re-checked against the source on 23 October 2026. 119 values in its datasets moved between snapshots, 13 of them figures stated on this page. Every revision we have observed →
Key estimates
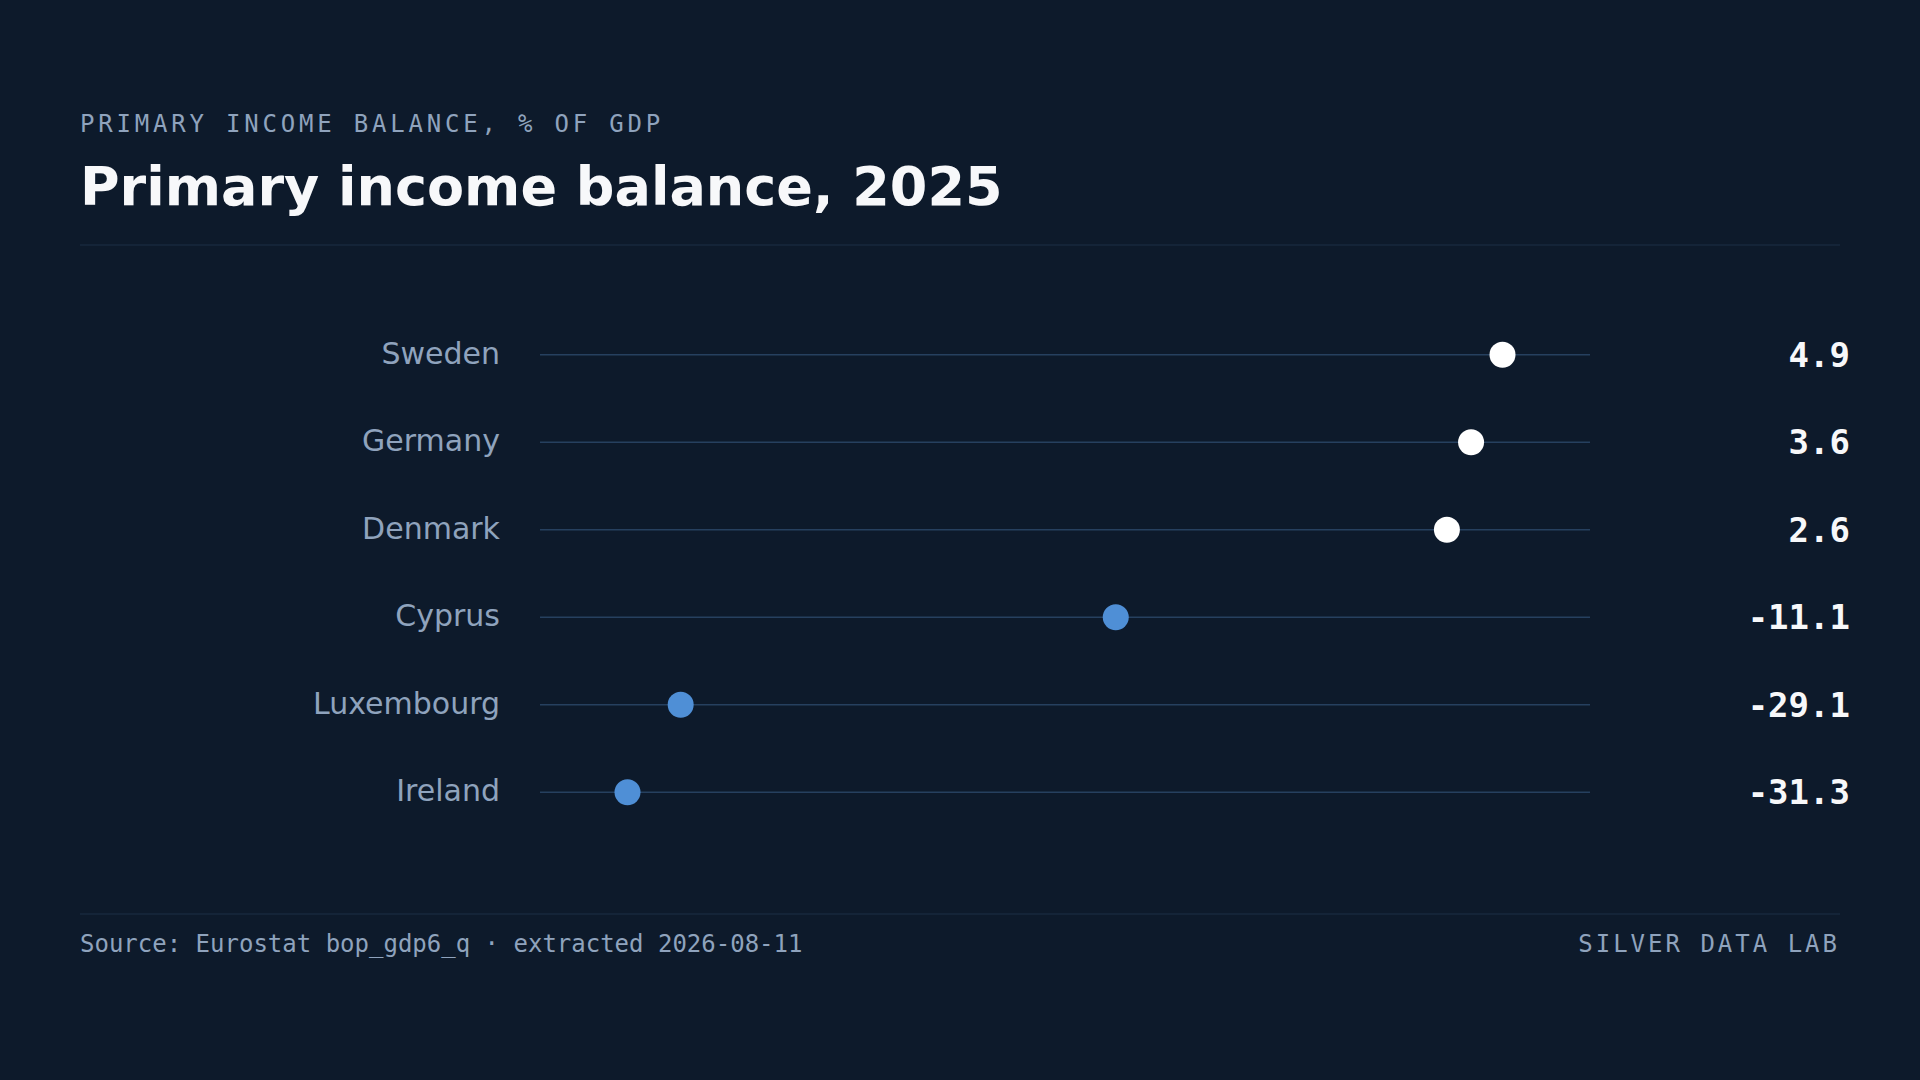
- Ireland's net primary income outflow was 28.6% of GDP in 2025, second only to Luxembourg's 29.3%.
- Luxembourg records -29.3%, Cyprus -15.0% and Malta -11.7%.
- Sweden records +4.8%, Germany +3.5% and Denmark +2.5%.
- Eighteen Member States pay out more primary income than they receive, eight receive more than they pay, and Italy's balance is exactly zero.
- This is the single figure that explains why Irish GDP overstates Irish incomes.
The difference between producing and receiving
Gross domestic product measures what is produced inside a country. Gross national income measures what its residents actually receive. The primary income balance is the bridge between them: profits, dividends, interest and wages flowing in, minus the same flowing out.
A negative balance means output produced in a country accrues to owners somewhere else.
Ireland
Ireland records -28.6% of GDP. On the net balance, close to three tenths of everything produced in Ireland accrues to owners abroad; the series publishes the difference between what flows out and what flows in, not the outflow alone. Only Luxembourg, at -29.3%, is higher, and the two have swapped places on this measure with the latest revision.
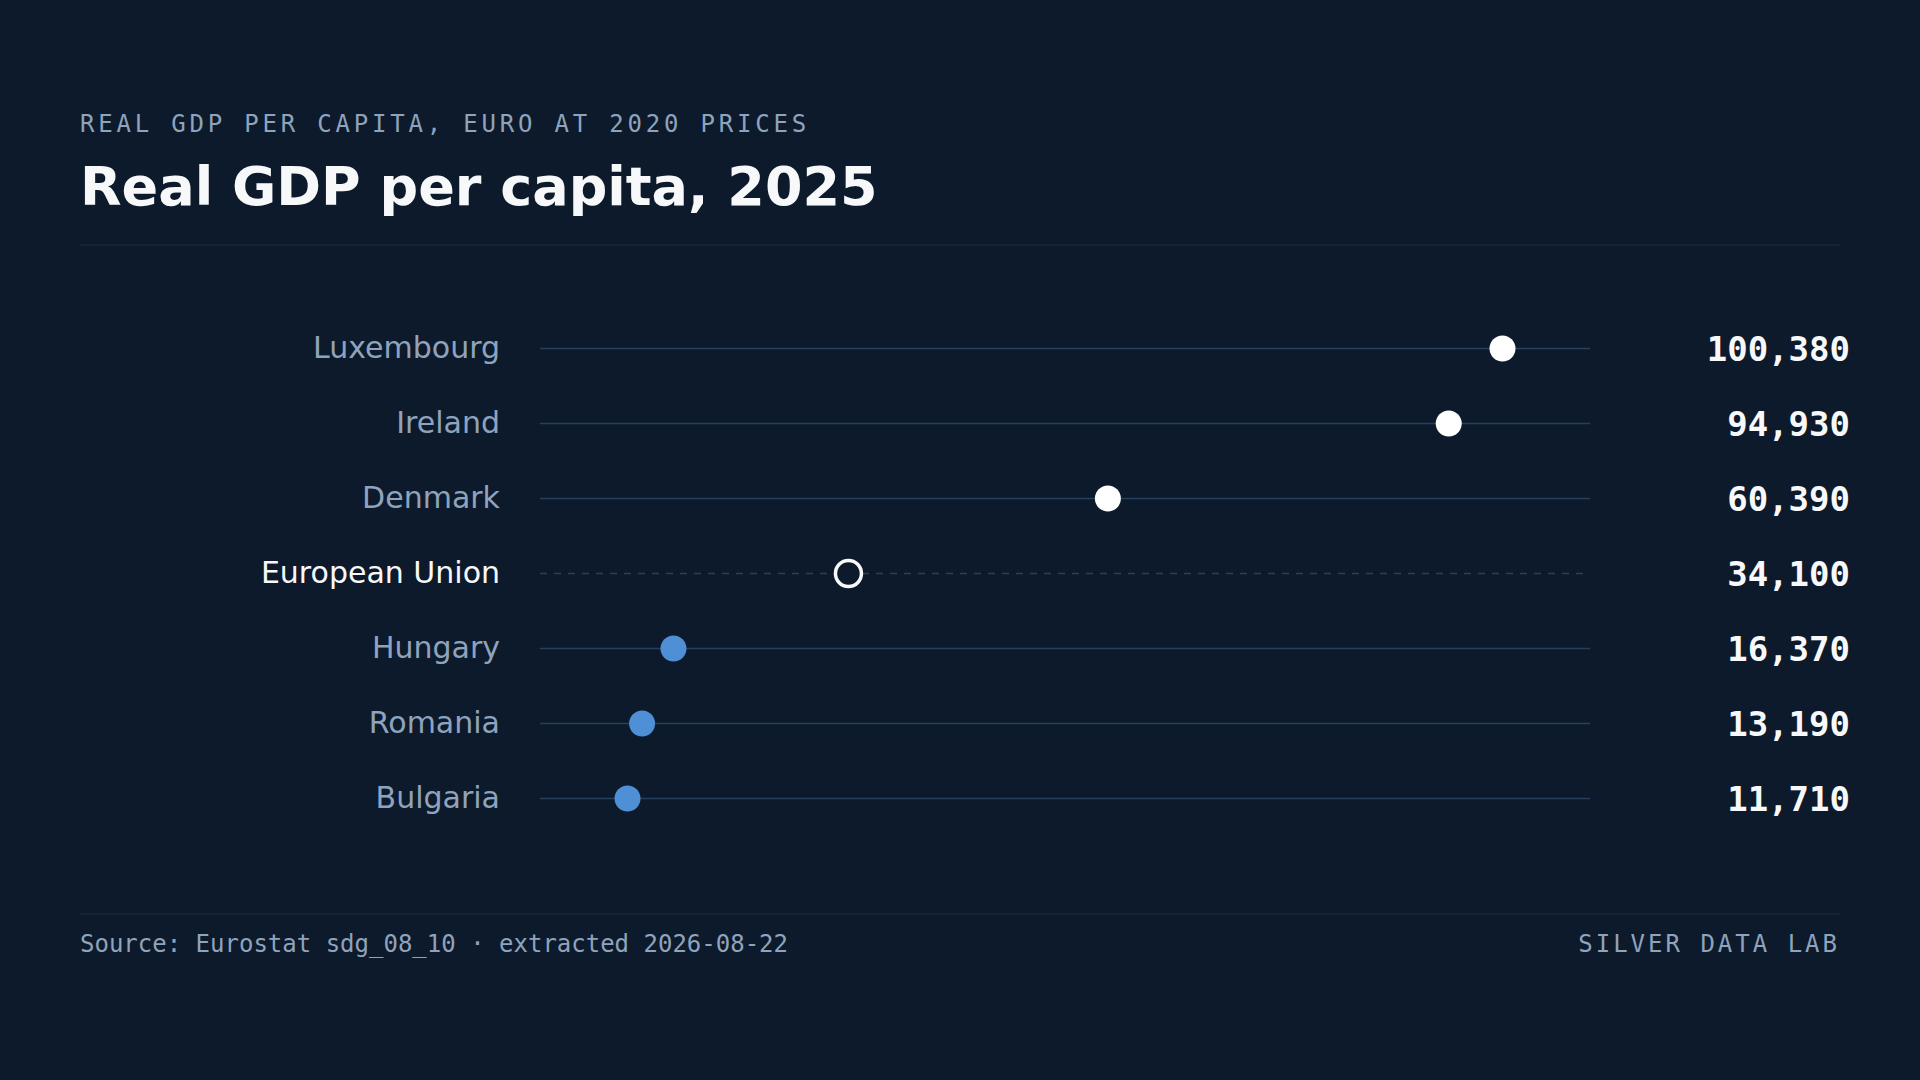
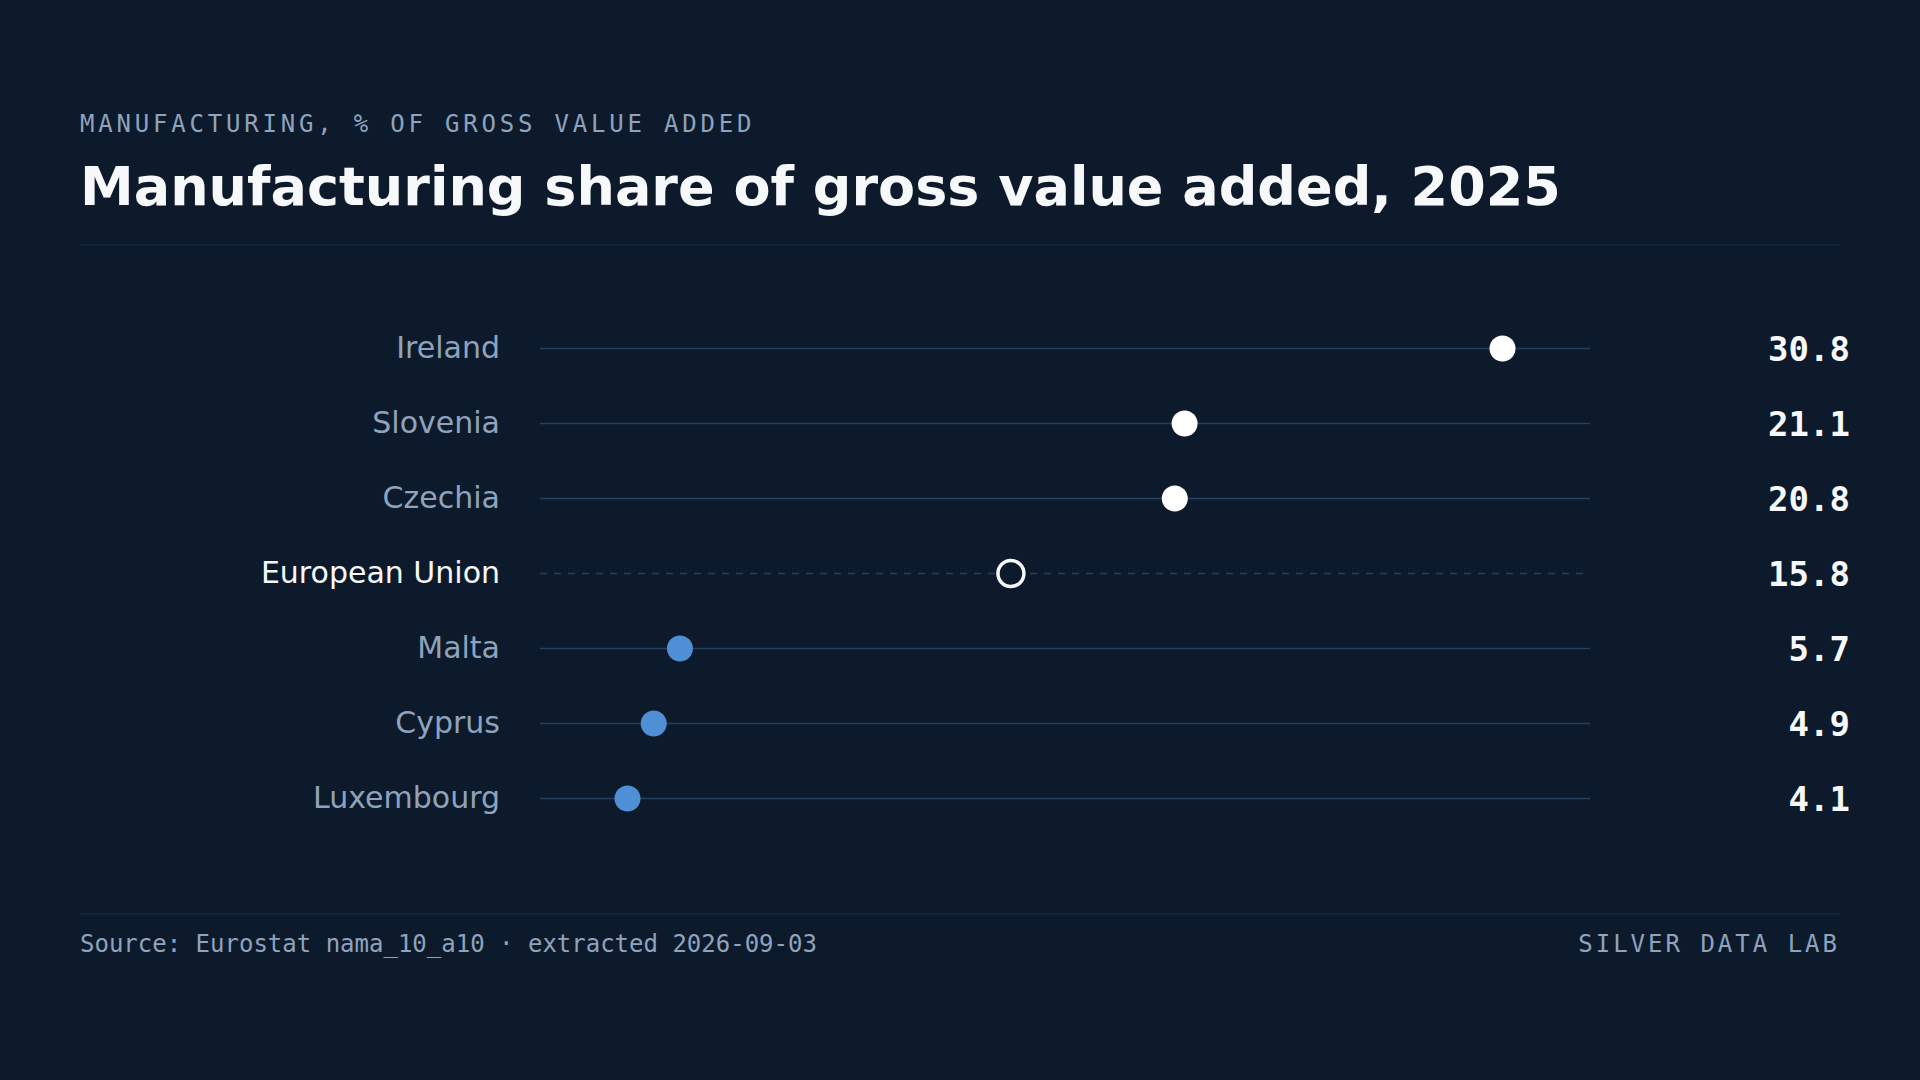
This is the mechanism behind an observation that recurs across this site. Irish real GDP per capita is the second-highest in the Union at 94,930 euro, measured at 2020 prices. Irish manufacturing is 30.8% of value added, the highest in the Union. Irish regions held first and third place in the European regional GDP ranking in 2023.
Every one of those figures is inflated by the output of foreign-owned firms, and this indicator measures the size of the inflation directly. Irish national income is very substantially lower than Irish domestic product, and the difference is 28.6 percentage points of GDP.
Where other studies on this site flag the Irish distortion as a caveat, this one quantifies it.
Luxembourg, Cyprus and Malta
Luxembourg records -29.3%, Cyprus -15.0% and Malta -11.7%.
All three host financial and corporate structures large relative to their domestic economies, and the income generated by those structures is paid out to non-residents. It does not follow that the three look alike on every measure: Luxembourg has the Union's highest GDP per capita, while Cyprus and Malta both sit close to the middle of the Union on it.
The recipients
Sweden records +4.8%, Germany +3.5%, Denmark +2.5% and France +1.7%.
The first three are net creditor economies: Denmark's net international investment position is 97.8% of GDP, Germany's 80.8% and Sweden's 59.7%, as the net investment position study records, and those assets pay a return that flows home. France is not one of them — its position is -29.6% of GDP — so its surplus on this measure is not the return on an accumulated creditor position, and this study does not establish what it is.
For those three, a positive primary income balance is what an accumulated creditor position looks like as an annual flow: income received for past saving rather than for current production. France shows that the reverse does not follow, and that a positive balance is not proof of such a position.
Why eighteen Member States are negative
Most EU economies are net debtors to the rest of the world, and a net debtor usually pays out more income than it receives. That is the ordinary case, and the amounts are mostly small: of the eighteen, seven are no worse than minus two per cent of GDP and fourteen stay above minus seven. Eight Member States are on the receiving side, and Italy sits on the line: its balance rounds to exactly zero, so it is counted on neither side.
What makes the extremes remarkable is scale rather than sign. A balance of -29% is not a more negative version of the ordinary case; it is a different phenomenon, produced by foreign-owned production booked in a small economy rather than by accumulated borrowing.
The two look identical in this statistic and mean entirely different things, which is why the indicator should be read alongside the net investment position rather than on its own.
Primary income balance, 2025
| Country | % of GDP |
|---|---|
| Sweden | 4.8 |
| Germany | 3.5 |
| Denmark | 2.5 |
| Cyprus | -15.0 |
| Ireland | -28.6 |
| Luxembourg | -29.3 |
This table as data: CSV · JSON
Every Member State for this indicator+
Members see every Member State for this indicator here, not only the rows the ranking prints. Become a Member
Embed this chart
Paste this code into a page. The frame carries the source and the extraction date, and links back to the study.
What these figures cannot tell you
- Two different causes, one number
- A negative balance can arise from interest on accumulated debt or from profits of foreign-owned firms operating locally. Greece and Ireland are negative for entirely different reasons, and this statistic does not separate them.
- No EU aggregate is published
- Eurostat publishes no EU value for this series. Summing Member States would count intra-EU income flows on both sides, so no reference row is shown.
- Booked income need not move
- Profits attributed to foreign owners are recorded whether or not they are repatriated in the same year. Reinvested earnings appear in this balance and in the financial account simultaneously.
- Compensation of employees is included
- The balance includes cross-border wages as well as investment income. For Luxembourg, where a large share of the workforce lives abroad, that component is substantial.
Frequently asked questions
- What is the primary income balance?
- The difference between investment income and wages a country receives from abroad and what it pays out. It is the bridge between gross domestic product, which measures what is produced in a country, and gross national income, which measures what its residents receive.
- Which EU country loses the most income abroad?
- Luxembourg, at 29.3% of GDP in 2025, just ahead of Ireland at 28.6% — on the net balance, close to three tenths of everything produced in either accrues to recipients abroad. Cyprus follows at 15.0% and Malta at 11.7%.
- Why is Irish GDP misleading?
- Because a net 28.6% of Irish output accrues to foreign owners. Irish GDP per capita is second-highest in the Union, but Irish national income is very substantially lower, and this indicator measures the gap directly.
- Which EU countries receive more than they pay?
- Eight, led by Sweden at 4.8% of GDP, Germany at 3.5% and Denmark at 2.5%. Most of them are net creditor economies earning a return on foreign assets, but not all: France and Spain both run a positive primary income balance while their net international investment position is negative.
Methodological note
The primary income balance is taken from Eurostat's balance of payments statistics under BPM6, expressed as a share of GDP, unadjusted, against the rest of the world. It covers compensation of employees, investment income and other primary income.
Values are for 2025 and cover all 27 Member States. Eurostat publishes no EU aggregate for this series, so none is quoted.
The counts of Member States in surplus and deficit, the counts of small and large deficits, and the positions of Cyprus and Malta in the GDP per capita ranking are derived by Silver Data Lab. The figures quoted for GDP per capita, manufacturing share, regional GDP and net international investment positions come from the companion studies on this site and are declared as the second to fifth sources below, each with its own extraction; the regional values are for 2023 and the investment positions for the end of 2025.
Source data
This study draws on 5 datasets from Eurostat. Each can be inspected and re-downloaded from its catalogue, and the filters below are the ones applied.
Main Balance of Payments items as share of GDP (BPM6)
bop_gdp6_q
- Filters applied:
- freq=A · unit=PC_GDP · s_adj=NSA · bop_item=IN1 · stk_flow=BAL · partner=WRL_REST · time=2025
- Extracted:
- 2026-10-03
- Source last updated:
- 2026-10-02
Real GDP per capita
sdg_08_10
- Filters applied:
- freq=A · unit=CLV20_EUR_HAB · na_item=B1GQ · time=2025
- Extracted:
- 2026-10-23
- Source last updated:
- 2026-10-22
Gross value added and income by main industry (NACE Rev. 2)
nama_10_a10
- Filters applied:
- freq=A · unit=PC_TOT · na_item=B1G · nace_r2=C · time=2025
- Extracted:
- 2026-10-23
- Source last updated:
- 2026-10-22
GDP at current market prices by NUTS 2 region
nama_10r_2gdp
- Filters applied:
- freq=A · unit=PPS_EU27_2020_HAB · time=2023
- Extracted:
- 2026-08-11
- Source last updated:
- 2026-02-10
Net international investment position, % of GDP
tipsii40
- Filters applied:
- freq=Q · unit=PC_GDP · s_adj=NSA · bop_item=FA · stk_flow=N_LE · partner=WRL_REST · time=2025-Q4
- Extracted:
- 2026-10-03
- Source last updated:
- 2026-10-02
Download the data
The data the study you have just read is built on, exactly as it was downloaded and archived.
Yours as a Member.
Data downloadable by Members
How to cite
Record the vintage as well as the study: the figures on this page are the ones extracted on the dates below.
Silver Data Lab Research Desk (2026). Ireland Pays Out More Income Abroad Than It Receives, a Net 28.6% of GDP. Silver Data Lab, published 11 July 2026, last updated 18 October 2026. https://www.silverdatalab.com/studies/income-leaving-the-economy-in-the-eu
- Data: Eurostat, Main Balance of Payments items as share of GDP (BPM6) (bop_gdp6_q), filters freq=A, unit=PC_GDP, s_adj=NSA, bop_item=IN1, stk_flow=BAL, partner=WRL_REST, time=2025; extracted 2026-10-03; source last updated 2026-10-02. https://doi.org/10.2908/bop_gdp6_q
- Data: Eurostat, Real GDP per capita (sdg_08_10), filters freq=A, unit=CLV20_EUR_HAB, na_item=B1GQ, time=2025; extracted 2026-10-23; source last updated 2026-10-22. https://doi.org/10.2908/sdg_08_10
- Data: Eurostat, Gross value added and income by main industry (NACE Rev. 2) (nama_10_a10), filters freq=A, unit=PC_TOT, na_item=B1G, nace_r2=C, time=2025; extracted 2026-10-23; source last updated 2026-10-22. https://doi.org/10.2908/nama_10_a10
- Data: Eurostat, GDP at current market prices by NUTS 2 region (nama_10r_2gdp), filters freq=A, unit=PPS_EU27_2020_HAB, time=2023; extracted 2026-08-11; source last updated 2026-02-10. https://doi.org/10.2908/nama_10r_2gdp
- Data: Eurostat, Net international investment position, % of GDP (tipsii40), filters freq=Q, unit=PC_GDP, s_adj=NSA, bop_item=FA, stk_flow=N_LE, partner=WRL_REST, time=2025-Q4; extracted 2026-10-03; source last updated 2026-10-02. https://doi.org/10.2908/tipsii40
Silver Data Lab's analysis is licensed CC BY 4.0. The statistics remain their publisher's and keep its terms of reuse.
Ask the research desk
A question about this study — a definition, a filter, a break in the series, what the figures can and cannot support — answered by the desk that made the extraction.
Members can write to the research desk
Other studies on the same dataset
Bulgaria's GDP per Person Is About a Third of the EU Average
EU real GDP per capita was 34,250 euro in 2025, at 2020 prices.
Denmark Has the EU's Biggest Surplus With the World, at 12.3% of GDP
Denmark ran a current account surplus worth 12.3% of GDP in 2025, the largest in the Union.
Manufacturing Is a Smaller Part of France's Economy Than of Bulgaria's
Manufacturing accounted for 15.8% of gross value added in the EU in 2025.
Studies where the same country leads or trails
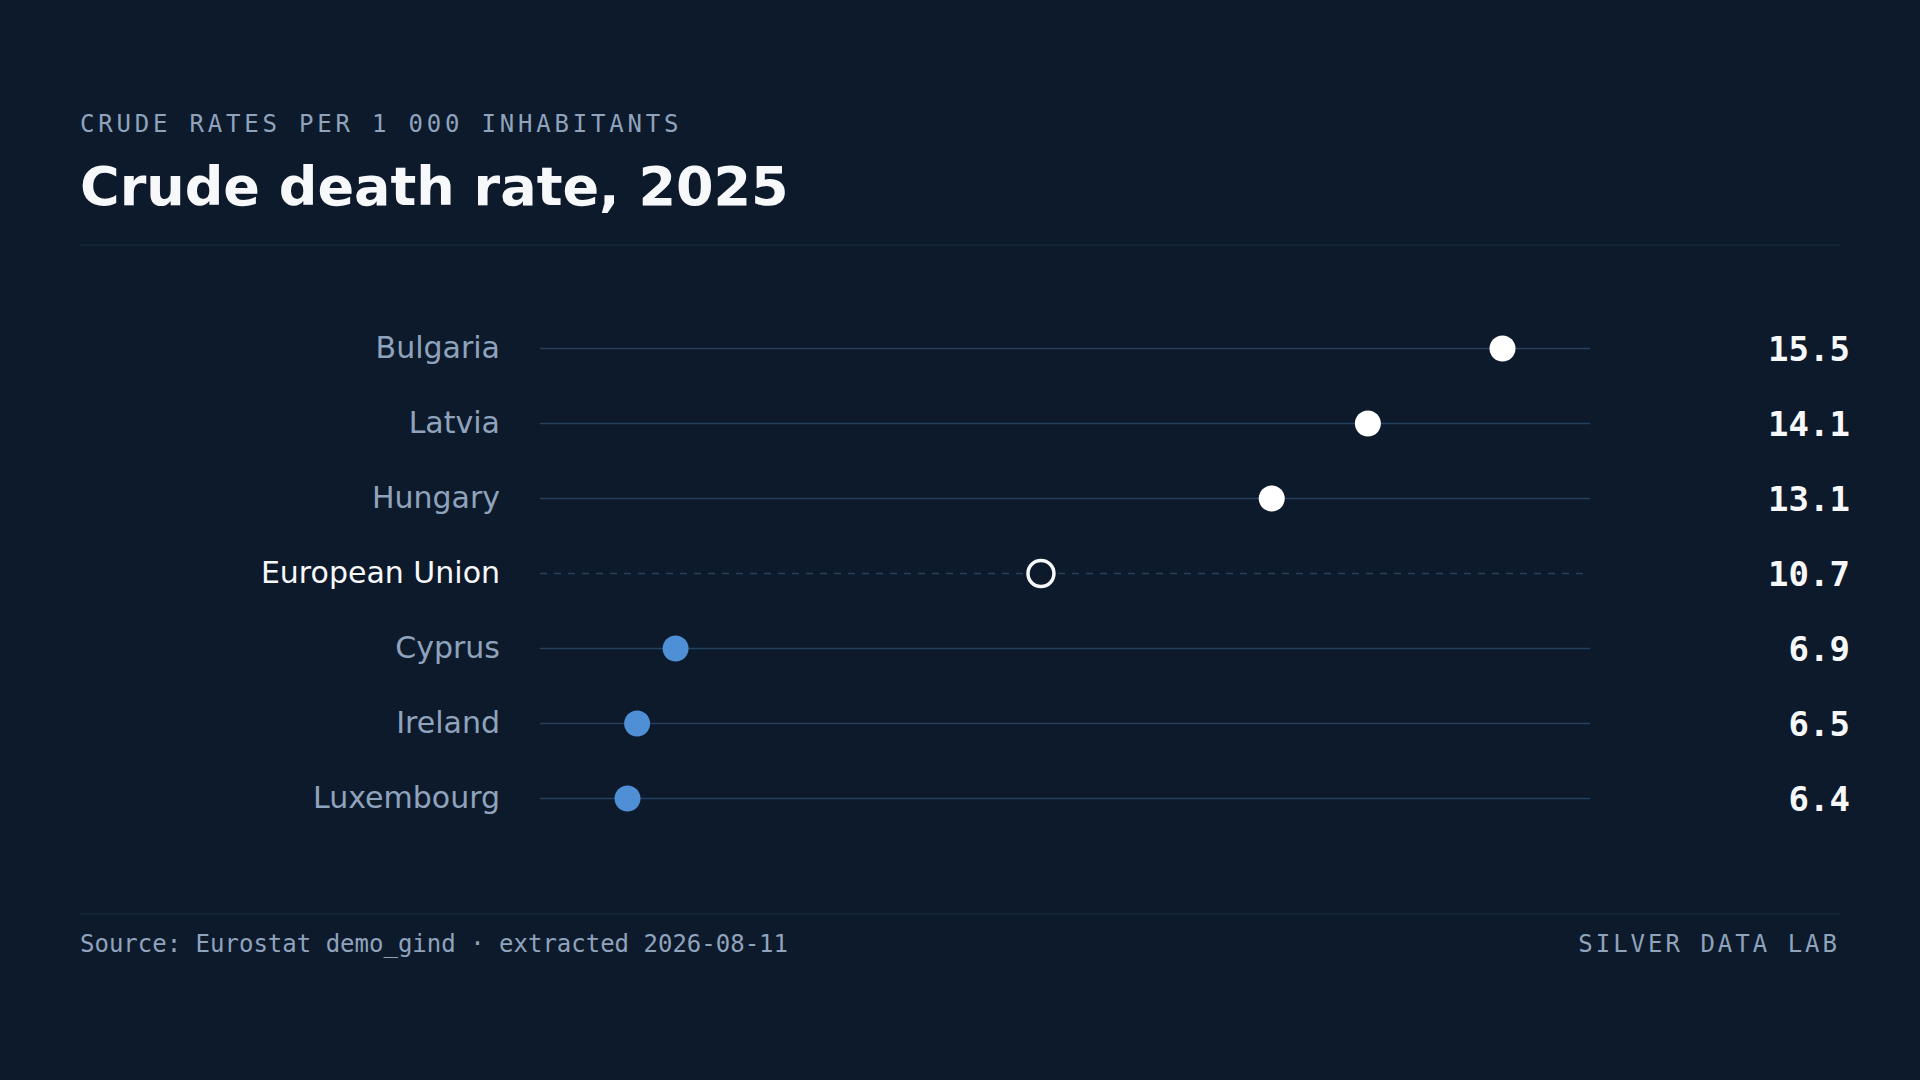
Deaths Outnumber Births in Twenty-One EU Countries
The EU recorded 7.7 births and 10.7 deaths per thousand inhabitants in 2025: a natural change of −3.0.
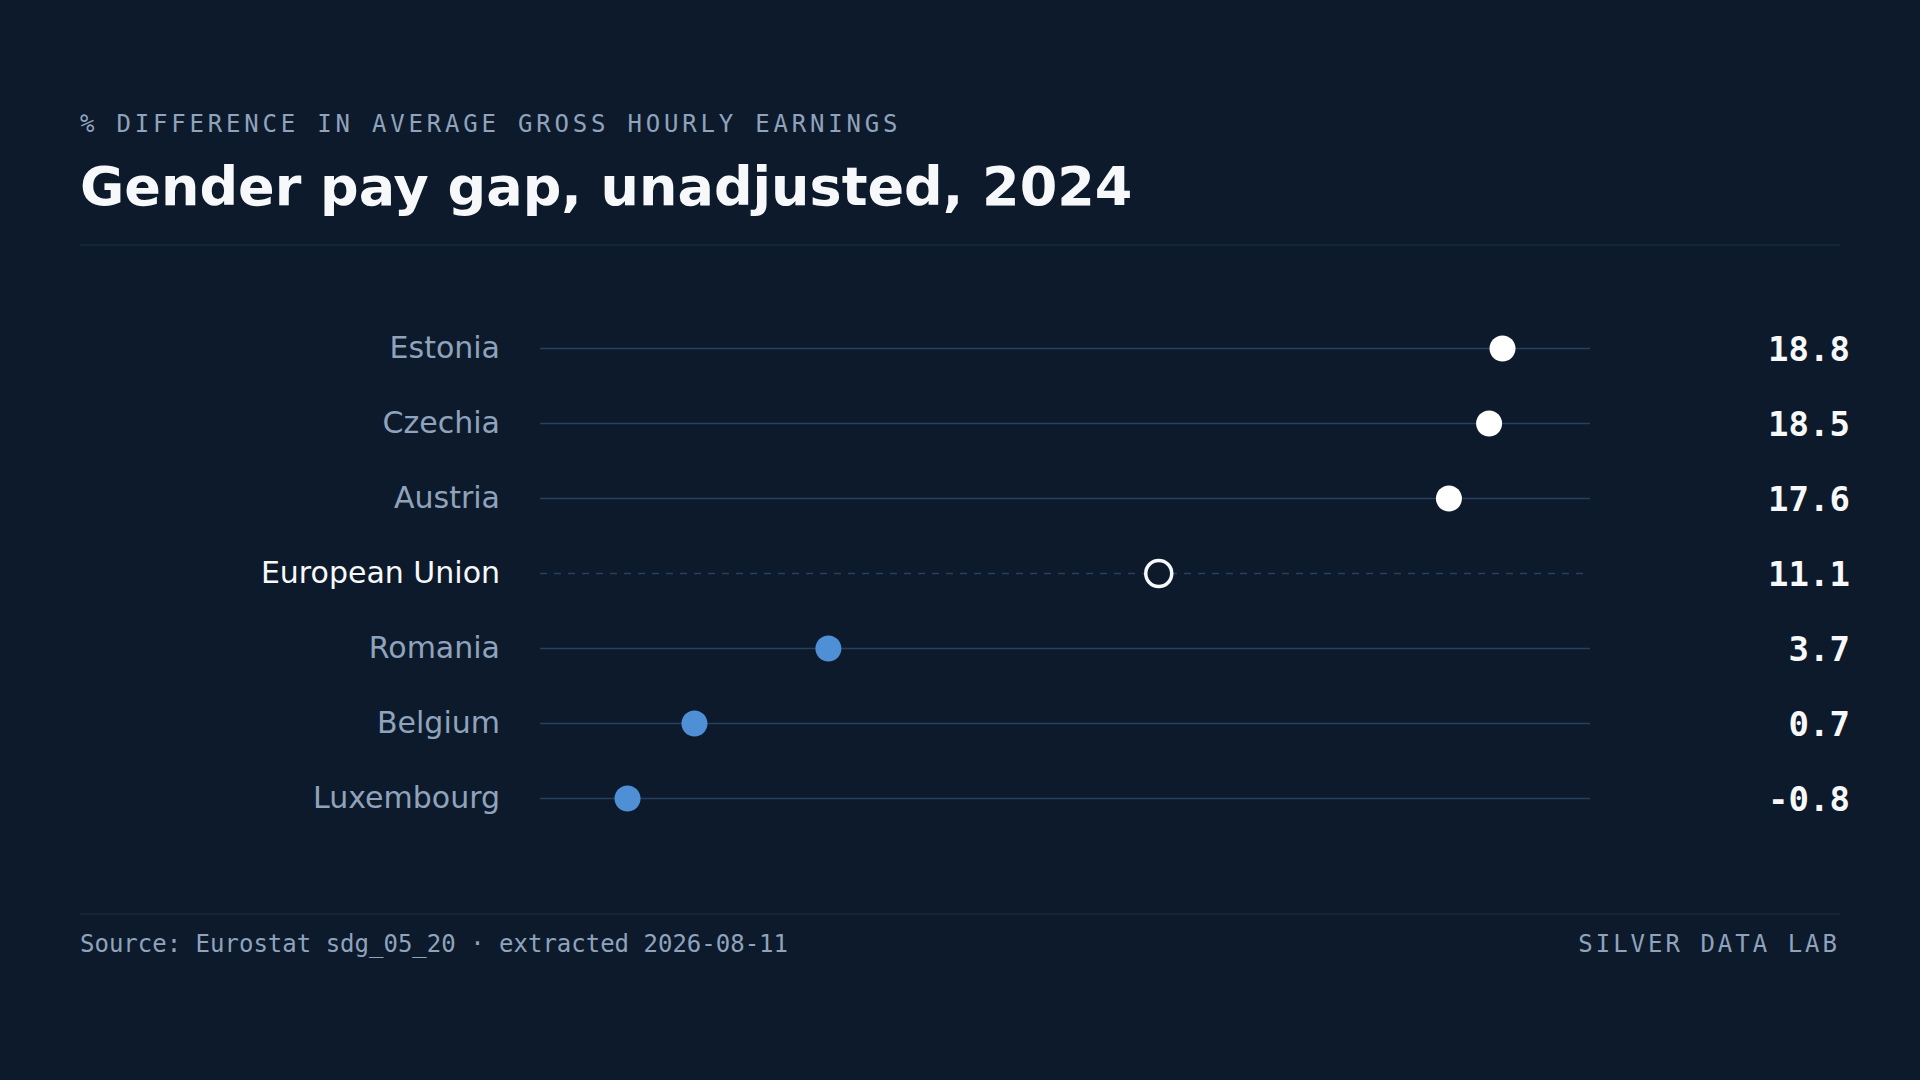
In Luxembourg, Women Are Paid More Than Men
Women in the EU earned 11.1% less per hour than men in 2024, before any adjustment for occupation or hours.
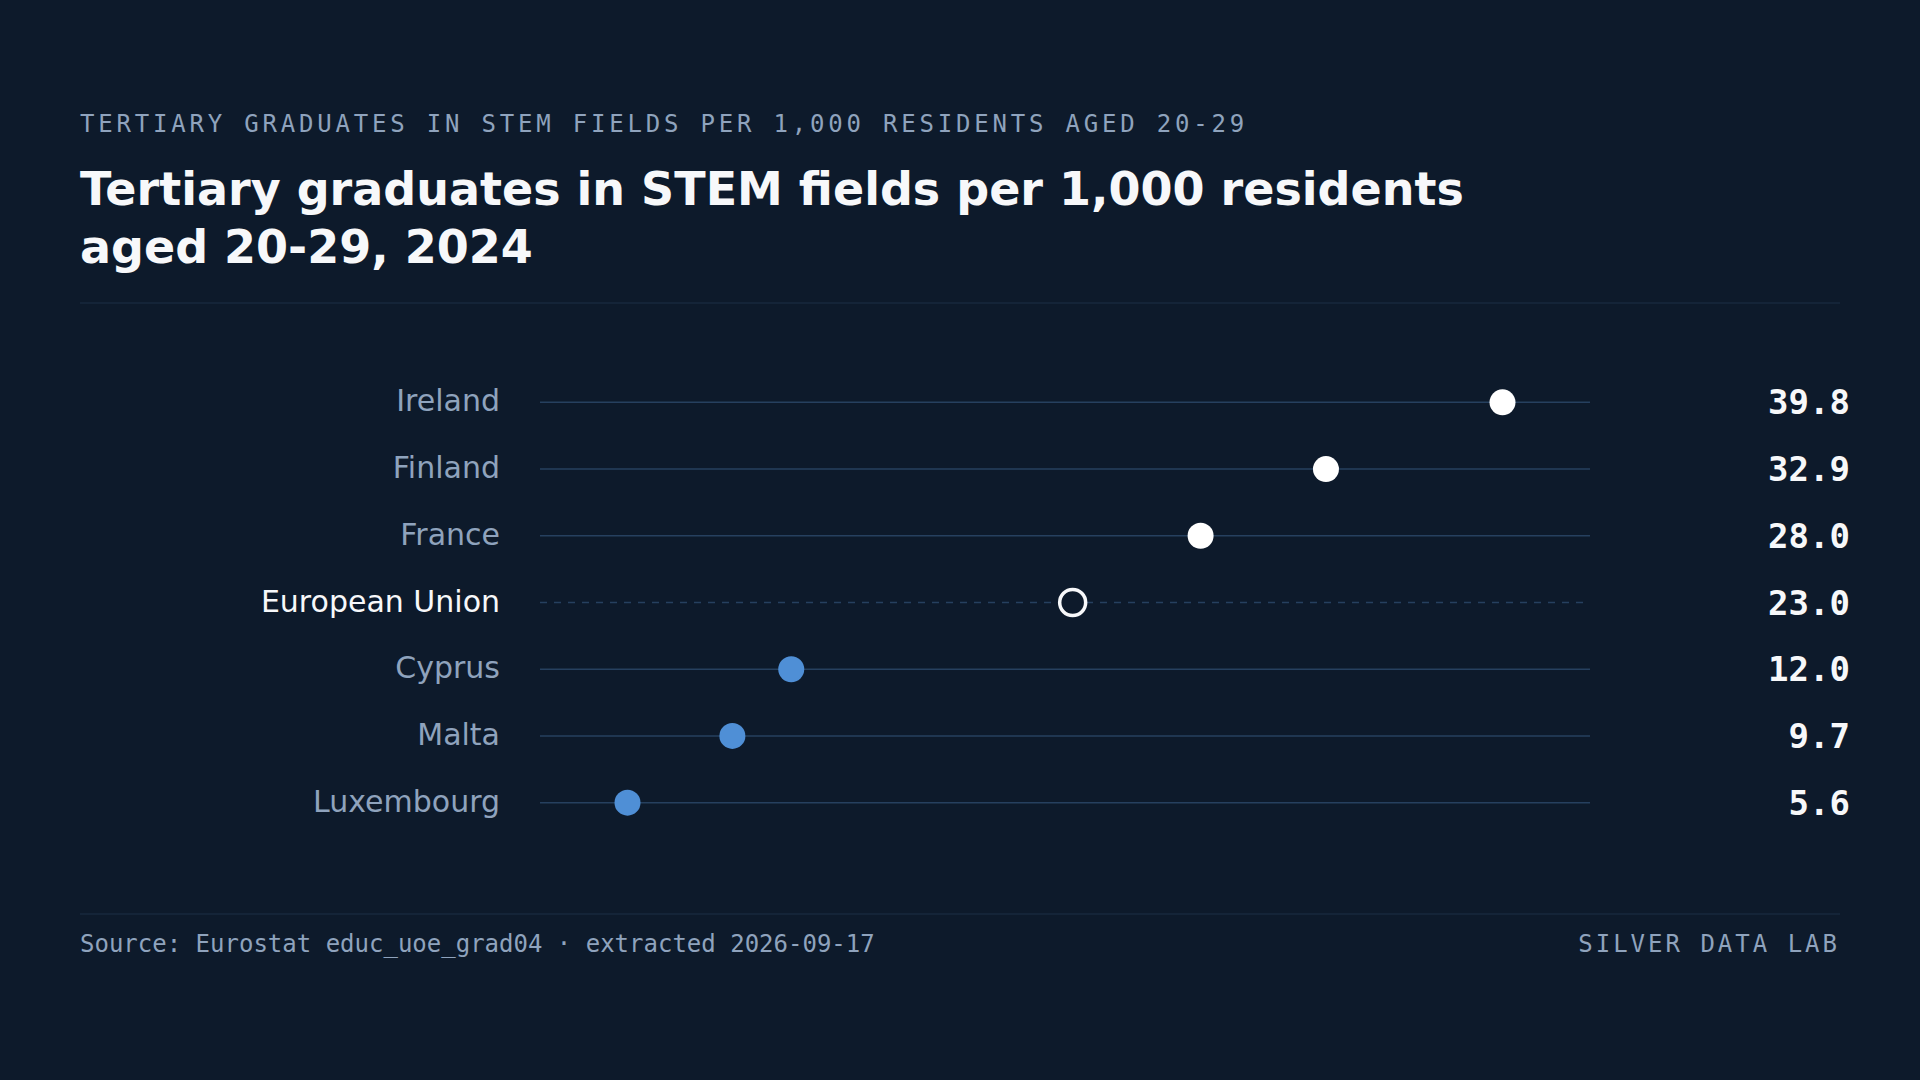
In No EU Country Do Women Graduate in STEM as Often as Men
In 2024 the EU produced 23.0 tertiary graduates in science, mathematics, computing, engineering, manufacturing and construction for every 1,000 residents aged 20 to 29.