Greece's Public and Private Sectors Owe Foreigners a Net 116.6% of GDP
Silver Data Lab Research Desk · Statistical analysis · Published on 11 July 2026
This study is open to members only
Its sources, filters and extraction date are declared above, as they are for every study. Sign in to read the analysis in full.
- Data source
- Eurostat
- Reference period
- 2025
- Last updated
- 11 October 2026
Re-checked against the source on 03 October 2026. 22 values in its datasets moved between snapshots; none is a figure stated on this page. Every revision we have observed →
Key estimates
- Greek net external debt stood at 116.6% of GDP at the end of 2025, the highest in the Union.
- Finland records 63.9% and France 45.0%.
- The Netherlands is the largest net external creditor among comparable economies at -38.3%.
- Of the 24 Member States shown, fifteen are net debtors and nine net creditors.
- Luxembourg, Ireland and Malta are excluded from the chart: their figures reach -2,906% of GDP.
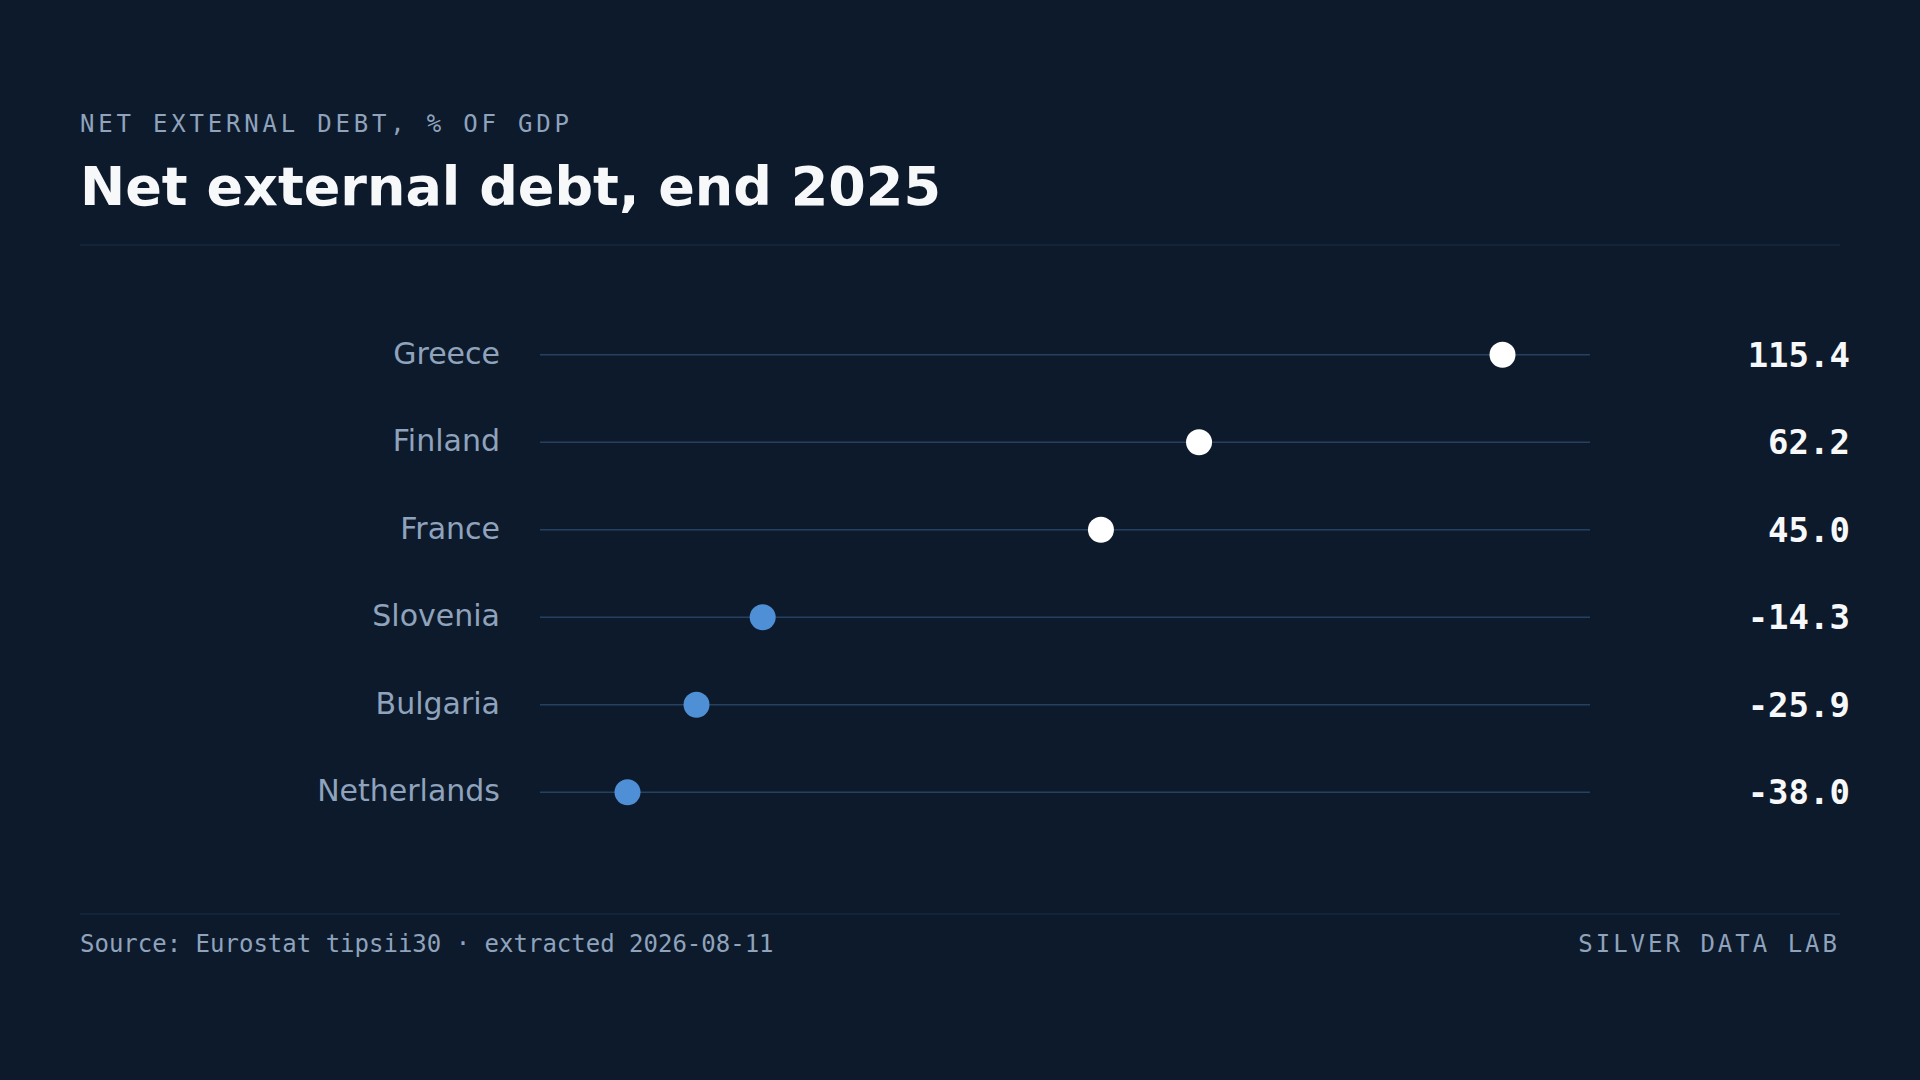
Debt owed abroad, netted against debt owed to a country
Net external debt counts debt instruments only — loans, bonds, deposits, trade credit — held by non-residents against residents, minus the same held by residents against non-residents. Equity and direct investment are excluded, which distinguishes it from the broader net international investment position.
That narrower definition is the point. Equity claims can be written down in value; debt has to be serviced on schedule regardless of what happens to the borrower.
Why three Member States are not on the chart
Luxembourg records -2,906% of GDP, Malta -841% and Ireland -384%.
These are not errors. Each hosts investment funds, holding companies and banking structures whose balance sheets are many multiples of the domestic economy, and the resulting net positions bear no relation to what residents of those countries owe or are owed.
Including them on a shared axis would compress the other twenty-four Member States into an unreadable line at one edge. They are therefore excluded from the figure and named here instead, and the ranking presented is explicitly a ranking of twenty-four.
Greece
Greece records 116.6% of GDP, the highest among the Member States shown and the only one above 100%.
The composition matters more than the level. A large share of Greek external debt is official lending from other European governments and institutions extended during the sovereign debt crisis, on maturities running for decades and at concessional rates.
That is a genuinely different obligation from market debt at commercial rates, and it is why Greece has sustained a position that would be unmanageable if it were owed to bond markets. The net investment position study on this site records the same country at -139.2% on the broader measure.
Finland and France
Finland records 63.9% and France 45.0%.
Finland's position is the one that does not fit an intuitive account. It is a high-income Nordic economy with strong institutions, and it carries the second-largest net external debt in the Union among comparable countries.
Finnish external debt has grown without a matching expansion of the domestic economy: retail volumes sit at 91.9 against a 2021 base, below where they started, while industrial production is at 101.8, barely above the same base and only just ahead of the EU's 100.4. A country that borrows abroad while its own output and consumption stand still accumulates exactly this.
The creditors
The Netherlands records -38.3%, Bulgaria -26.9% and Slovenia -14.9%.
The Dutch position follows from decades of current account surpluses, and Bulgaria's from a long period of external caution combined with EU transfers that do not create debt.
Nine of the twenty-four Member States shown are net external creditors, which is a higher proportion than the popular framing of European indebtedness would suggest.
Net external debt, end 2025
| Country | % of GDP |
|---|---|
| Greece | 116.6 |
| Finland | 63.9 |
| France | 45.0 |
| Slovenia | -14.9 |
| Bulgaria | -26.9 |
| Netherlands | -38.3 |
This table as data: CSV · JSON
Every Member State for this indicator+
Members see every Member State for this indicator here, not only the rows the ranking prints. Become a Member
What these figures cannot tell you
- Three Member States are excluded from the chart
- Luxembourg, Ireland and Malta host financial structures many multiples of their domestic economies, producing figures from -384% to -2,906% of GDP. They are excluded from the figure so the remaining 24 are legible, and their values are stated in the text and the chart note.
- Composition matters more than level
- Official concessional lending and market debt at commercial rates count identically here. Greece's position is dominated by the former and would be far less sustainable if it were the latter.
- Debt instruments only
- Equity and direct investment are excluded, which is deliberate but means this is not a complete picture of a country's external position. The net international investment position study on this site covers the broader measure.
- No EU aggregate is published
- Eurostat publishes no EU value for this series, and consolidating Member States would require netting their claims on each other. No reference row is shown.
Frequently asked questions
- Which EU country has the highest net external debt?
- Greece, at 116.6% of GDP at the end of 2025 — the only Member State shown above 100%. A large share of it is official lending from European governments and institutions on concessional terms rather than market debt.
- Why are some countries left off this comparison?
- Luxembourg, Ireland and Malta host investment funds and banking structures many times larger than their domestic economies, producing net positions from -384% to -2,906% of GDP. Including them would compress every other Member State into an unreadable line, so they are named in the text instead.
- Which EU countries are net external creditors?
- Nine of the twenty-four shown, led by the Netherlands at -38.3% of GDP, Bulgaria at -26.9% and Slovenia at -14.9%.
- How does this differ from the net international investment position?
- Net external debt counts debt instruments only — loans, bonds, deposits and trade credit — while the investment position also includes equity and direct investment. Debt must be serviced on schedule; equity claims can fall in value, which is why the narrower measure is watched separately.
Methodological note
Net external debt is published by Eurostat from international investment position statistics as debt instrument liabilities to non-residents minus debt instrument assets held against them, expressed as a share of GDP.
This study uses the end-2025 position from the fourth quarter of the quarterly series, unadjusted, against the rest of the world.
All 27 Member States have published values. Three — Luxembourg, Ireland and Malta — are excluded from the ranking and the chart because their financial-sector balance sheets produce figures between -384% and -2,906% of GDP that would render the other twenty-four unreadable on a shared axis. Their values are reported in the text.
Eurostat publishes no EU aggregate for this series. The counts of net debtors and creditors are derived by Silver Data Lab from the 24 Member States shown.
The comparisons with Finnish retail volumes and industrial production draw on the companion studies on this site, each with its own declared extraction.
Source data
The underlying series can be inspected and re-downloaded from the Eurostat data browser. The filters below are the ones applied.
Net external debt, % of GDP
tipsii30
- Filters applied:
- freq=Q · unit=PC_GDP · s_adj=NSA · bop_item=FA__FNED · stk_flow=NE_LE · partner=WRL_REST · time=2025-Q4
- Extracted:
- 2026-10-03
- Source last updated:
- 2026-10-02
Download the data
The data the study you have just read is built on, exactly as it was downloaded and archived.
Yours as a Member.
Data downloadable by Members
How to cite
Record the vintage as well as the study: the figures on this page are the ones extracted on the dates below.
Silver Data Lab Research Desk (2026). Greece's Public and Private Sectors Owe Foreigners a Net 116.6% of GDP. Silver Data Lab, published 11 July 2026, last updated 11 October 2026. https://www.silverdatalab.com/studies/net-external-debt-in-the-eu
- Data: Eurostat, Net external debt, % of GDP (tipsii30), filters freq=Q, unit=PC_GDP, s_adj=NSA, bop_item=FA__FNED, stk_flow=NE_LE, partner=WRL_REST, time=2025-Q4; extracted 2026-10-03; source last updated 2026-10-02. https://doi.org/10.2908/tipsii30
Silver Data Lab's analysis is licensed CC BY 4.0. The statistics remain their publisher's and keep its terms of reuse.
Ask the research desk
A question about this study — a definition, a filter, a break in the series, what the figures can and cannot support — answered by the desk that made the extraction.
Members can write to the research desk
Studies where the same country leads or trails
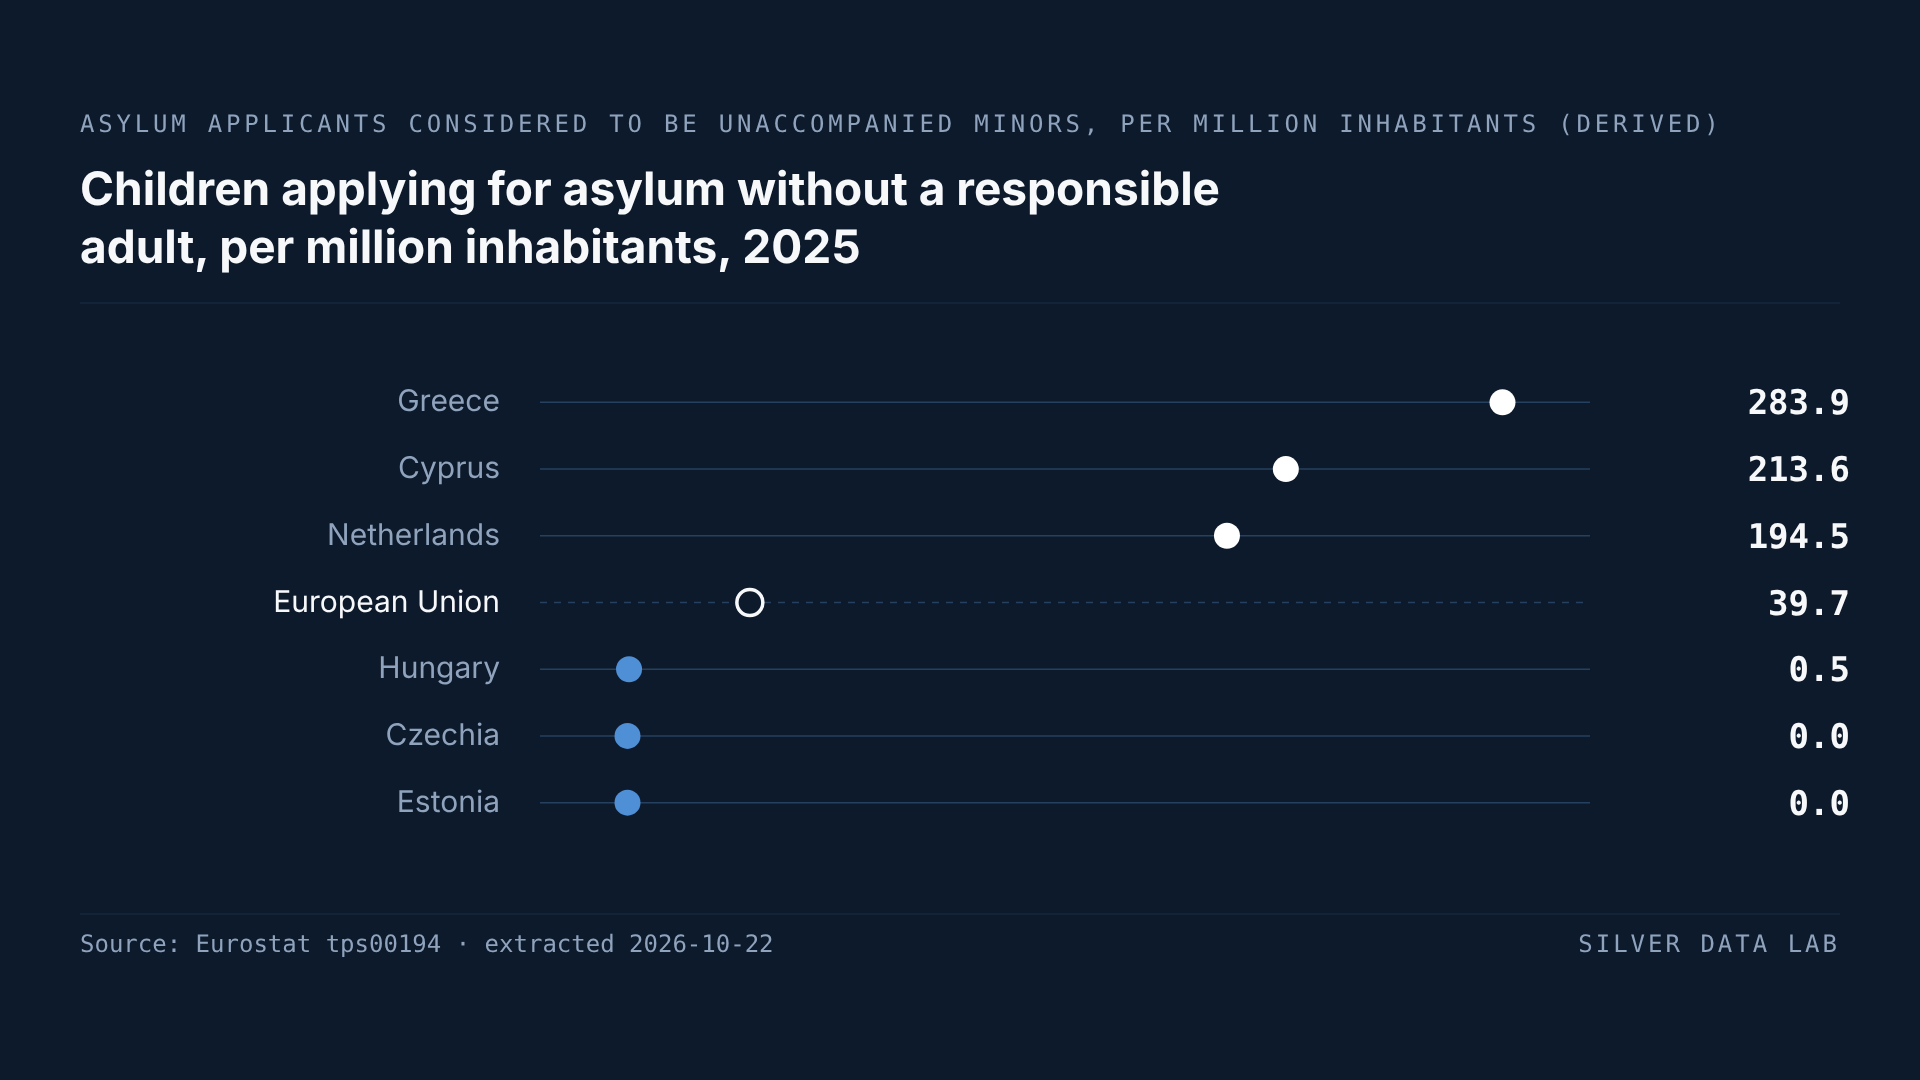
45.9% Fewer Children Sought Asylum Alone in the EU Than a Year Earlier
In 2025, 17,930 children applied for asylum in the EU without a parent or another adult responsible for them, against 33,160 in 2024: a derived fall of 45.9%, to the lowest figure since 2020.
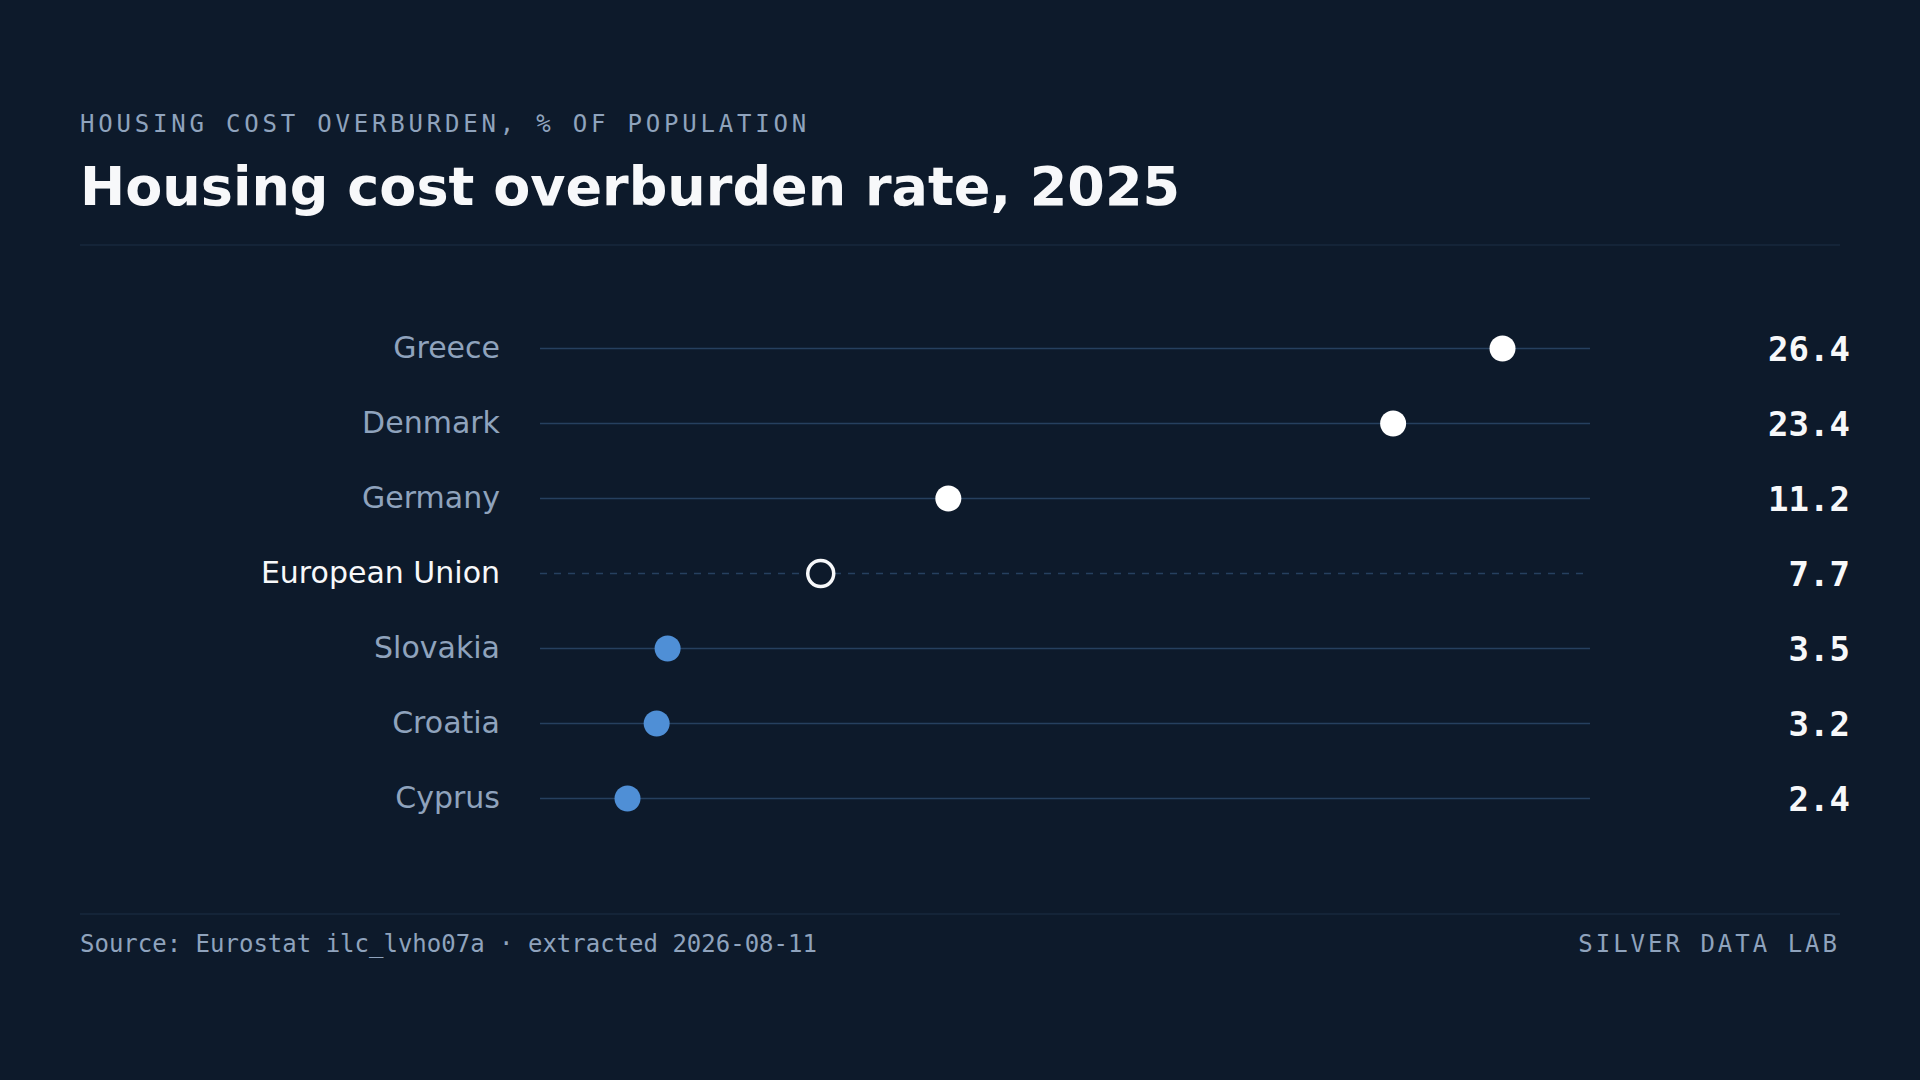
A Quarter of Greeks Spend More Than 40% of Income on Housing
7.7% of the EU population spent more than 40% of disposable income on housing in 2025.
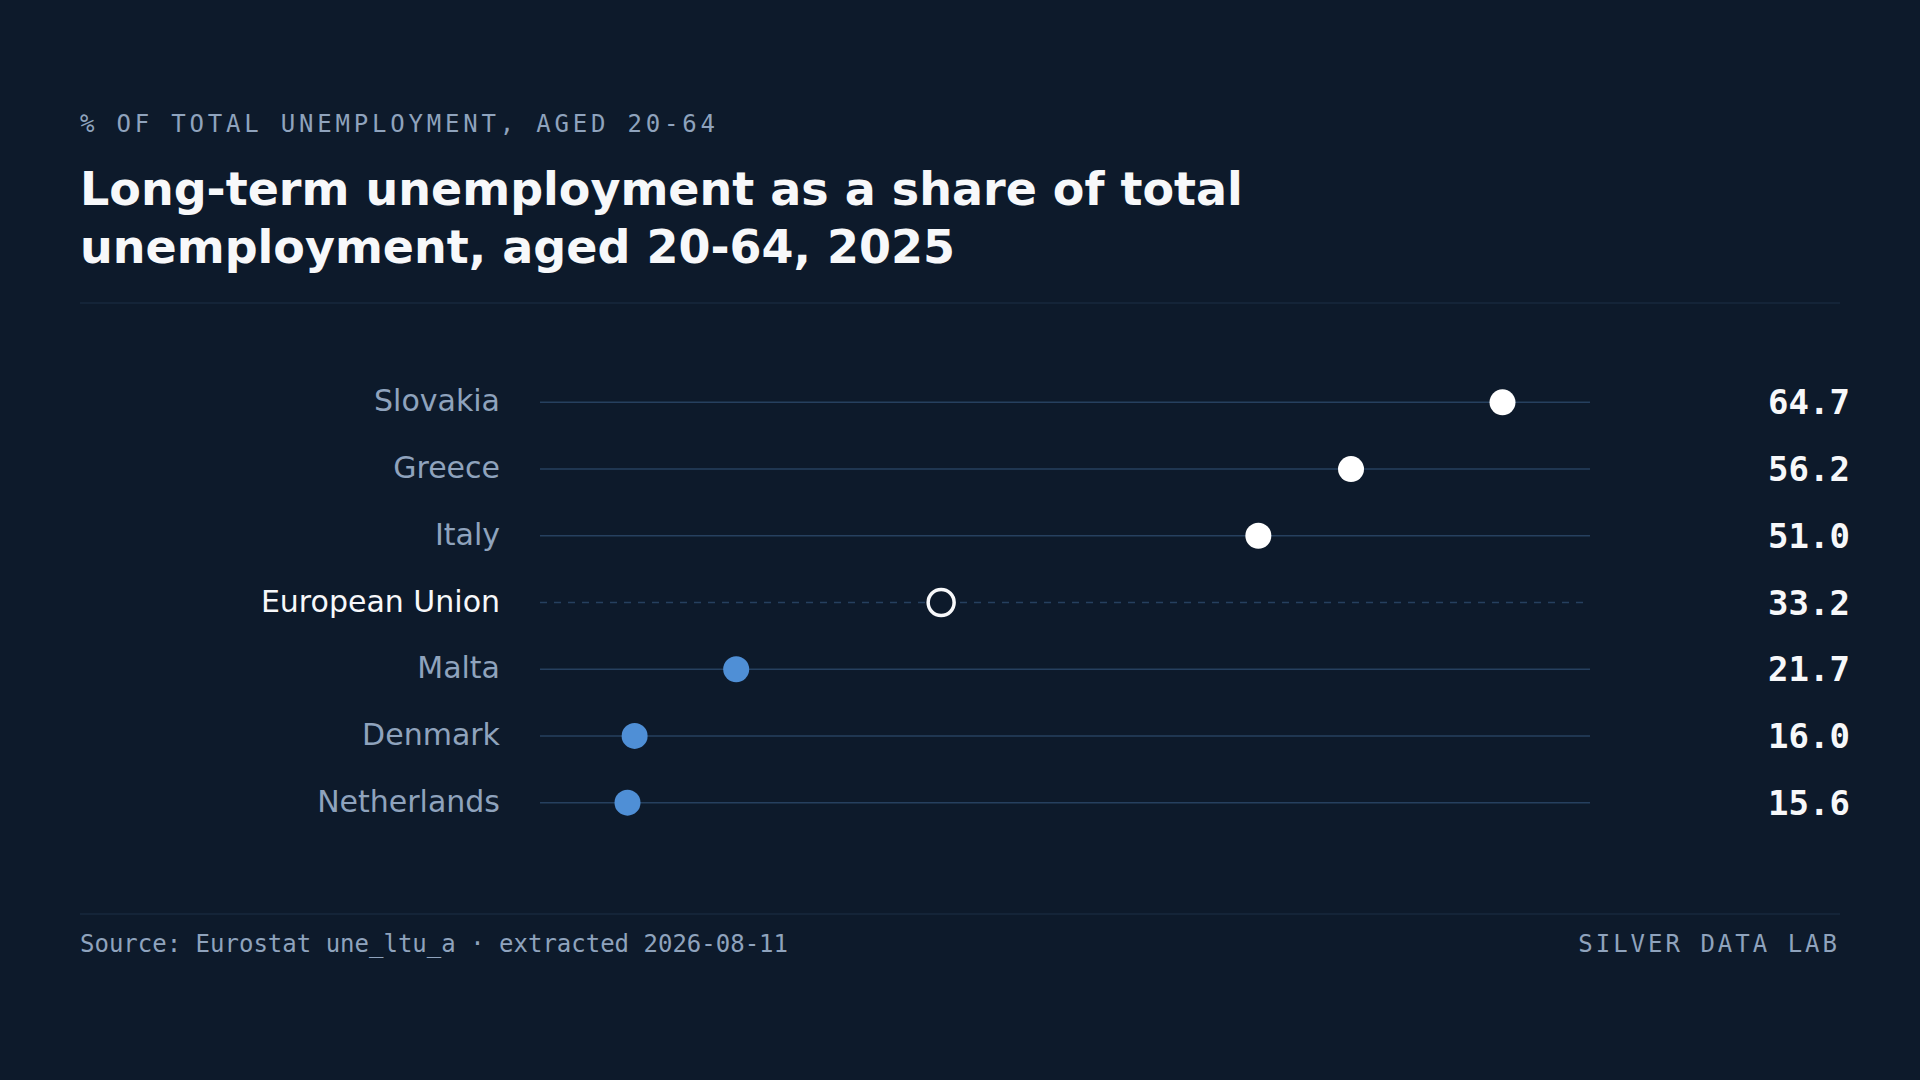
A Third of the EU's Unemployed Have Been Out of Work for a Year or More
33.2% of unemployed people aged 20 to 64 in the EU had been out of work for twelve months or more in 2025 — 4.0 million people.