Sweden Spends More on Research Than Romania Mainly Because Its Companies Do
Silver Data Lab Research Desk · Statistical analysis · Published on 21 March 2026
- Data source
- Eurostat
- Reference period
- 2024
- Last updated
- 11 October 2026
Re-checked against the source on 30 September 2026. 208 values in its datasets moved between snapshots, 13 of them figures stated on this page. Every revision we have observed →
Key estimates
- The EU spent 2.3% of GDP on research and development in 2024, against the 3% target it has set itself.
- Six Member States reach 3% or more: Sweden at 3.5%, Austria 3.3%, Belgium 3.3%, Finland 3.2%, Denmark 3.1% and Germany 3.1%.
- Romania spends 0.5% of GDP and Malta 0.6% — Romania under a seventh of Sweden's share.
- Business enterprise research accounts for 1.5 points of the EU's 2.3%, and for 2.3 of the 3.1 point gap between Sweden and Romania.
- Three quarters of the distance between the Union's research leaders and its laggards is therefore research performed by business, not by the state or universities.
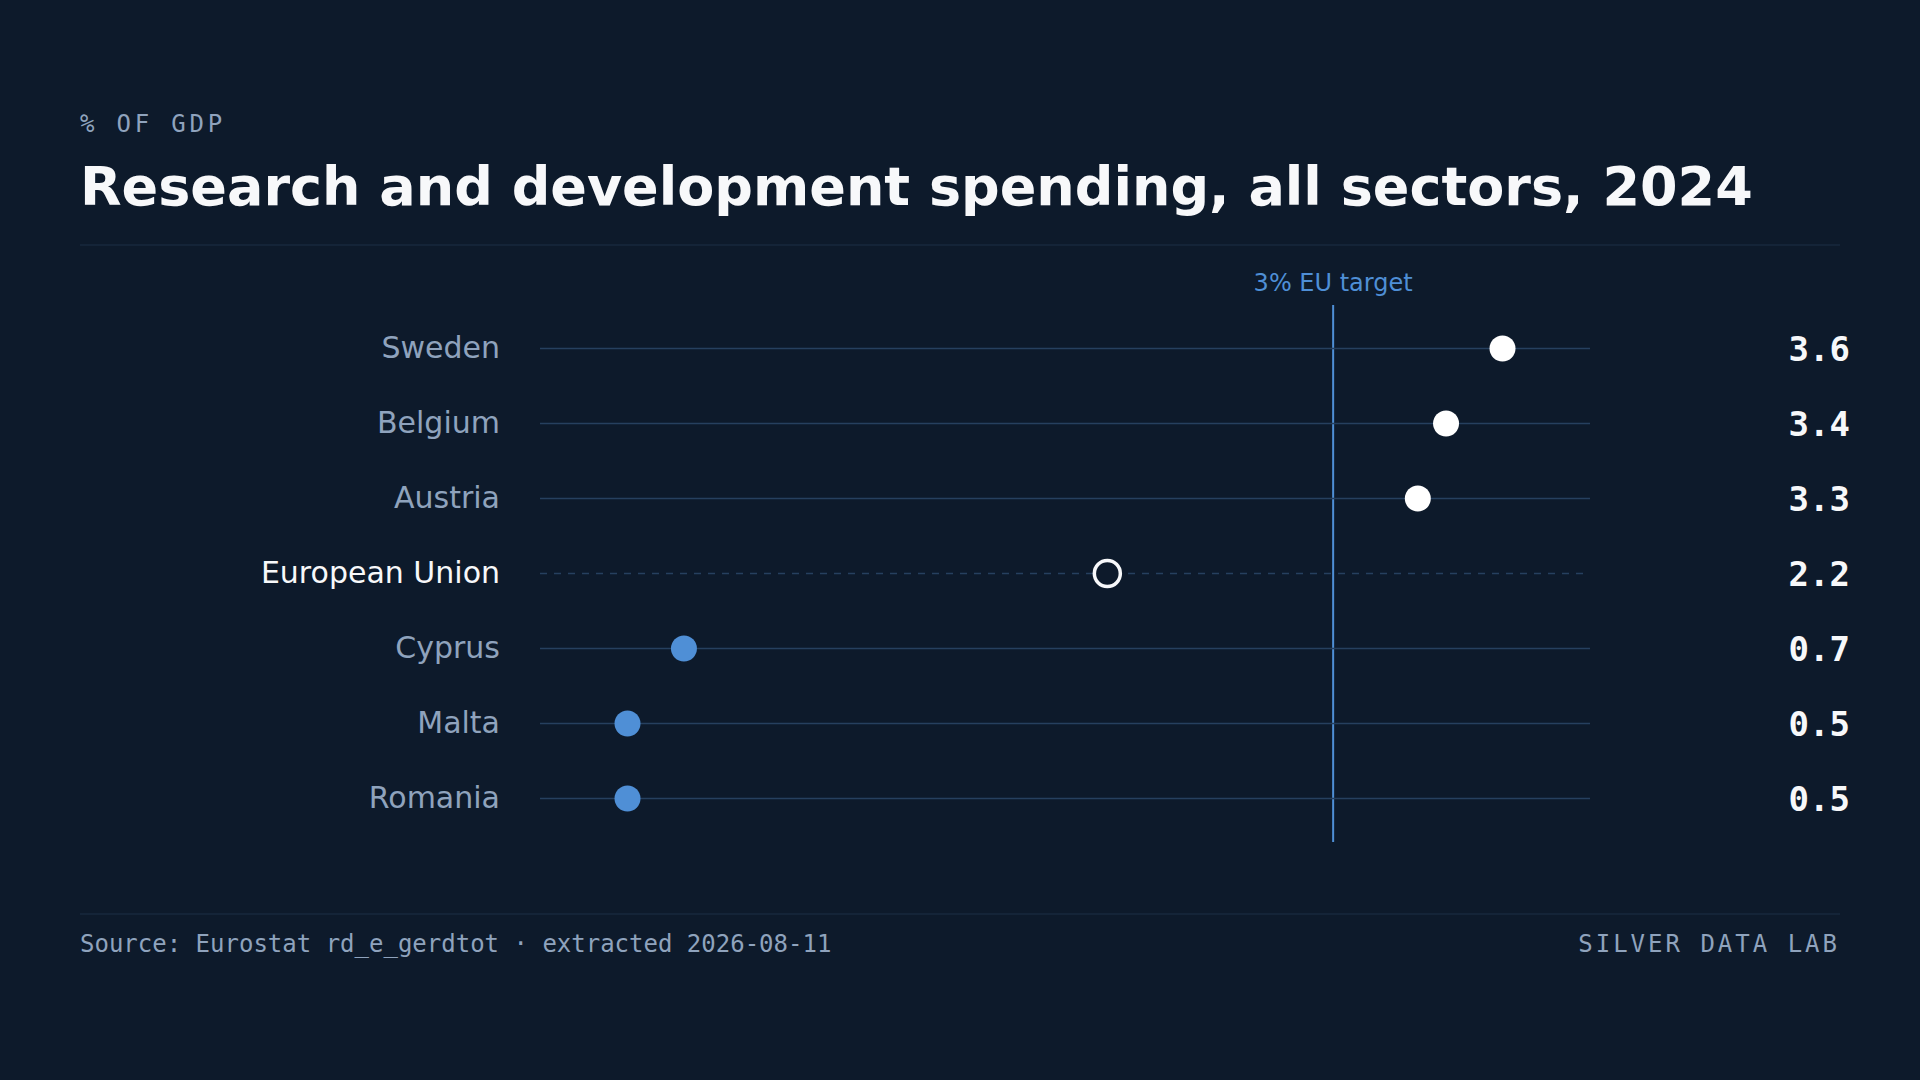
A target set in 2002 and still not met
The European Union has committed to spending 3% of GDP on research and development for more than two decades. In 2024 it spent 2.3%.
The shortfall is a familiar headline. What the same dataset shows, and what the headline omits, is where the shortfall comes from — because research spending is not one thing, and the Member States that reach the target do not reach it the same way as those that miss it fall short.
Who reaches 3%
Six Member States are at or above the target. Sweden leads at 3.5%, followed by Austria at 3.3%, Belgium at 3.3%, Finland at 3.2%, Denmark at 3.1% and Germany at 3.1%.
Below them the drop is steady rather than sharp: the Netherlands at 2.4%, France at 2.2%, Slovenia at 2.1%, Estonia at 2.0%, Czechia at 1.8%.
At the bottom, Romania spends 0.5% of GDP on research, Malta and Cyprus 0.6% each and Bulgaria 0.8%. Sweden spends close to eight times the share Romania does.
Where the gap actually sits
Research is performed by four sectors: business, government, higher education and private non-profit. Separating business research from the total changes what the ranking is about.
Business enterprise research accounts for 1.5 percentage points of the EU's 2.3%, or roughly two thirds of the total.
Between Sweden at the top and Romania at the bottom, the total gap is 3.1 percentage points. The business research gap between the same two countries is 2.3 points — Sweden 2.6%, Romania 0.3%. Three quarters of the distance between the Union's strongest and weakest research economies is private sector research.
The same pattern holds across the leading group. Every Member State above the 3% target has business research of 1.9% of GDP or more. No Member State reaches 3% on public and academic research alone, and none comes close to trying.
What that implies about the target
The 3% target is usually discussed as a public spending commitment, and public budgets are the instrument governments control directly. The composition of the gap suggests the target is not principally a public spending question.
Take each of the twenty-one Member States below the target and double the research performed outside business — government, universities and non-profits together. One of them reaches 3%: the Netherlands, which goes from 2.4% to 3.1%. The other twenty do not. The largest non-business research effort among the twenty-one is Estonia's, at 0.8 points of GDP, so the doubling is worth less than a point wherever it is applied, and every one of the twenty-one except the Netherlands starts further below the target than that. Reaching the target requires firms that do research, which is a matter of industrial structure — what a country's companies make, and whether the sectors they operate in are research-intensive — rather than of appropriations.
This study establishes the composition. It does not establish how a country acquires research-intensive firms, which is a question the data cannot answer.
Research and development spending, all sectors, 2024
| Country | % of GDP | Gap to EU averagepercentage points, derived |
|---|---|---|
| Sweden | 3.5 | +1.2 |
| Austria | 3.3e | +1.0 |
| Belgium | 3.3e | +1.0 |
| European Unionaggregate | 2.3e | — |
| Cyprus | 0.6 | −1.7 |
| Malta | 0.6 | −1.7 |
| Romania | 0.5 | −1.8 |
Flags carried by the source on these values: e estimated
This table as data: CSV · JSON
Every Member State for this indicator+
Members see every Member State for this indicator here, not only the rows the ranking prints. Become a Member
Embed this chart
Paste this code into a page. The frame carries the source and the extraction date, and links back to the study.
Research performed by business, 2024
| Country | % of GDP | Gap to EU averagepercentage points, derived |
|---|---|---|
| Sweden | 2.6 | +1.1 |
| Belgium | 2.4e | +0.9 |
| Austria | 2.3e | +0.8 |
| European Unionaggregate | 1.5e | — |
| Latvia | 0.4 | −1.1 |
| Cyprus | 0.3 | −1.2 |
| Romania | 0.3 | −1.2 |
Flags carried by the source on these values: e estimated
This table as data: CSV · JSON
Every Member State for this indicator+
Members see every Member State for this indicator here, not only the rows the ranking prints. Become a Member
Embed this chart
Paste this code into a page. The frame carries the source and the extraction date, and links back to the study.
What these figures cannot tell you
- R&D intensity is a ratio, and GDP is the denominator
- A country's research intensity can rise because research spending grew or because GDP fell. Comparisons between Member States are also comparisons of economic size and structure, not only of research effort.
- Where research is performed, not who funds it
- The sector breakdown used here is by sector of performance: it records where the research is carried out. Government funding of research performed by universities or firms appears in the performing sector, so the business figure is not the same as privately funded research.
- Multinational research can be attributed unevenly
- Research performed by multinational firms is recorded where the activity takes place, which may differ from where the resulting intellectual property is held or the value is booked. In small economies with large foreign-owned research operations, the ratio can be sensitive to a handful of firms.
- The 3% target is a Union-level commitment
- The target applies to the EU as a whole, and Member States have their own national targets which differ from it. Treating 3% as a per-country benchmark, as this study does for comparison, is a simplification of the policy framework.
Frequently asked questions
- How much does the EU spend on research and development?
- 2.3% of GDP in 2024, against a target of 3% that the Union has held for more than two decades. Business enterprises performed 1.5 points of that 2.3%.
- Which EU country spends the most on research?
- Sweden, at 3.5% of GDP in 2024, ahead of Austria and Belgium, both at 3.3%. Six Member States are at or above the 3% target: those three plus Finland, Denmark and Germany.
- Which EU country spends the least on research?
- Romania, at 0.5% of GDP in 2024, then Malta and Cyprus at 0.6% and Bulgaria at 0.8%. Sweden spends close to eight times the share Romania does.
- Is the EU research gap a public spending problem?
- Mostly not. Business research accounts for about three quarters of the distance between the Union's strongest and weakest research economies, and every Member State above the 3% target has business research of at least 1.9% of GDP. No country reaches the target on public and academic research alone.
Methodological note
Gross domestic expenditure on research and development is published by Eurostat as a percentage of GDP, broken down by sector of performance. This study uses the total across all sectors and, separately, the business enterprise sector.
Values are for 2024, the most recent year with complete coverage of the 27 Member States at the extraction date.
The share of the Sweden-Romania gap attributable to business research, the count of Member States at or above 3%, the observation that every Member State above the target has business research of at least 1.9% of GDP, and the result that doubling non-business research would carry only the Netherlands, of the twenty-one Member States below the target, to 3% are derived by Silver Data Lab from the two published series. Non-business research is the total minus the business enterprise sector, which is how the doubling is computed.
Source data
The underlying series can be inspected and re-downloaded from the Eurostat data browser. The filters below are the ones applied.
GERD by sector of performance
rd_e_gerdtot
- Filters applied:
- freq=A · sectperf=TOTAL, BES · unit=PC_GDP · time=2024
- Extracted:
- 2026-09-30
- Source last updated:
- 2026-09-29
Download the data
The data the study you have just read is built on, exactly as it was downloaded and archived.
Yours as a Member.
Data downloadable by Members
How to cite
Record the vintage as well as the study: the figures on this page are the ones extracted on the dates below.
Silver Data Lab Research Desk (2026). Sweden Spends More on Research Than Romania Mainly Because Its Companies Do. Silver Data Lab, published 21 March 2026, last updated 11 October 2026. https://www.silverdatalab.com/studies/research-and-development-spending-in-the-eu
- Data: Eurostat, GERD by sector of performance (rd_e_gerdtot), filters freq=A, sectperf=TOTAL, BES, unit=PC_GDP, time=2024; extracted 2026-09-30; source last updated 2026-09-29. https://doi.org/10.2908/rd_e_gerdtot
Silver Data Lab's analysis is licensed CC BY 4.0. The statistics remain their publisher's and keep its terms of reuse.
Ask the research desk
A question about this study — a definition, a filter, a break in the series, what the figures can and cannot support — answered by the desk that made the extraction.
Members can write to the research desk
Studies where the same country leads or trails
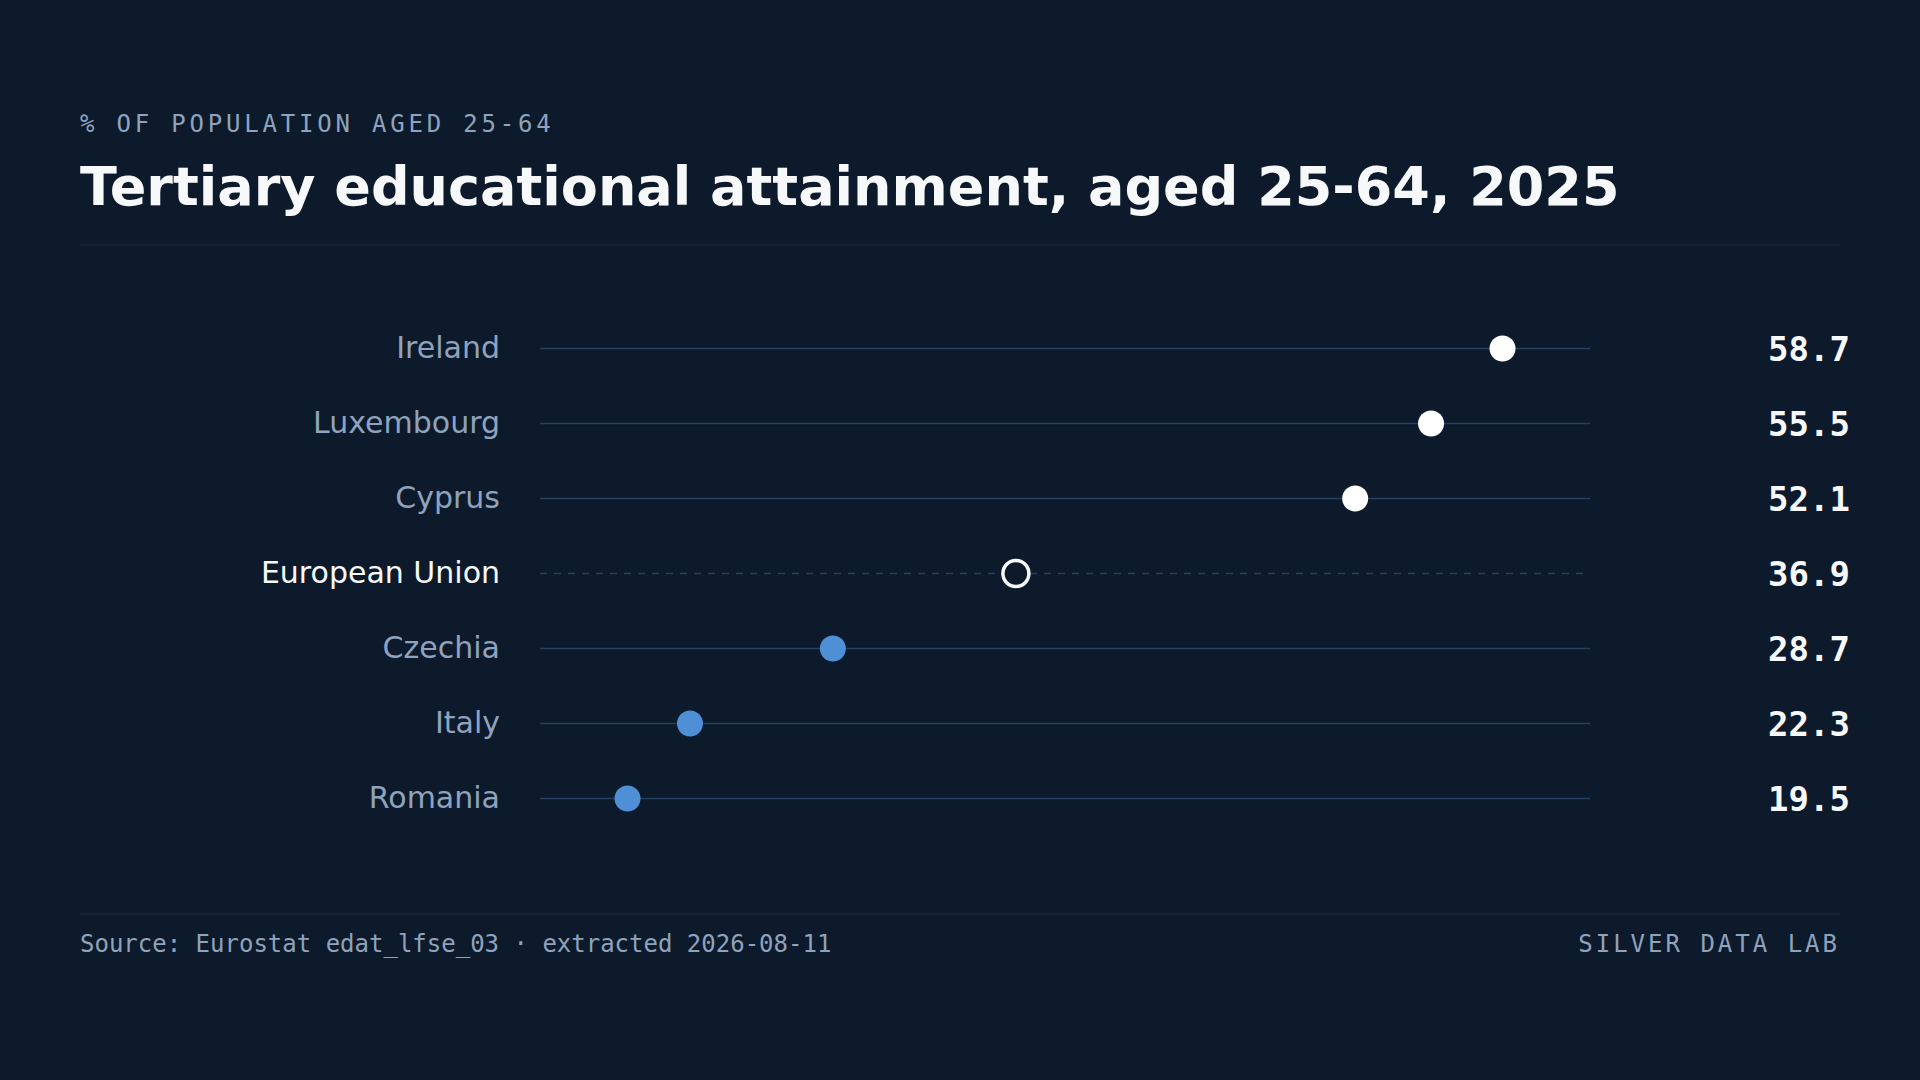
A Degree Is Three Times as Common Among Adults in Ireland as in Romania
36.9% of people aged 25 to 64 in the EU held a tertiary qualification in 2025.
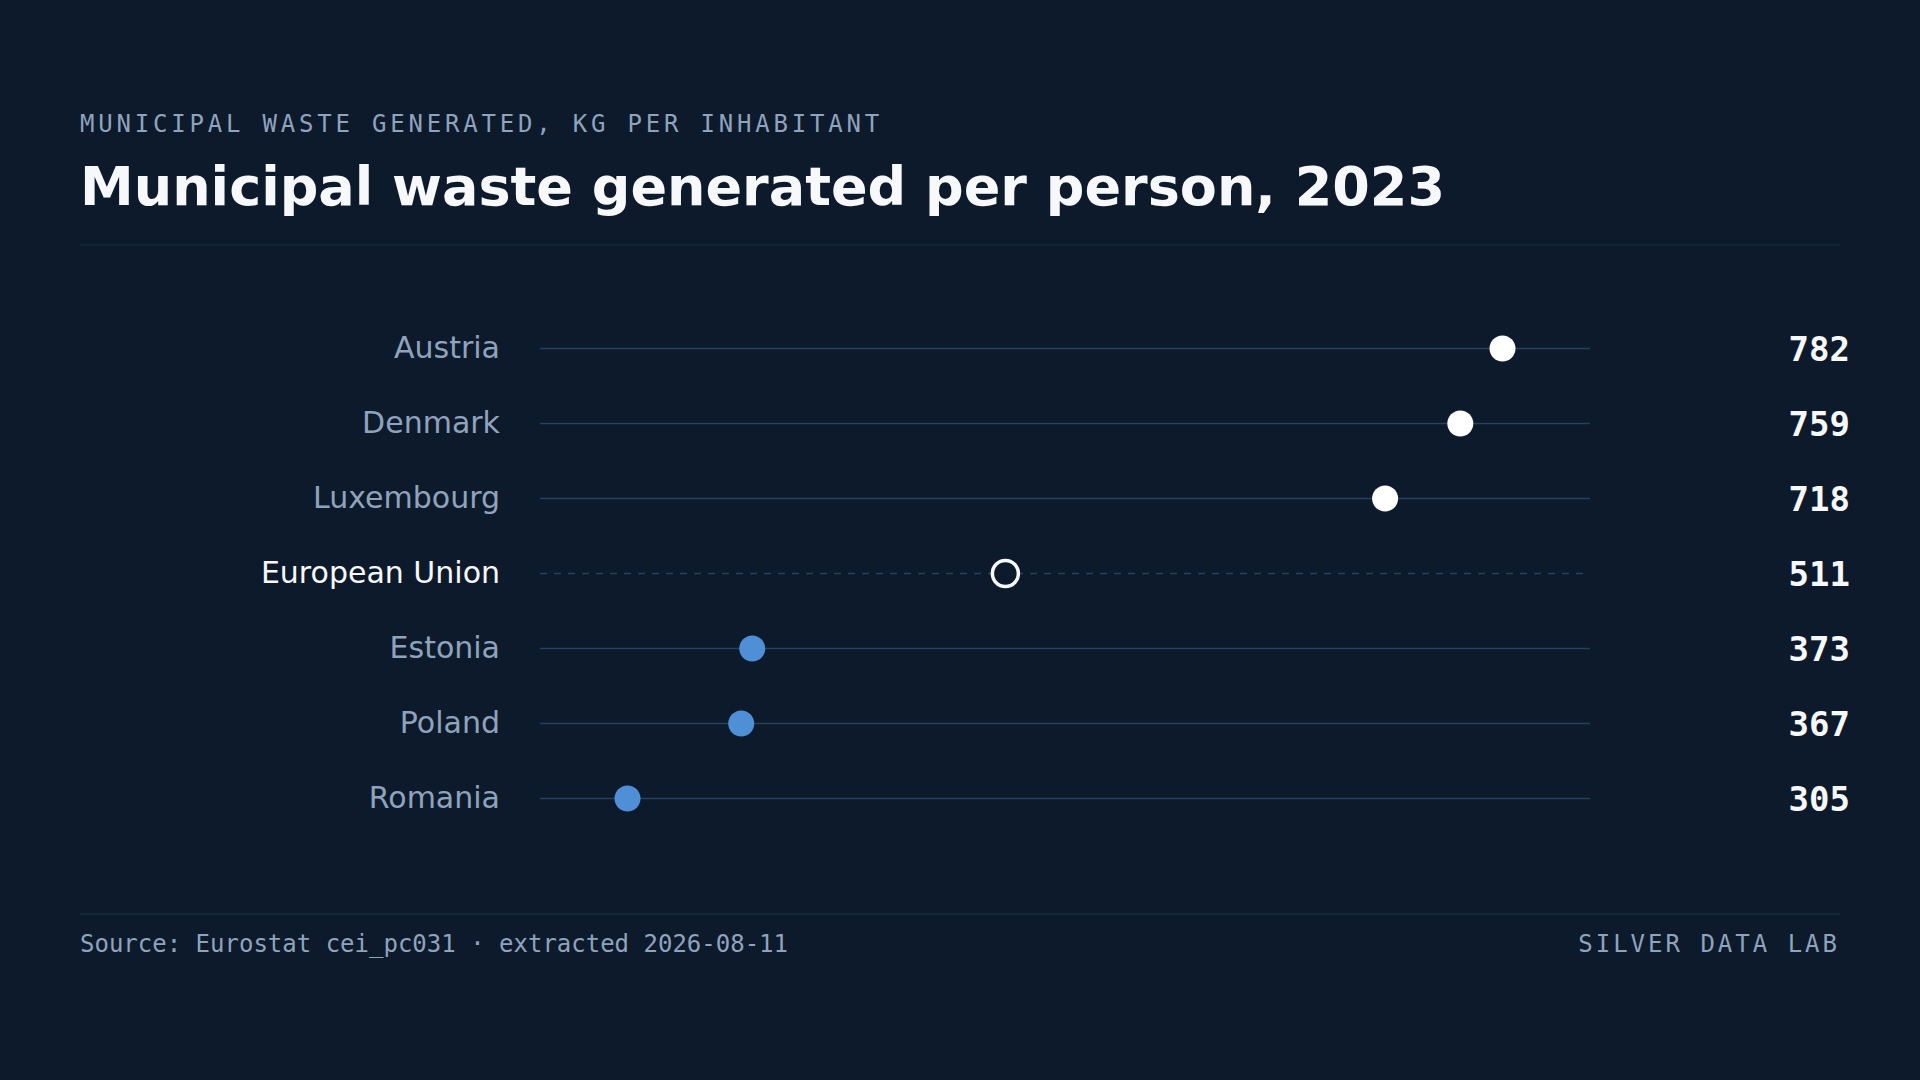
Austria Produces More Rubbish per Person Than Any Other EU Country
The EU generated 510 kg of municipal waste per inhabitant in 2023 — about 1.4 kg per person per day.
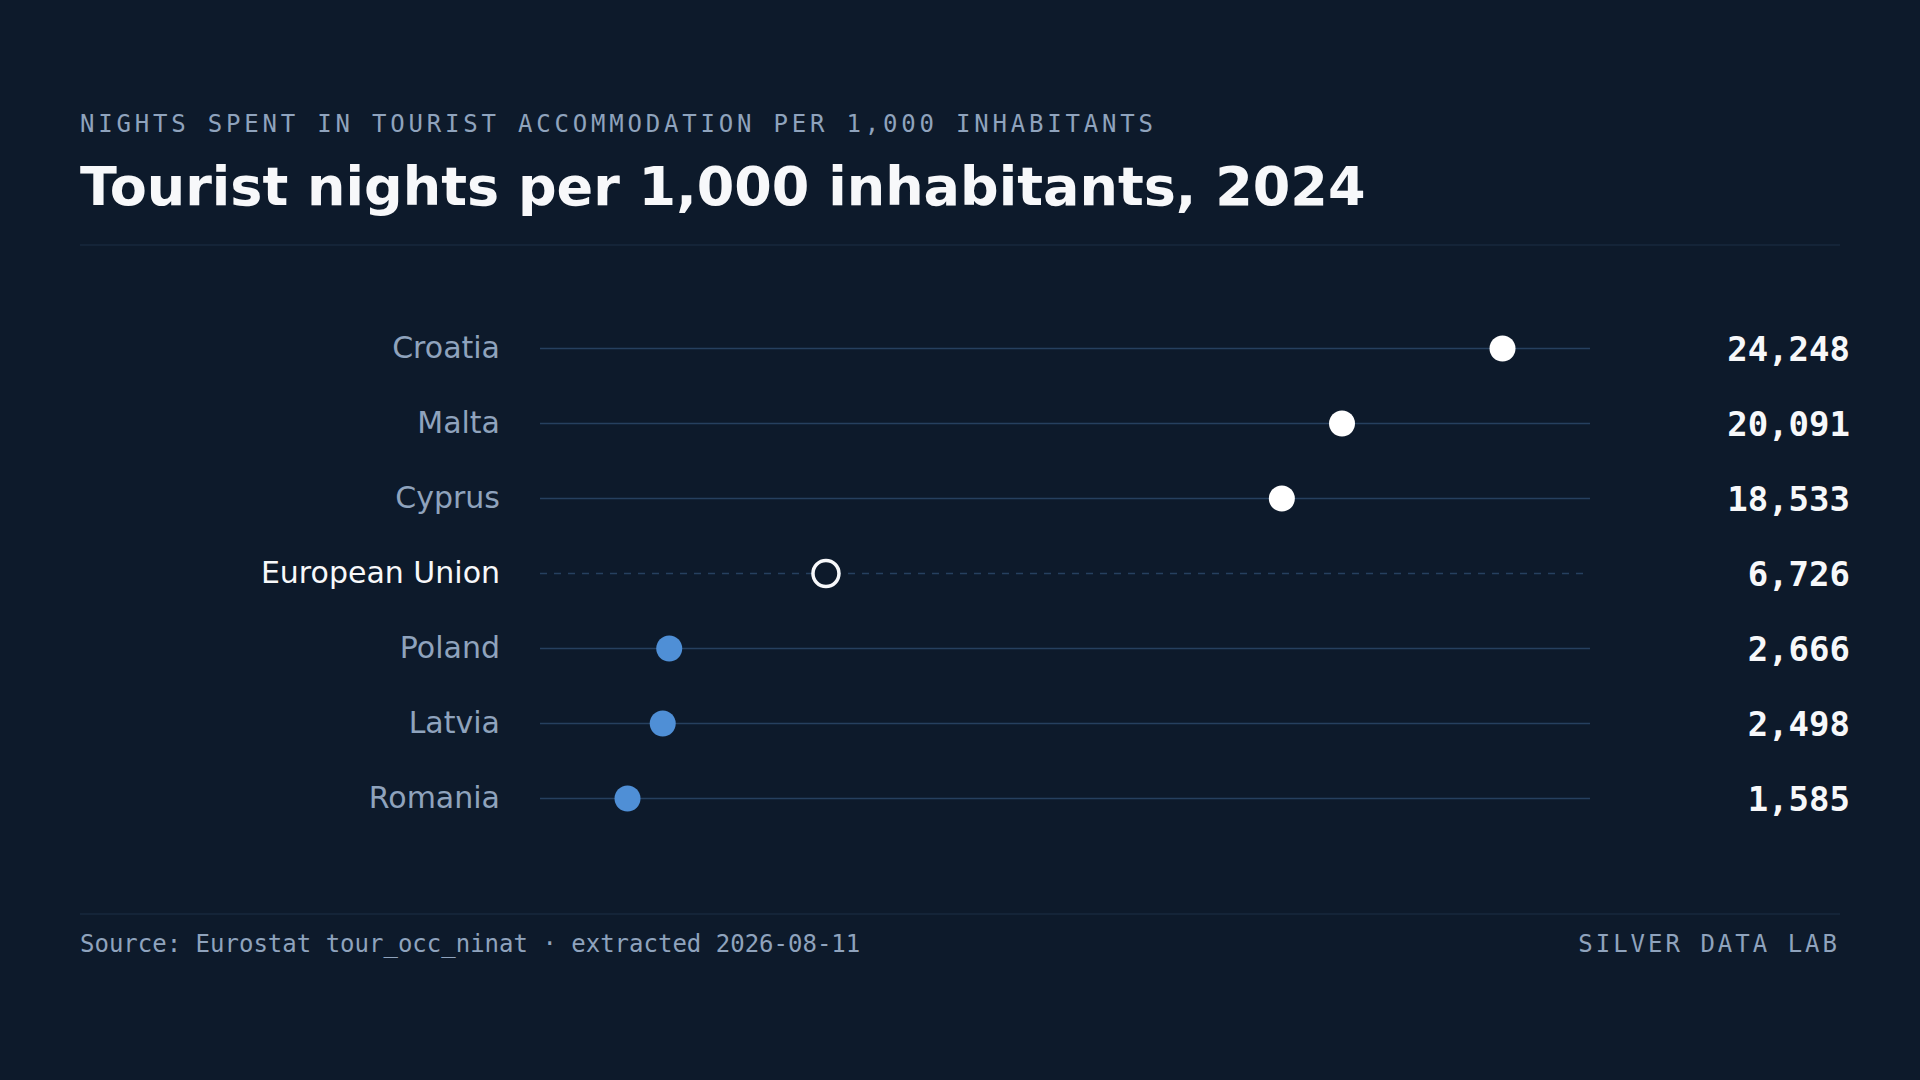
For Its Population, Croatia Has the Most Tourist Overnight Stays in the EU
The EU recorded 6,978 tourist nights per 1,000 inhabitants in 2025, about 7.0 nights per resident.