More Than One Romanian Worker in Six Works in Agriculture
Silver Data Lab Research Desk · Statistical analysis · Published on 18 July 2026
- Data source
- Eurostat
- Reference period
- 2025
- Last updated
- 21 October 2026
Re-checked against the source on 23 October 2026. 21 values in its datasets moved between snapshots, 5 of them figures stated on this page. Every revision we have observed →
Key estimates
- Agriculture, forestry and fishing employed 3.8% of workers in the EU in 2025 and produced 1.8% of its gross value added.
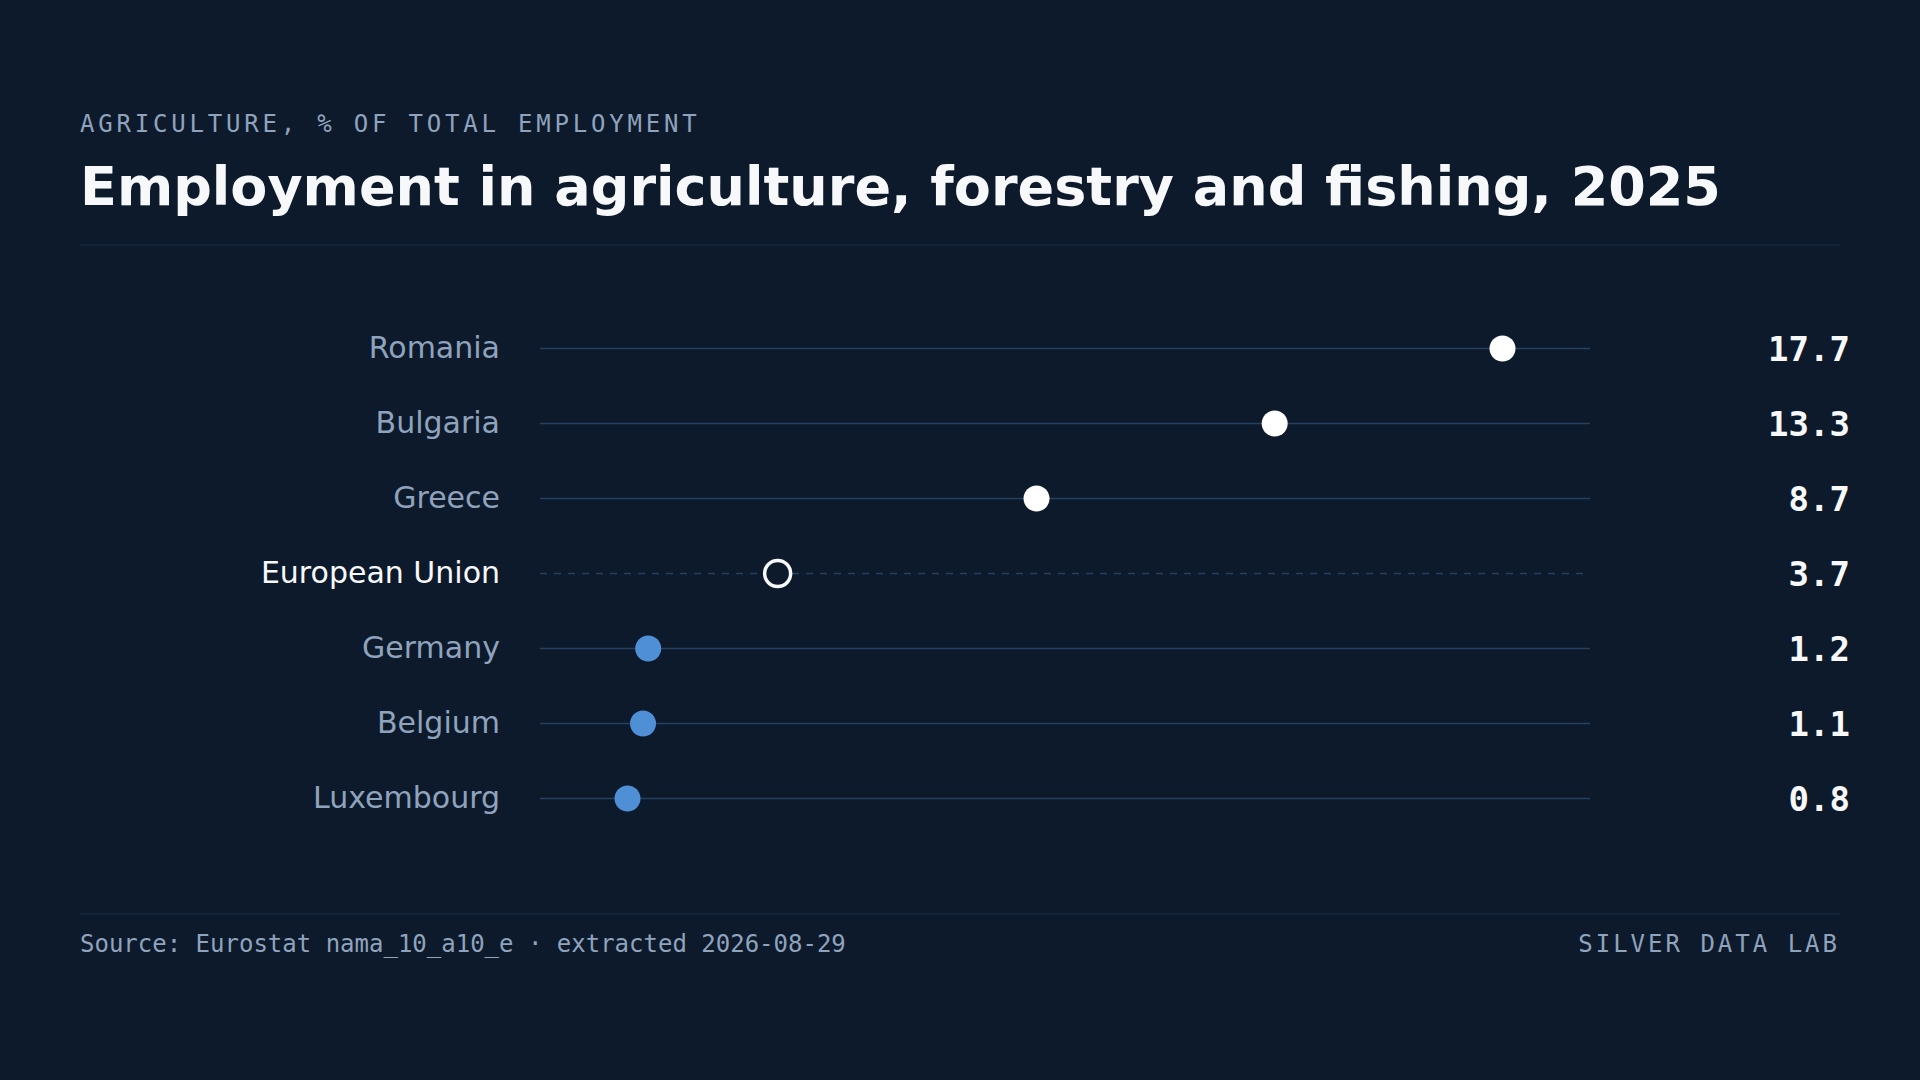
- Romania records 17.7% of employment — more than one worker in six — for 3.0% of national value added.
- Bulgaria records 13.3% of employment for 2.8% of value added.
- Luxembourg at 0.8%, Germany at 1.2% and Belgium at 1.1% have the smallest agricultural workforces.
- The gap between the employment share and the output share is the productivity gap, and it is widest in the two Member States where farming employs the most people.
Two numbers that should be read together
Agriculture's share of employment says how many people work in it. Its share of gross value added says how much of the economy's output they produce. Neither means much alone; the distance between them is the finding.
Across the EU in 2025, agriculture, forestry and fishing employed 3.8% of workers and generated 1.8% of value added. Roughly two workers producing what one worker elsewhere produces.
Romania
Romania records 17.7% of employment in agriculture — more than one worker in six — and 3.0% of gross value added.
That is a ratio of 5.9 to one. A Romanian working in agriculture produces, on average, about a seventh of what a Romanian working elsewhere in the economy produces.
Bulgaria is the second case: 13.3% of employment for 2.8% of value added, a ratio of 4.8. No other Member State exceeds 3.4.
The two of them account for a pattern that the EU aggregate hides completely. Averaged across the Union, agriculture looks like a small sector with modest productivity. In Romania it is the largest single employer of low-productivity labour in the economy.
What the ratio does and does not mean
Low output per worker in agriculture is not a statement about the people doing the work. It is a statement about how the work is organised: farm size, mechanisation, and whether a holding produces for sale or for the household that runs it.
Romania has a very large number of small holdings, many of them producing mainly for their own consumption. Subsistence and semi-subsistence farming appears in employment statistics as work and in output statistics as very little, because most of what it produces is never sold.
That is the mechanism the ratio is detecting, and it is why the number should not be read as inefficiency in the ordinary sense. A holding feeding a household is doing what it was set up to do.
The other end
Luxembourg records 0.8% of employment in agriculture, Belgium 1.1%, Germany 1.2% and Malta 1.3%.
In Germany the employment share of 1.2% sits against a value added share of 0.9% — a ratio of 1.3, far closer to parity than the Union's high-ratio cases. Finland and Hungary are the only Member States where the ratio falls below one, at 0.94 and 0.97: in both, agriculture produces a slightly larger share of output than of employment.
Where the two shares are close, agriculture is a capital-intensive industry like any other. Where they are far apart, it is absorbing labour that the rest of the economy has not.
Why this matters beyond farming
A country cannot move workers out of low-productivity agriculture faster than other sectors create jobs for them. Romania's agricultural employment share is therefore also a statement about the rest of the Romanian economy, and it sits alongside the Union's highest NEET rate and its lowest tertiary attainment, both covered separately on this site.
Employment in agriculture, forestry and fishing, 2025
| Country | % of total employment | Gap to EU averagepercentage points, derived |
|---|---|---|
| Romania | 17.7p | +13.9 |
| Bulgaria | 13.3 | +9.5 |
| Greece | 9.3p | +5.5 |
| European Unionaggregate | 3.8 | — |
| Germany | 1.2p | −2.6 |
| Belgium | 1.1p | −2.7 |
| Luxembourg | 0.8p | −3.0 |
Flags carried by the source on these values: p provisional
This table as data: CSV · JSON
Every Member State for this indicator+
Members see every Member State for this indicator here, not only the rows the ranking prints. Become a Member
Embed this chart
Paste this code into a page. The frame carries the source and the extraction date, and links back to the study.
What these figures cannot tell you
- The sector is wider than farming
- NACE section A covers agriculture, forestry and fishing together. For most Member States farming dominates, but in Finland and Sweden forestry is a substantial part of the total, so the figures are not purely agricultural.
- Subsistence production is largely invisible in output
- Work on a holding that consumes what it produces is counted as employment but contributes little to measured value added. That accounting is correct, and it means the productivity ratio for Member States with many small holdings overstates the gap in what people actually produce.
- Employment counts persons, not hours
- The measure counts people in employment rather than hours worked, and agricultural work is more seasonal and more often part-time than the average. A share measured in hours would be lower in several Member States.
- The productivity ratio is derived, not published
- Eurostat publishes the employment share and the value added share separately. The ratio between them is calculated by Silver Data Lab and is labelled as derived wherever it appears.
Frequently asked questions
- How many people work in agriculture in the EU?
- Agriculture, forestry and fishing accounted for 3.8% of employment in the EU in 2025, while producing 1.8% of gross value added.
- Which EU country has the most agricultural workers?
- Romania, where 17.7% of workers — more than one in six — are in agriculture, forestry or fishing. Bulgaria follows at 13.3% and Greece at 9.3%.
- Why is Romanian agriculture so unproductive?
- Its share of employment is 5.9 times its share of value added, the widest gap in the Union. Romania has a very large number of small holdings producing mainly for the households that run them, and output consumed rather than sold contributes almost nothing to measured value added.
- Which EU country has the fewest farm workers?
- Luxembourg at 0.8% of employment, followed by Belgium at 1.1% and Germany at 1.2%. In Germany the two shares are close, so agricultural productivity is far nearer that of the rest of the economy than in the high-ratio Member States.
Methodological note
Employment by industry is published by Eurostat in the national accounts framework as a percentage of total domestic employment in persons. This study uses NACE section A, agriculture, forestry and fishing.
The value added shares quoted alongside come from the companion series on gross value added by industry, extracted separately and archived with its own filters.
Values are for 2025, the most recent year with complete coverage of the 27 Member States at the extraction date.
The ratio between the employment share and the value added share is computed by Silver Data Lab for each Member State, as is Romanian output per agricultural worker relative to output per worker in the rest of the economy; both are labelled as derived. Neither is published by the source.
Source data
This study draws on 2 datasets from Eurostat. Each can be inspected and re-downloaded from its catalogue, and the filters below are the ones applied.
Employment by main industry (NACE Rev. 2), national accounts
nama_10_a10_e
- Filters applied:
- freq=A · unit=PC_TOT_PER · nace_r2=A · na_item=EMP_DC · time=2025
- Extracted:
- 2026-10-22
- Source last updated:
- 2026-10-21
Gross value added and income by main industry (NACE Rev. 2)
nama_10_a10
- Filters applied:
- freq=A · unit=PC_TOT · na_item=B1G · nace_r2=A · time=2025
- Extracted:
- 2026-10-23
- Source last updated:
- 2026-10-22
Download the data
The data the study you have just read is built on, exactly as it was downloaded and archived.
Yours as a Member.
Data downloadable by Members
How to cite
Record the vintage as well as the study: the figures on this page are the ones extracted on the dates below.
Silver Data Lab Research Desk (2026). More Than One Romanian Worker in Six Works in Agriculture. Silver Data Lab, published 18 July 2026, last updated 21 October 2026. https://www.silverdatalab.com/studies/agricultural-employment-in-the-eu
- Data: Eurostat, Employment by main industry (NACE Rev. 2), national accounts (nama_10_a10_e), filters freq=A, unit=PC_TOT_PER, nace_r2=A, na_item=EMP_DC, time=2025; extracted 2026-10-22; source last updated 2026-10-21. https://doi.org/10.2908/nama_10_a10_e
- Data: Eurostat, Gross value added and income by main industry (NACE Rev. 2) (nama_10_a10), filters freq=A, unit=PC_TOT, na_item=B1G, nace_r2=A, time=2025; extracted 2026-10-23; source last updated 2026-10-22. https://doi.org/10.2908/nama_10_a10
Silver Data Lab's analysis is licensed CC BY 4.0. The statistics remain their publisher's and keep its terms of reuse.
Ask the research desk
A question about this study — a definition, a filter, a break in the series, what the figures can and cannot support — answered by the desk that made the extraction.
Members can write to the research desk
Other studies on the same dataset
Ireland Pays Out More Income Abroad Than It Receives, a Net 28.6% of GDP
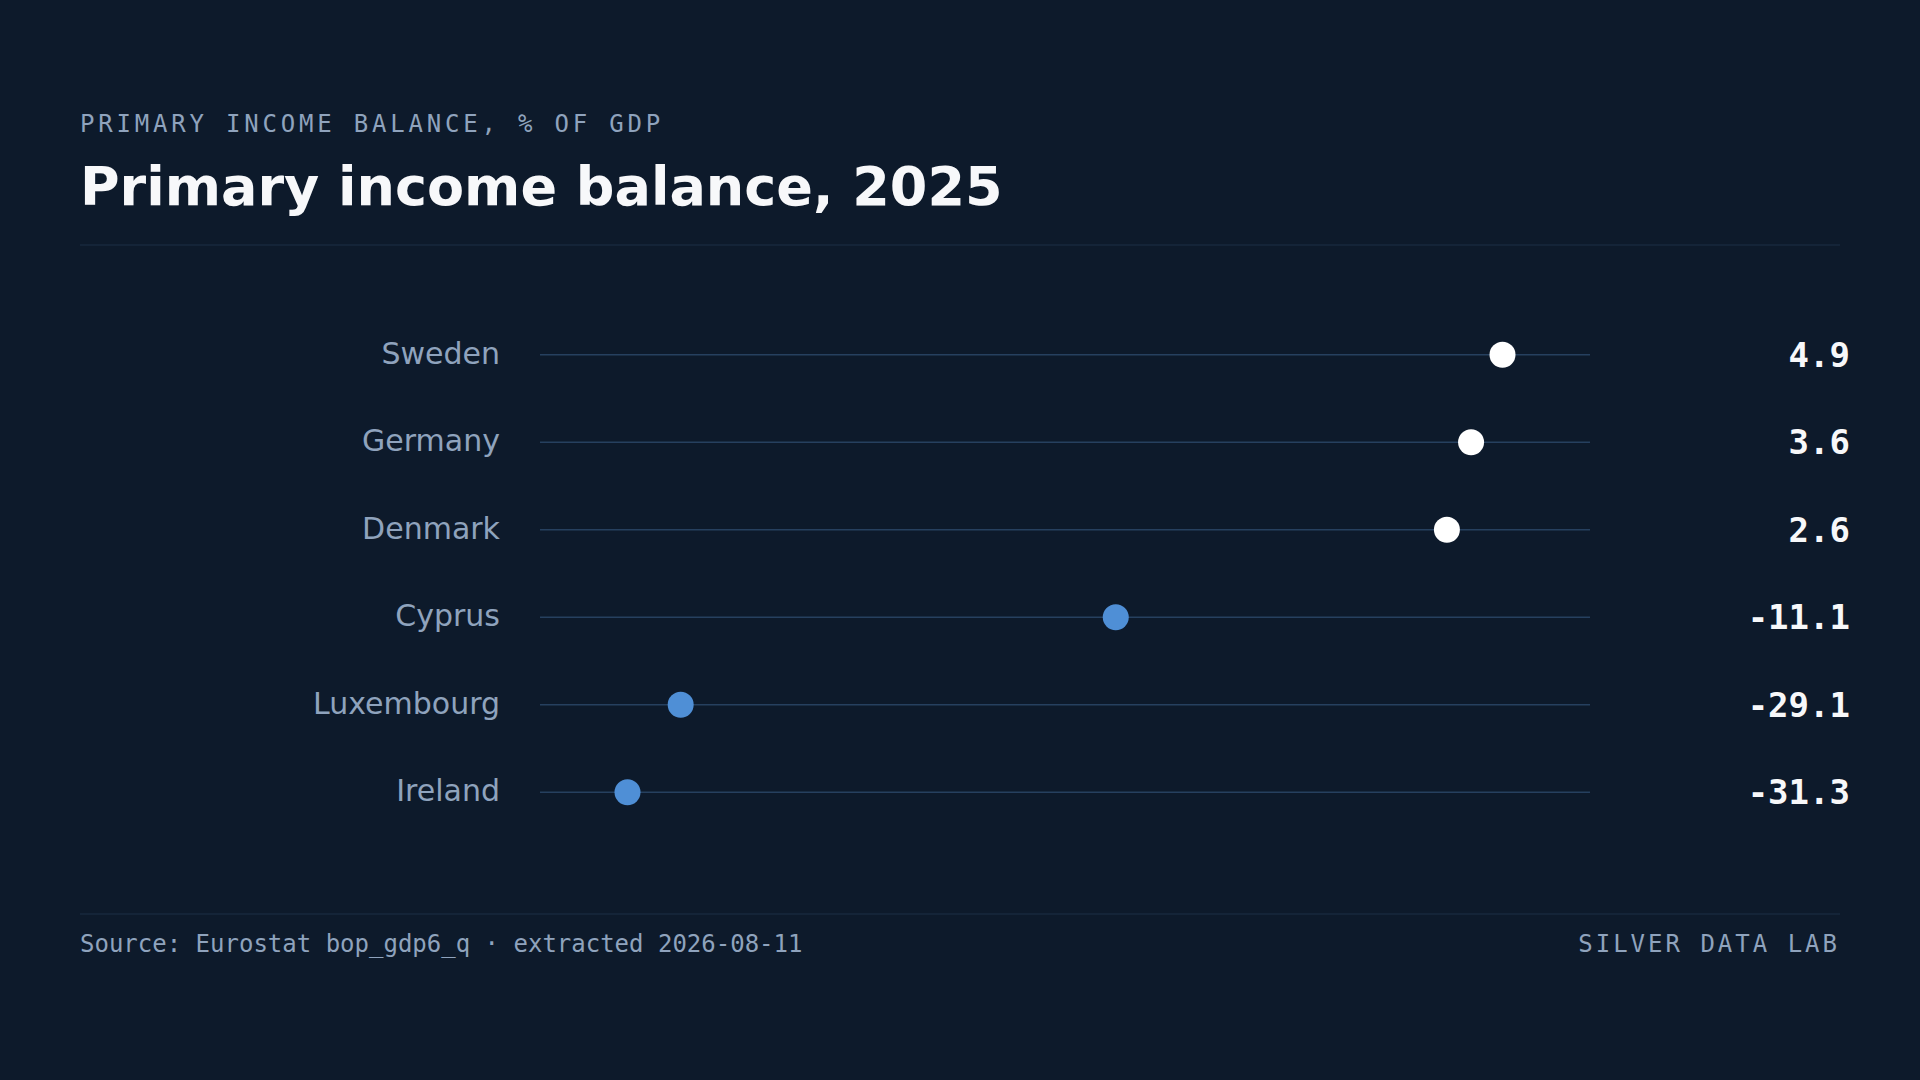
Ireland's net primary income outflow was 28.6% of GDP in 2025, second only to Luxembourg's 29.3%.
Manufacturing Is a Smaller Part of France's Economy Than of Bulgaria's
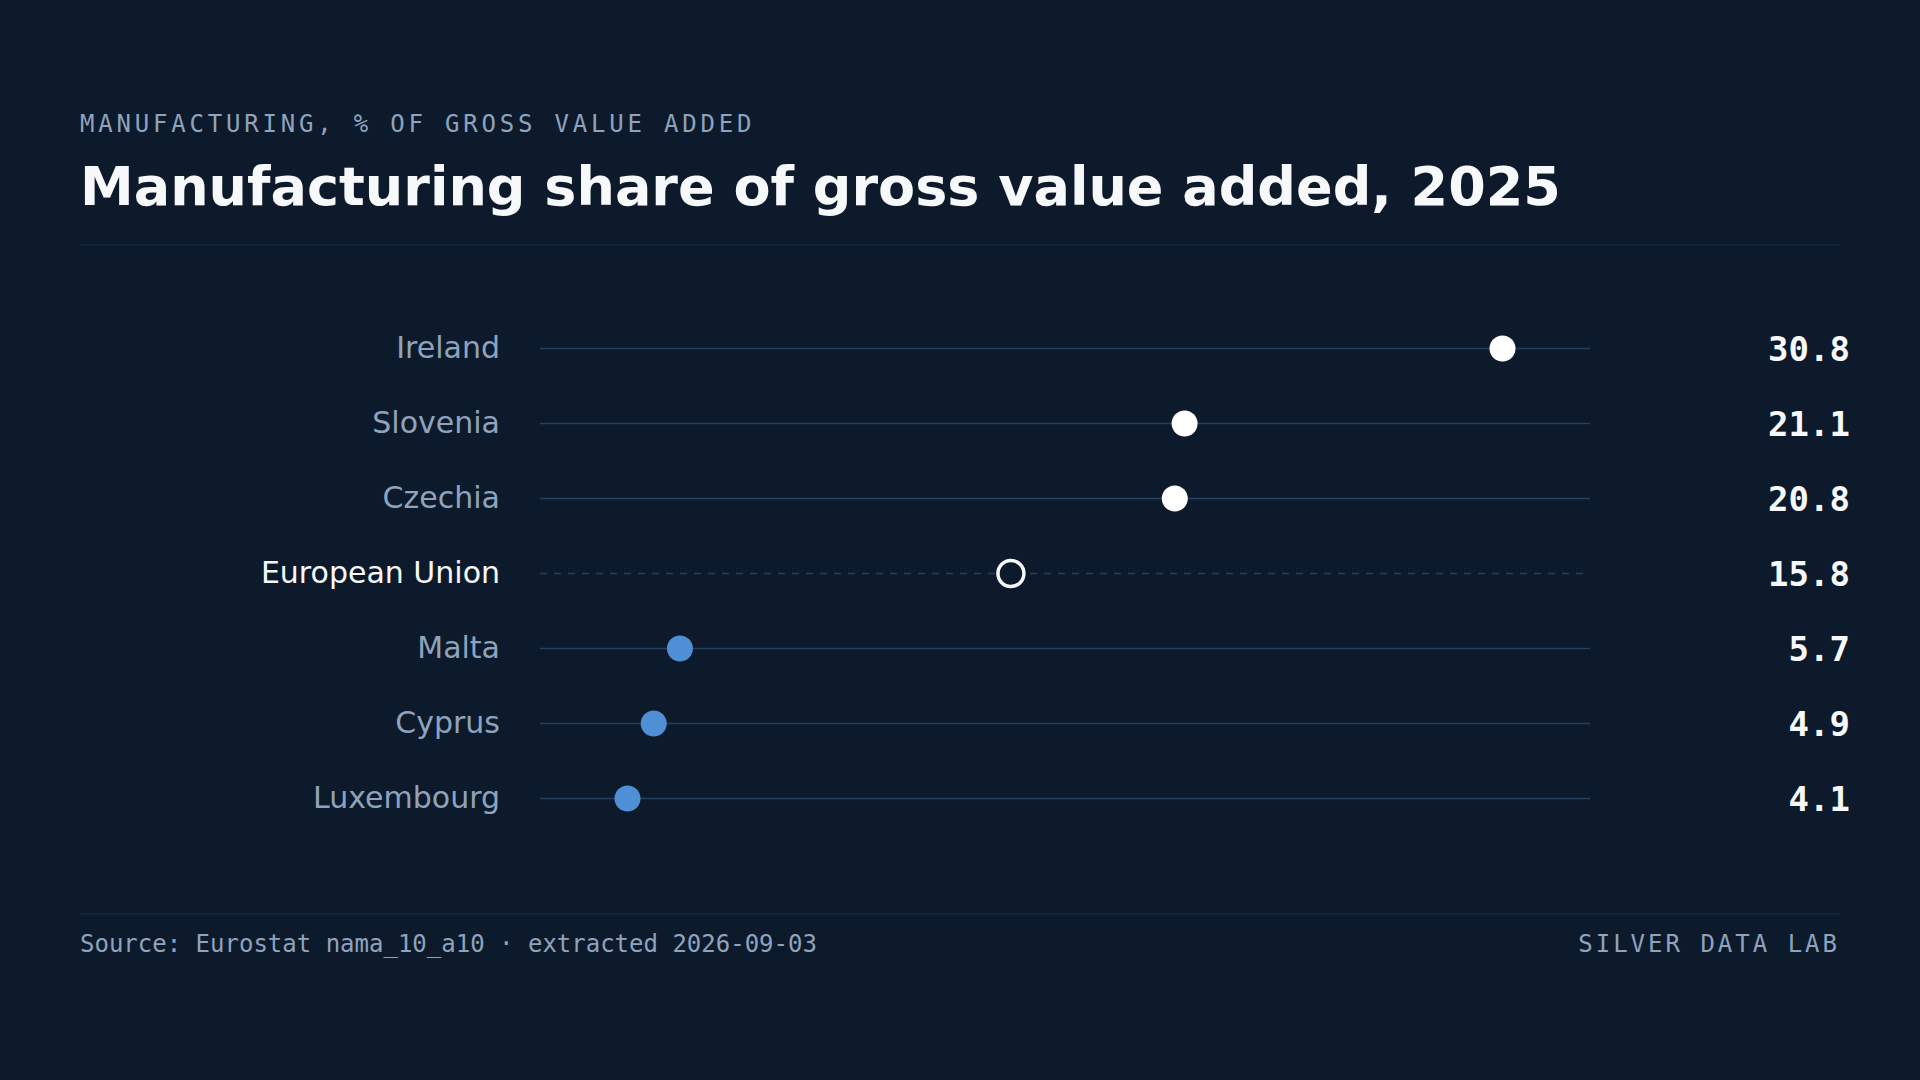
Manufacturing accounted for 15.8% of gross value added in the EU in 2025.
Studies where the same country leads or trails
Deaths Outnumber Births in Twenty-One EU Countries
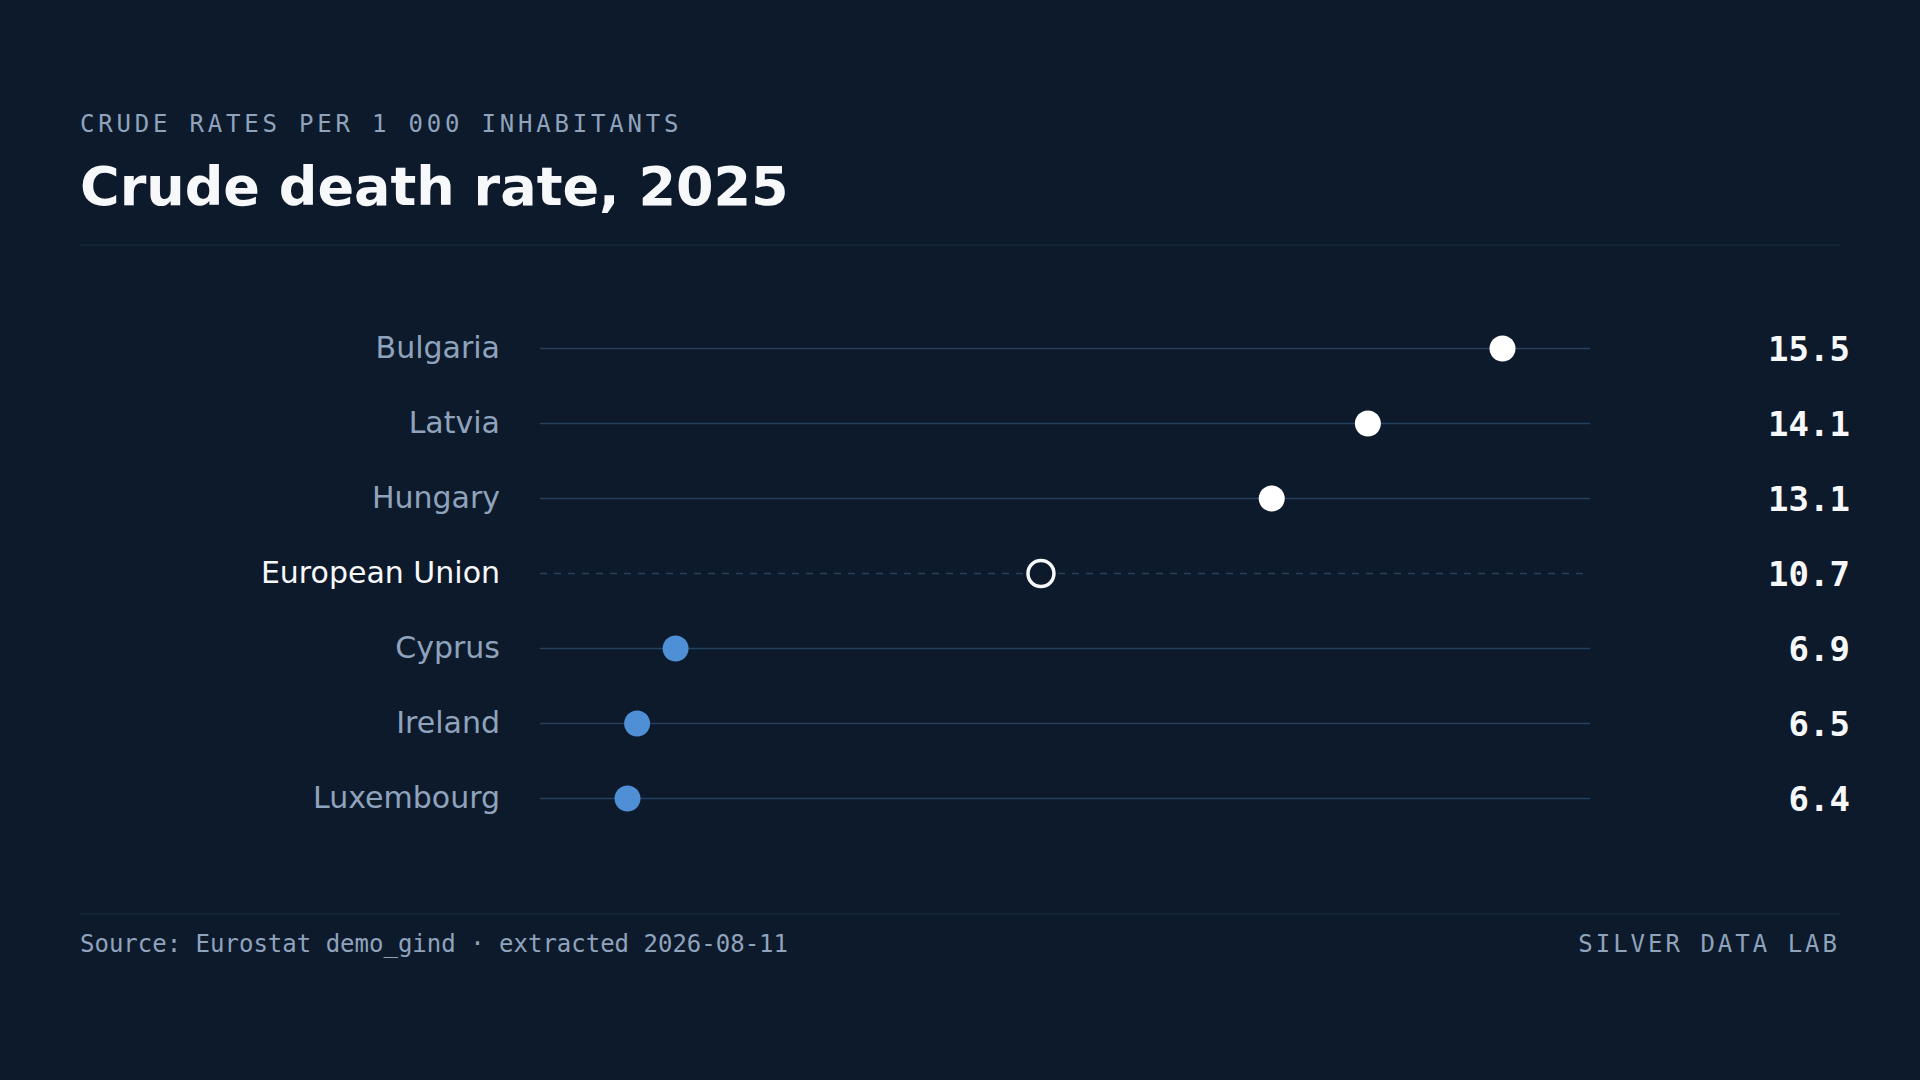
The EU recorded 7.7 births and 10.7 deaths per thousand inhabitants in 2025: a natural change of −3.0.
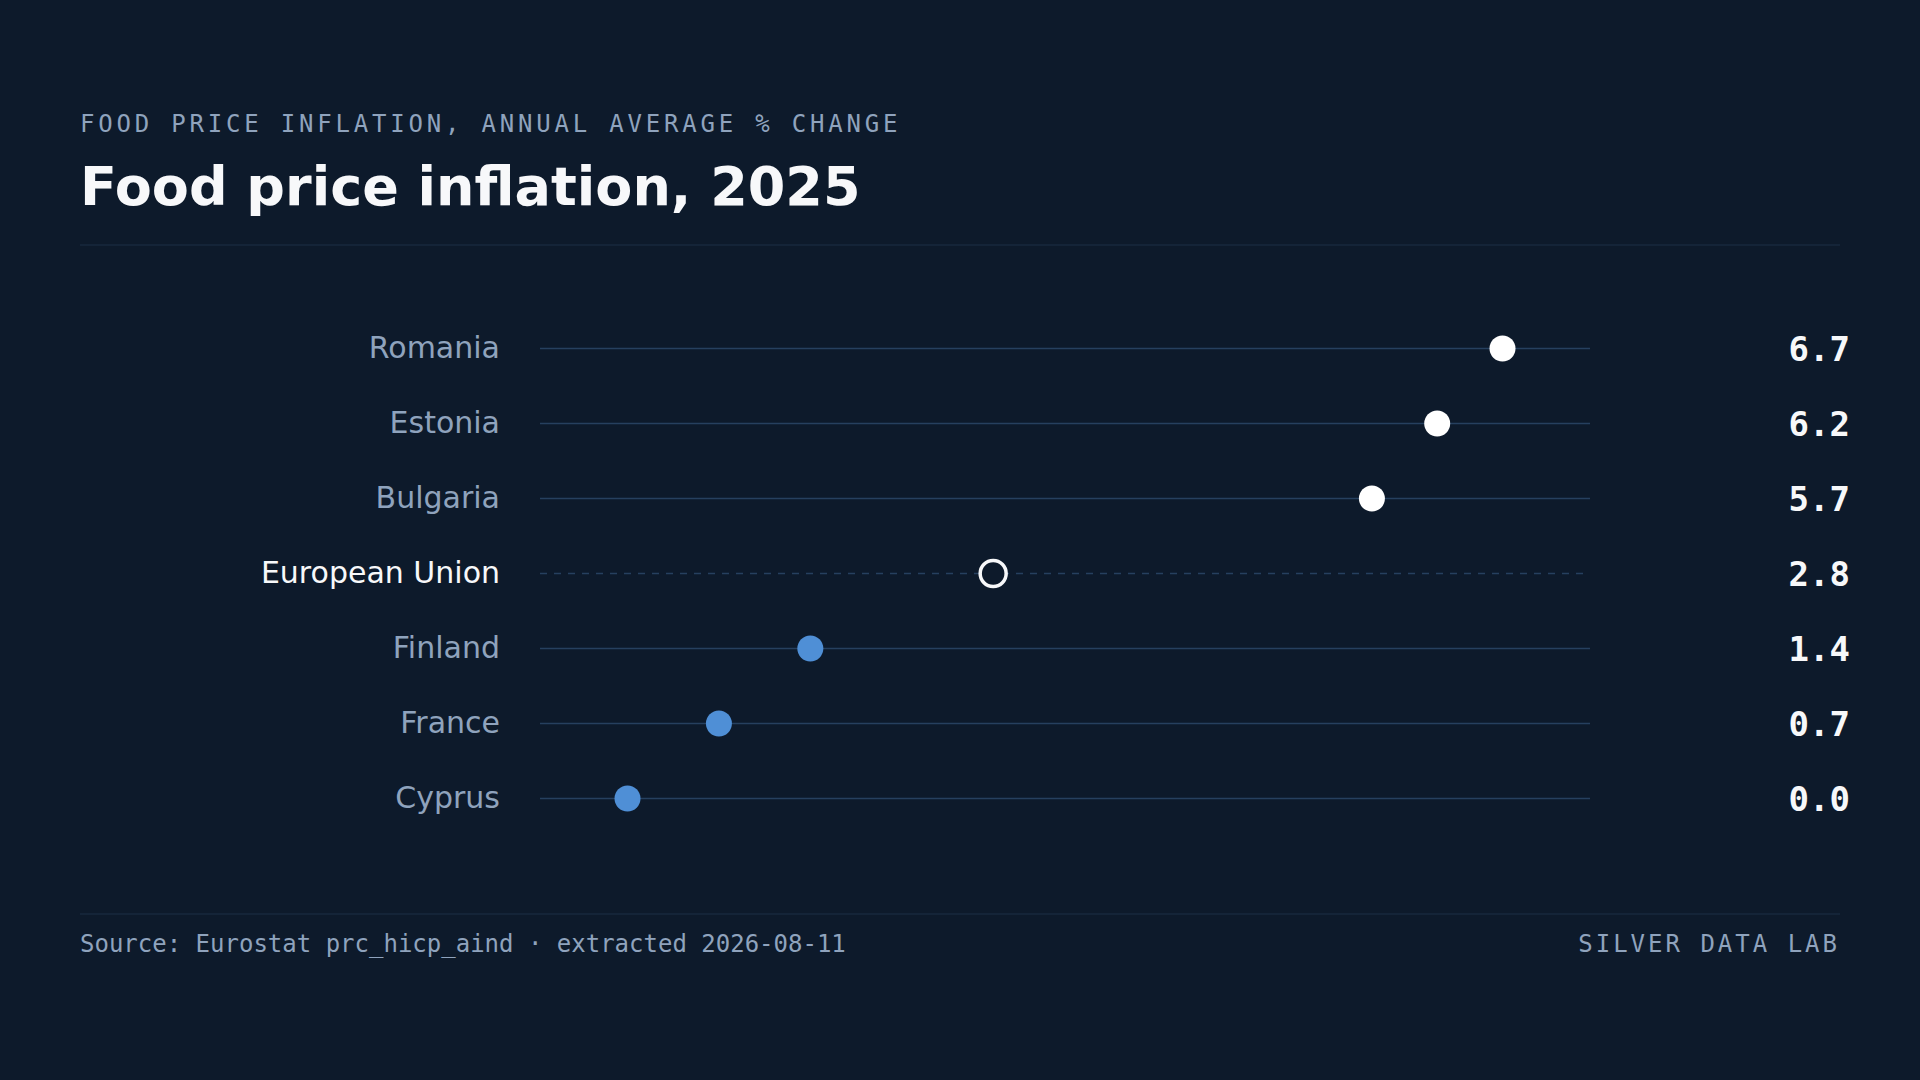
Food Prices Rose 6.7% in Romania and Not at All in Cyprus
Food prices in the EU rose 2.8% on average in 2025.
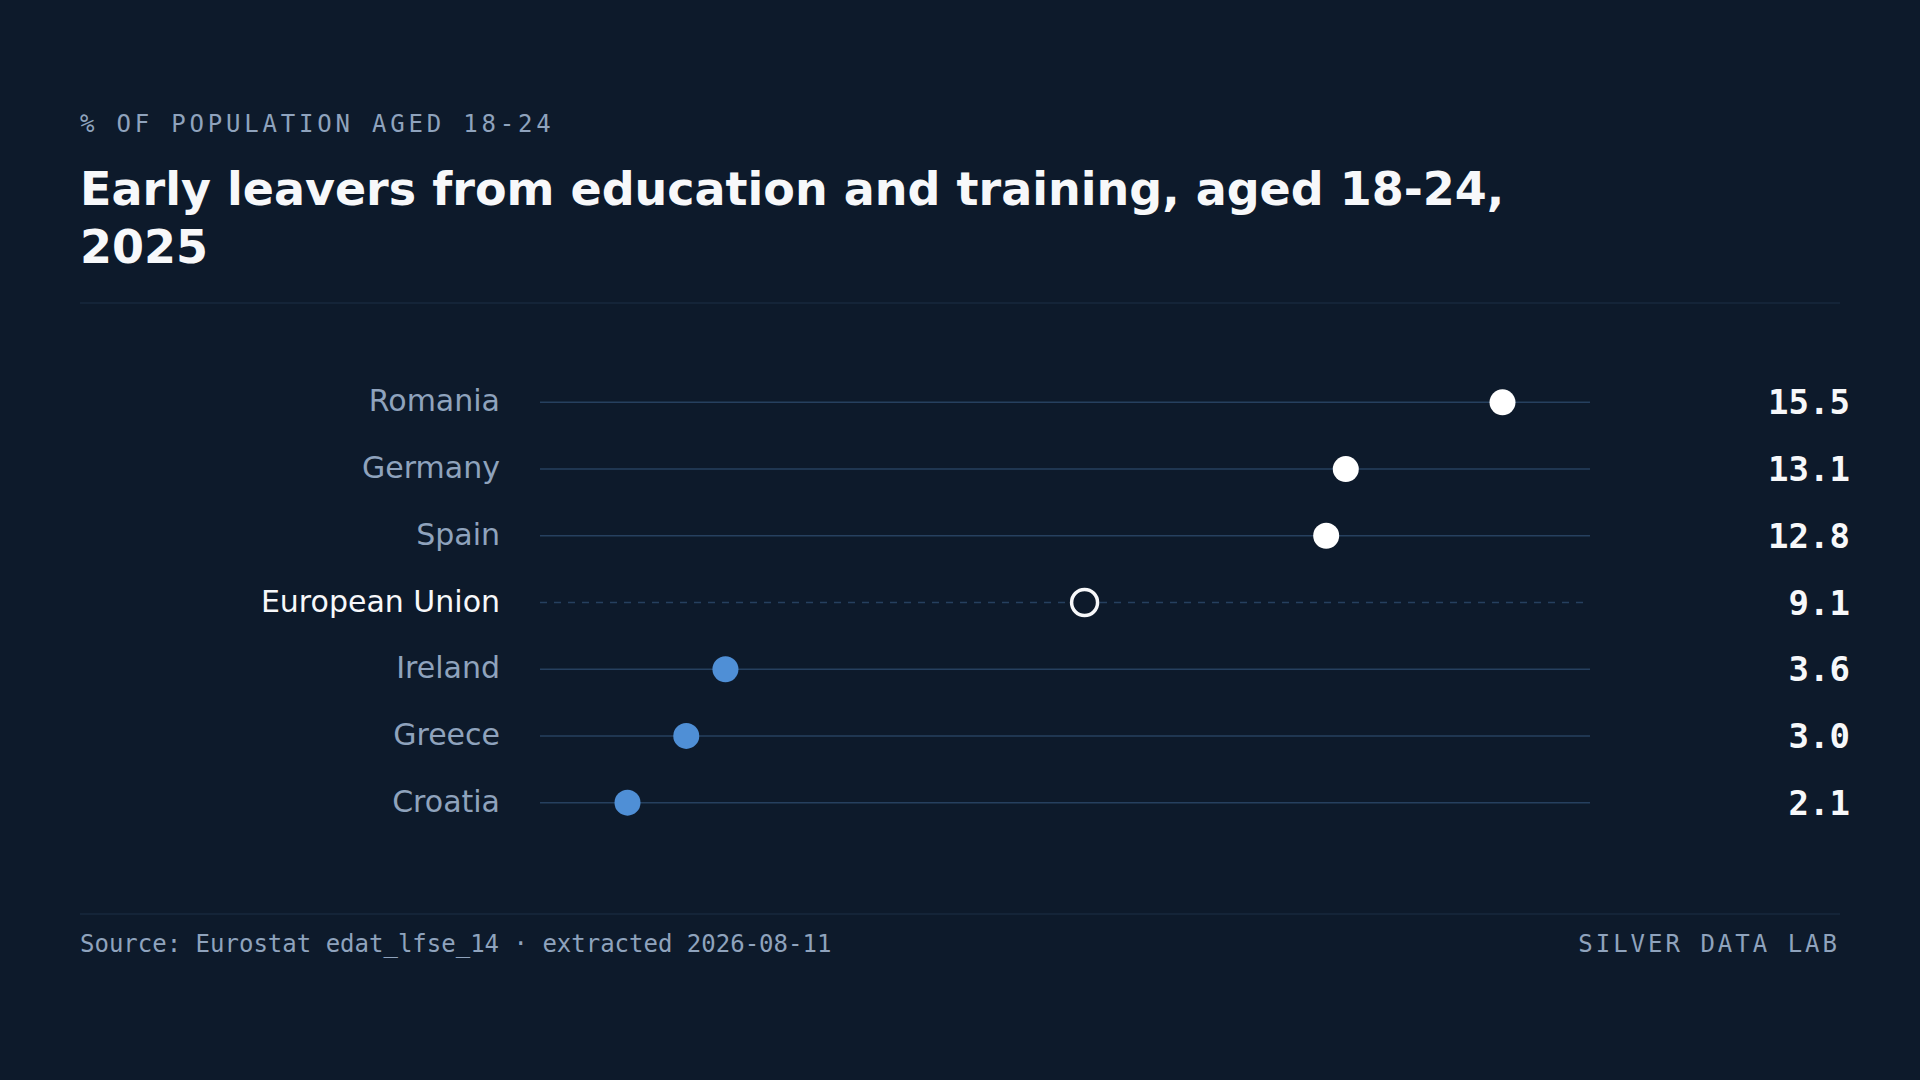
Germany Has the EU's Second-Worst School Dropout Rate
9.1% of people aged 18 to 24 in the EU had left education with at most lower secondary schooling in 2025.