Most EU Countries Still Make Fewer Business Trips Than Before the Pandemic
Silver Data Lab Research Desk · Statistical analysis · Published on 09 October 2026
This study is open to members only
Its sources, filters and extraction date are declared above, as they are for every study. Sign in to read the analysis in full.
- Data source
- Eurostat
- Reference period
- 2025
- Last updated
- 11 October 2026
Re-checked against the source on 09 October 2026. No value in its datasets has moved between the snapshots we hold. Every revision we have observed →
Key estimates
- EU residents made 129.8 million business trips of at least one night in 2025, against 124.7 million in 2019: 4.1% more, a change derived by Silver Data Lab. In 2024 the count was still 1.3% short of 2019.
- France added 6.6 million business trips over those six years and Sweden 7.1 million. The other 25 Member States together made 8.6 million fewer, a combined fall of 9.4%, also derived.
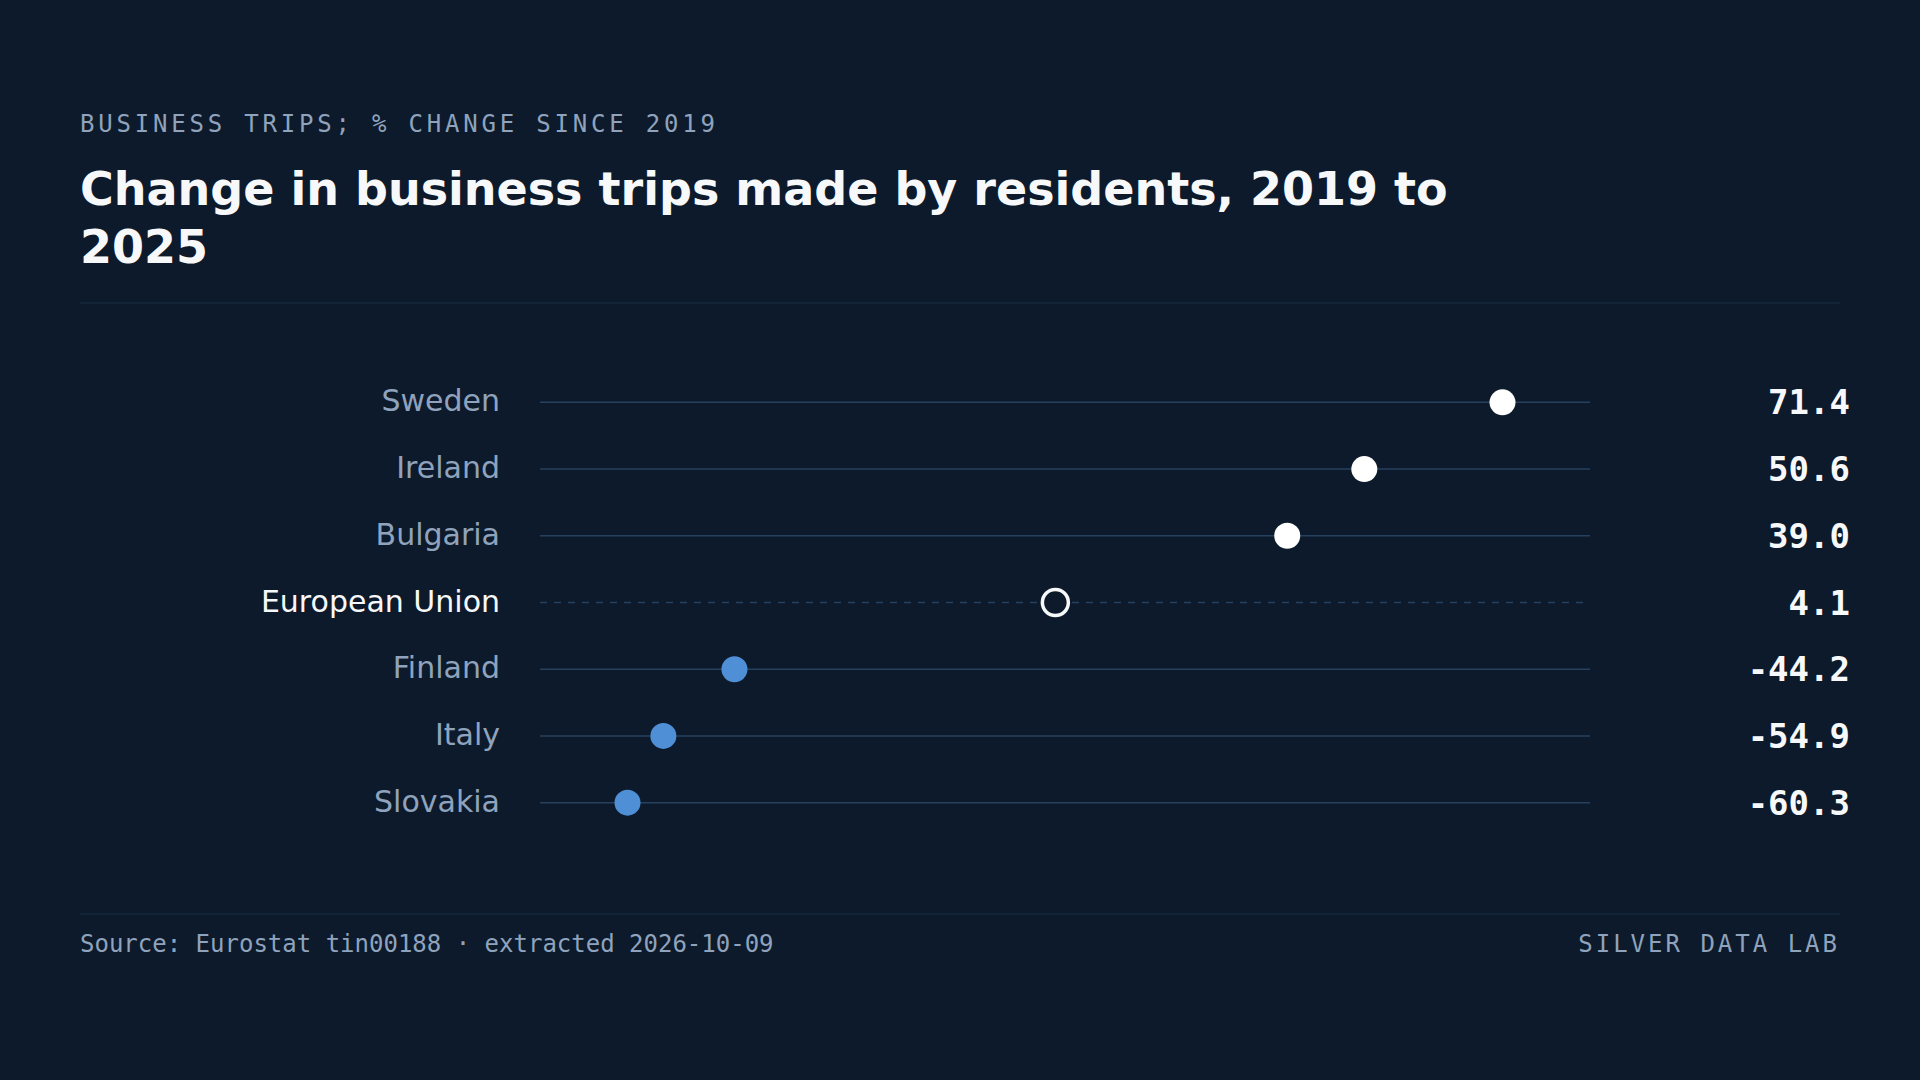
- Sixteen of the 27 Member States recorded fewer business trips in 2025 than in 2019. Slovakia's count fell 60.3%, Italy's 54.9% and Finland's 44.2%, while Sweden's rose 71.4%, Ireland's 50.6% and Bulgaria's 39.0%, changes Silver Data Lab derives from the two counts.
- Business nights have not caught up with the trips: 401.3 million in 2025, 3.5% below the 415.8 million of 2019. The average business trip went from 3.3 nights to 3.1, a derived value: nights divided by trips.
- Business made up 10.7% of all trips by EU residents in 2025. Sweden had the highest share, 16.2%, and Lithuania the next, 15.3%; Romania had the lowest, 1.8%, then Greece, 3.0%. Each share is derived from the counts of trips.
Journeys made for work, as residents report them
Every Member State surveys its households about the travel of residents aged 15 and over: the trips that kept them away from home for at least one night during the year, and the main reason for each. Eurostat groups those reasons into personal ones, which cover holidays, visits to friends and relatives and other private purposes, and a single professional one, labelled "professional, business" in the table. That second category is what this page calls business travel: a trip whose main purpose was the traveller's work.
The unit is the trip, not the traveller. A sales engineer who goes away for work ten times in a year counts ten times, and a colleague who never leaves the office counts not at all. A trip counts wherever it goes, abroad or inside the traveller's own country. A companion table records the nights those same trips lasted, and dividing nights by trips gives the average length of a trip, a value Silver Data Lab derives rather than one Eurostat publishes.
Back above 2019, by a narrow margin
In 2019 EU residents made 124.7 million business trips. The following year the count dropped to 60.7 million, less than half of it, and the climb back took five years: 69.6 million in 2021, 100.7 million in 2022, an estimated 110.3 million in 2023 and 123.1 million in 2024, which was still 1.3% below 2019. The total passed its 2019 level in 2025, at 129.8 million, up 5.5% on the year and 4.1% on 2019.
Personal travel recovered further in the same span: trips for personal reasons rose 6.4% between 2019 and 2025. Business therefore weighs slightly less in the whole than it did, 10.7% of all trips in 2025 against 10.9% in 2019. Every share and every change on this page is derived by Silver Data Lab from the published counts.
Two countries carry the EU total
Germany is the largest source of business trips, with 40.9 million in 2025, and it stands almost exactly where it stood in 2019, 0.1% lower. France is second, with 29.8 million against 23.2 million in 2019, a rise of 28.6%. Together the two account for 54.5% of all business trips made by EU residents.
The EU's net gain since 2019 is smaller than France's gain alone, and smaller than Sweden's. France added 6.6 million trips and Sweden 7.1 million, 13.7 million between them, while the EU total rose by 5.2 million. Taken together, the remaining 25 Member States made 8.6 million fewer business trips than in 2019, a fall of 9.4%. Leave France out of the total and the other 26 are 1.4% below 2019; leave out Sweden instead and they are 1.7% below. Each of these subtotals is a sum of national counts computed by Silver Data Lab, not a figure Eurostat publishes.
Neither of the two national series moves smoothly. France recorded 33.3 million business trips in 2024, more than in 2025. Sweden's count went from 11.6 million in 2024 to 17.1 million in 2025, a rise of 47.3% in a single year, and before the pandemic it had swung from 5.0 million in 2015 to 11.3 million in 2017. In series like these, a change measured between two single years depends heavily on which two years are picked.
Sixteen Member States still below 2019
In 2025, 16 of the 27 Member States recorded fewer business trips by their residents than in 2019; a year earlier the count was 17. For two of the sixteen the shortfall is marginal: Germany is 0.1% below and Spain 1.0%. For three it is more than two fifths.
Slovakia's residents made 1.9 million business trips in 2019 and 0.7 million in 2025, a fall of 60.3%. Italy's made 7.8 million and 3.5 million, a fall of 54.9%; Italian business trips dropped to 2.5 million in 2020, and their highest count since then is 4.1 million, in 2023. Finland is 44.2% below its 2019 count, followed by Greece at 37.4%, Romania at 37.2% and Denmark at 36.3%.
In these countries business travel fell further than personal travel. Italian residents' personal trips are 23.3% below 2019 and Finnish residents' 20.9%, less than half the fall in their business trips, and Slovak residents' personal trips are down 4.8%. Business has become a much smaller part of their travel as a result: 7.7% of Italian residents' trips in 2025 against 12.5% in 2019, and 6.0% of Slovak residents' trips against 13.3%.
Where the count rose most
Sweden's residents made 71.4% more business trips in 2025 than in 2019, Ireland's 50.6% more and Bulgaria's 39.0% more. Poland, Slovenia, France, Latvia and Lithuania follow, each up by more than a quarter. In Sweden and Ireland business trips rose together with personal ones: Swedish residents' personal trips were up 97.3% and Irish residents' 53.1%. In Bulgaria the rise was concentrated in business, with personal trips up 8.5%.
None of the 2019, 2024 or 2025 values behind these movements carries a break flag, so the table does not present any of them as a change of method. The figures still come from household surveys, and a survey's results can shift with its sample, its questionnaire or how a respondent's reason for travelling is classified, as well as with travel itself. The table does not say which of these applies in any country, and this page offers no cause as a finding. One common reading of the period is that video calls replaced some journeys once made for work; the table cannot test it, and it would not account for the countries where business trips rose by half or more.
More trips, fewer nights
The count of nights tells a different story from the count of trips. EU residents spent 415.8 million nights on business trips in 2019, 382.5 million in 2024 and 401.3 million in 2025, still 3.5% below 2019 in the year the number of trips passed it. Nights divided by trips, the average business trip lasted 3.3 nights in 2019 and 3.1 in 2025. Personal trips did not shorten in the same way: they averaged 5.2 nights in 2019 and 5.3 in 2025.
No Member State lost more business nights than Germany. Its residents made almost as many business trips in 2025 as in 2019 but spent 11.8% fewer nights on them, 122.9 million against 139.3 million, so their average business trip fell from 3.4 nights to 3.0. The 16.4 million business nights Germany lost exceed the EU's net fall of 14.4 million; the other 26 Member States together spent 0.7% more business nights in 2025 than in 2019, but their business trips grew faster still, so their average trip shortened as well. France's trips grew faster than its nights, 28.6% against 15.2%, and its average business trip shortened from 3.1 nights to 2.7.
How much of travel is work
Business accounted for 16.2% of Swedish residents' trips in 2025, the highest share in the EU, followed by Lithuania at 15.3%, Germany at 14.9% and Estonia at 14.8%. At the other end it was 1.8% of Romanian residents' trips, 3.0% of Greek residents' and 3.5% of Czech residents', with Hungary at 3.7%. Across the EU the share was 10.7%, and between 2019 and 2025 it fell in 21 of the 27 Member States.
A share has two halves, and either can move it. Residents who take many personal trips will show a low business share even where business travel is common, and Sweden's share fell from 18.2% in 2019 to 16.2% while its business trips grew by more than two thirds, because its personal trips grew faster still.
Personal travel by the same residents is the subject of the study on holidays abroad, which follows where holiday nights are spent. This page keeps to the trips made for work.
Change in business trips made by residents, 2019 to 2025
| Country | % change since 2019 (derived) | Gap to EU changepercentage points, derived |
|---|---|---|
| Sweden | 71.4 | +67.3 |
| Ireland | 50.6 | +46.5 |
| Bulgaria | 39.0 | +34.9 |
| European Unionaggregate | 4.1 | — |
| Finland | -44.2 | −48.3 |
| Italy | -54.9 | −59.0 |
| Slovakia | -60.3 | −64.4 |
This table as data: CSV · JSON
Every Member State for this indicator+
Members see every Member State for this indicator here, not only the rows the ranking prints. Become a Member
Business trips as a share of all trips made by residents, 2025
| Country | % of trips (derived) | Gap to EU sharepercentage points, derived |
|---|---|---|
| Sweden | 16.2 | +5.5 |
| Lithuania | 15.3 | +4.6 |
| Germany | 14.9 | +4.2 |
| European Unionaggregate | 10.7 | — |
| Czechia | 3.5 | −7.2 |
| Greece | 3.0 | −7.7 |
| Romania | 1.8 | −8.9 |
This table as data: CSV · JSON
Every Member State for this indicator+
Members see every Member State for this indicator here, not only the rows the ranking prints. Become a Member
What these figures cannot tell you
- Residents' trips, counted one by one
- The figures come from household surveys of residents aged 15 and over, so they describe the trips residents of each country made, wherever they went, and not the business visitors a country received. Each trip counts once whoever made it, so a frequent traveller weighs as much as several occasional ones, and the table cannot say how many people travel for work. It records nothing about spending, about who paid, or about same-day business journeys that ended at home the same evening.
- Large national movements the table does not explain
- No 2019, 2024 or 2025 value used here carries a break flag, yet several national counts moved by half or more, and Sweden's personal trips nearly doubled alongside its business trips. A survey can move with its sample or questionnaire as well as with behaviour, and the table gives no way to tell the two apart. The changes are reported as published; no cause is offered for them, and a change between two single years in a series that swings from year to year should not be read as a trend.
- Every ranked value is derived
- Eurostat publishes counts of trips and nights. The changes, the shares and the average length of a trip are computed from those counts by Silver Data Lab, and so are the subtotals for groups of Member States, which are sums of national values. For the 27 together, that sum differs from Eurostat's EU aggregate by no more than three trips or nights in 2019 and 2025, the two years the subtotals compare, far too little to move any figure on this page.
- Flags elsewhere in the series
- The EU aggregate is flagged as estimated for 2023, the one EU value used here that carries a flag, and Sweden has no value for 2023. Earlier in the series, breaks are flagged for Italy, Malta and Poland in 2014, Spain in 2015 and Belgium in 2017, and Slovakia's business-trip counts for 2014, 2016 and 2020, Latvia's for 2020 and Bulgaria's for 2021 are flagged as of low reliability. None of those country values is used on this page.
Frequently asked questions
- How many business trips do EU residents make in a year?
- 129.8 million in 2025, counting trips of at least one night whose main purpose was work, made by residents aged 15 and over. That is 4.1% more than the 124.7 million of 2019, a rise derived by Silver Data Lab. The count is of trips, so a resident who travels for work several times is counted each time.
- Has business travel in the EU recovered from the pandemic?
- In number of trips, narrowly. The count fell to 60.7 million in 2020, was still 1.3% below 2019 in 2024 and passed it in 2025. Leave out France, or leave out Sweden, and the other 26 Member States together made fewer business trips in 2025 than in 2019; 16 Member States are below their own 2019 count, and business nights in 2025 were 3.5% short of 2019. Those subtotals and changes are derived by Silver Data Lab.
- Which EU countries make far fewer business trips than before the pandemic?
- Slovakia, whose residents made 60.3% fewer business trips in 2025 than in 2019, Italy, 54.9% fewer, and Finland, 44.2% fewer. Greece, Romania and Denmark are each more than a third below. The falls are derived from Eurostat's counts, which carry no break flag for these years and do not explain them.
- Are business trips getting shorter?
- On average, yes. Dividing nights by trips, an EU resident's business trip lasted 3.3 nights in 2019 and 3.1 in 2025, while personal trips went from 5.2 nights to 5.3. Germany's residents made almost as many business trips as in 2019 but spent 11.8% fewer nights on them, and in the other 26 Member States taken together trips grew faster than nights. These averages and changes are derived by Silver Data Lab.
Methodological note
The two tables measure, for the residents of each Member State and of the EU as a whole, the number of trips of one night or more made during the year and the number of nights spent on those trips, broken down by the main purpose of the trip. Respondents are residents aged 15 and over, and a trip counts whatever its destination, the traveller's own country included. This page uses three purposes: professional or business, the total of personal reasons, and all purposes together. From the trips table it uses 2019, 2024 and 2025 for every Member State and the EU, the EU's counts for 2020 to 2023, Italy's for 2020 to 2023 and Sweden's for 2015 and 2017; from the nights table it uses 2019, 2024 and 2025.
Changes are measured from 2019, the last year whose travel the pandemic did not touch, apart from the two changes between 2024 and 2025 quoted for the EU and for Sweden. 2025 is the latest year in the tables, with a value for every Member State and for the EU aggregate.
Silver Data Lab derived the following from the published counts: the percentage change in business trips between 2019 and 2025 for each Member State and the EU, which includes every value in the first ranking; the EU's change in business trips between 2019 and 2024 and between 2024 and 2025, and Sweden's between 2024 and 2025; the EU's 2020 count as a proportion of its 2019 count; the percentage changes in personal trips and in business nights between 2019 and 2025; business trips as a share of trips for all purposes, for each Member State and the EU in 2019 and 2025, which includes every value in the second ranking, and the count of Member States whose share fell; the average number of nights per business trip and per personal trip, nights divided by trips; the increases in business trips for France, Sweden and the EU, in millions, and the sum of the first two; the business trips of the 25 Member States other than France and Sweden, of the 26 other than France and of the 26 other than Sweden, and the business trips and nights of the 26 other than Germany, all sums of national counts, with their changes between 2019 and 2025; the combined share of Germany and France in EU business trips; the fall in business nights of each Member State and of the EU, in millions; the counts of Member States below their 2019 level in 2024 and 2025 and of those up by more than a quarter; the comparisons between falls in personal and business trips; the rank positions described in the text; and the rounding of counts to millions. Every other figure on the page is a count Eurostat publishes, quoted without adjustment.
Source data
This study draws on 2 datasets from Eurostat. Each can be inspected and re-downloaded from its catalogue, and the filters below are the ones applied.
Trips by purpose
tin00188
- Filters applied:
- freq=A · c_dest=WORLD · purpose=PROF, PER, TOTAL · duration=N_GE1 · unit=NR · time=2015, 2017, 2019, 2020, 2021, 2022, 2023, 2024, 2025
- Extracted:
- 2026-10-09
- Source last updated:
- 2026-10-08
Nights spent by purpose
tin00191
- Filters applied:
- freq=A · c_dest=WORLD · purpose=PROF, PER · duration=N_GE1 · unit=NR · time=2019, 2024, 2025
- Extracted:
- 2026-10-09
- Source last updated:
- 2026-10-08
Download the data
The data the study you have just read is built on, exactly as it was downloaded and archived.
Yours as a Member.
Data downloadable by Members
How to cite
Record the vintage as well as the study: the figures on this page are the ones extracted on the dates below.
Silver Data Lab Research Desk (2026). Most EU Countries Still Make Fewer Business Trips Than Before the Pandemic. Silver Data Lab, published 09 October 2026, last updated 11 October 2026. https://www.silverdatalab.com/studies/business-travel-in-the-eu
- Data: Eurostat, Trips by purpose (tin00188), filters freq=A, c_dest=WORLD, purpose=PROF, PER, TOTAL, duration=N_GE1, unit=NR, time=2015, 2017, 2019, 2020, 2021, 2022, 2023, 2024, 2025; extracted 2026-10-09; source last updated 2026-10-08. https://doi.org/10.2908/tin00188
- Data: Eurostat, Nights spent by purpose (tin00191), filters freq=A, c_dest=WORLD, purpose=PROF, PER, duration=N_GE1, unit=NR, time=2019, 2024, 2025; extracted 2026-10-09; source last updated 2026-10-08. https://doi.org/10.2908/tin00191
Silver Data Lab's analysis is licensed CC BY 4.0. The statistics remain their publisher's and keep its terms of reuse.
Ask the research desk
A question about this study — a definition, a filter, a break in the series, what the figures can and cannot support — answered by the desk that made the extraction.
Members can write to the research desk
Studies where the same country leads or trails
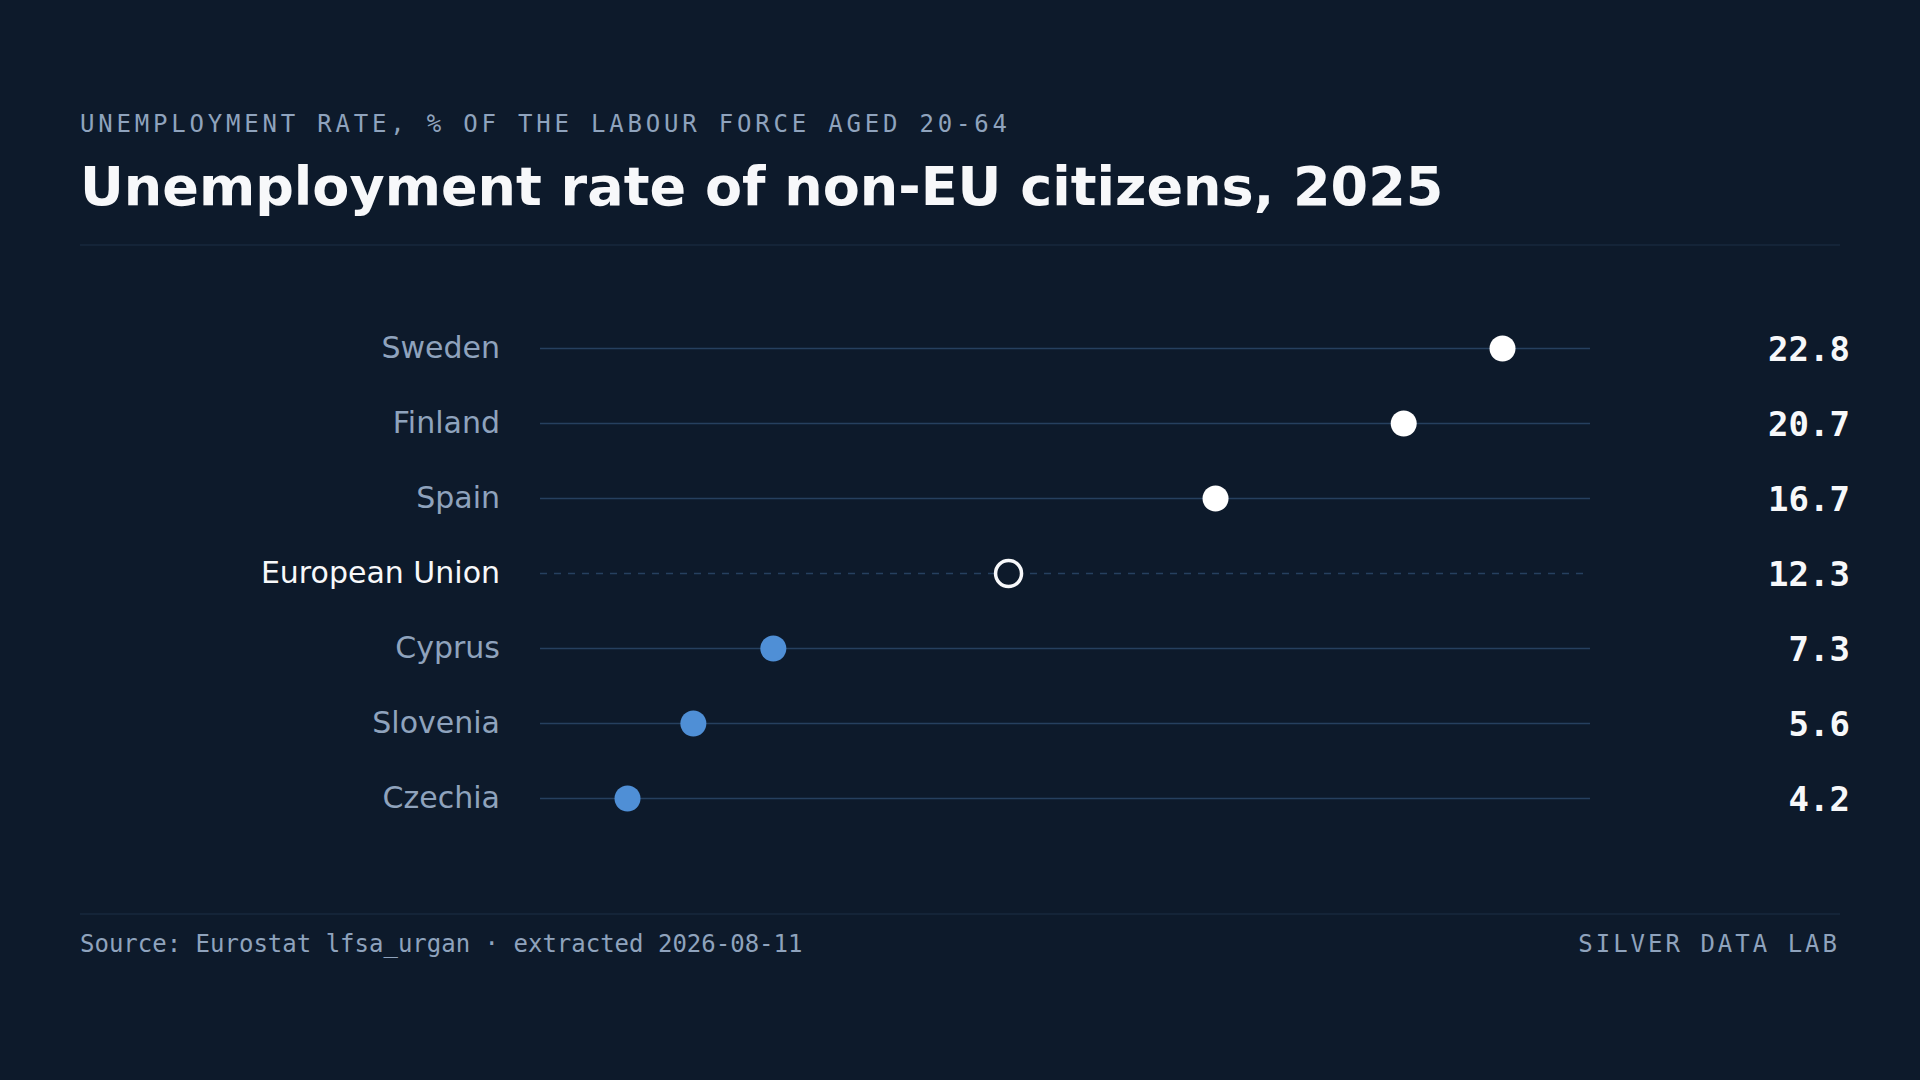
In Sweden, Non-EU Citizens Are Unemployed at 3.5 Times the Rate of Swedes
Non-EU citizens aged 20 to 64 faced 12.3% unemployment in the EU in 2025, against 5.2% for nationals.
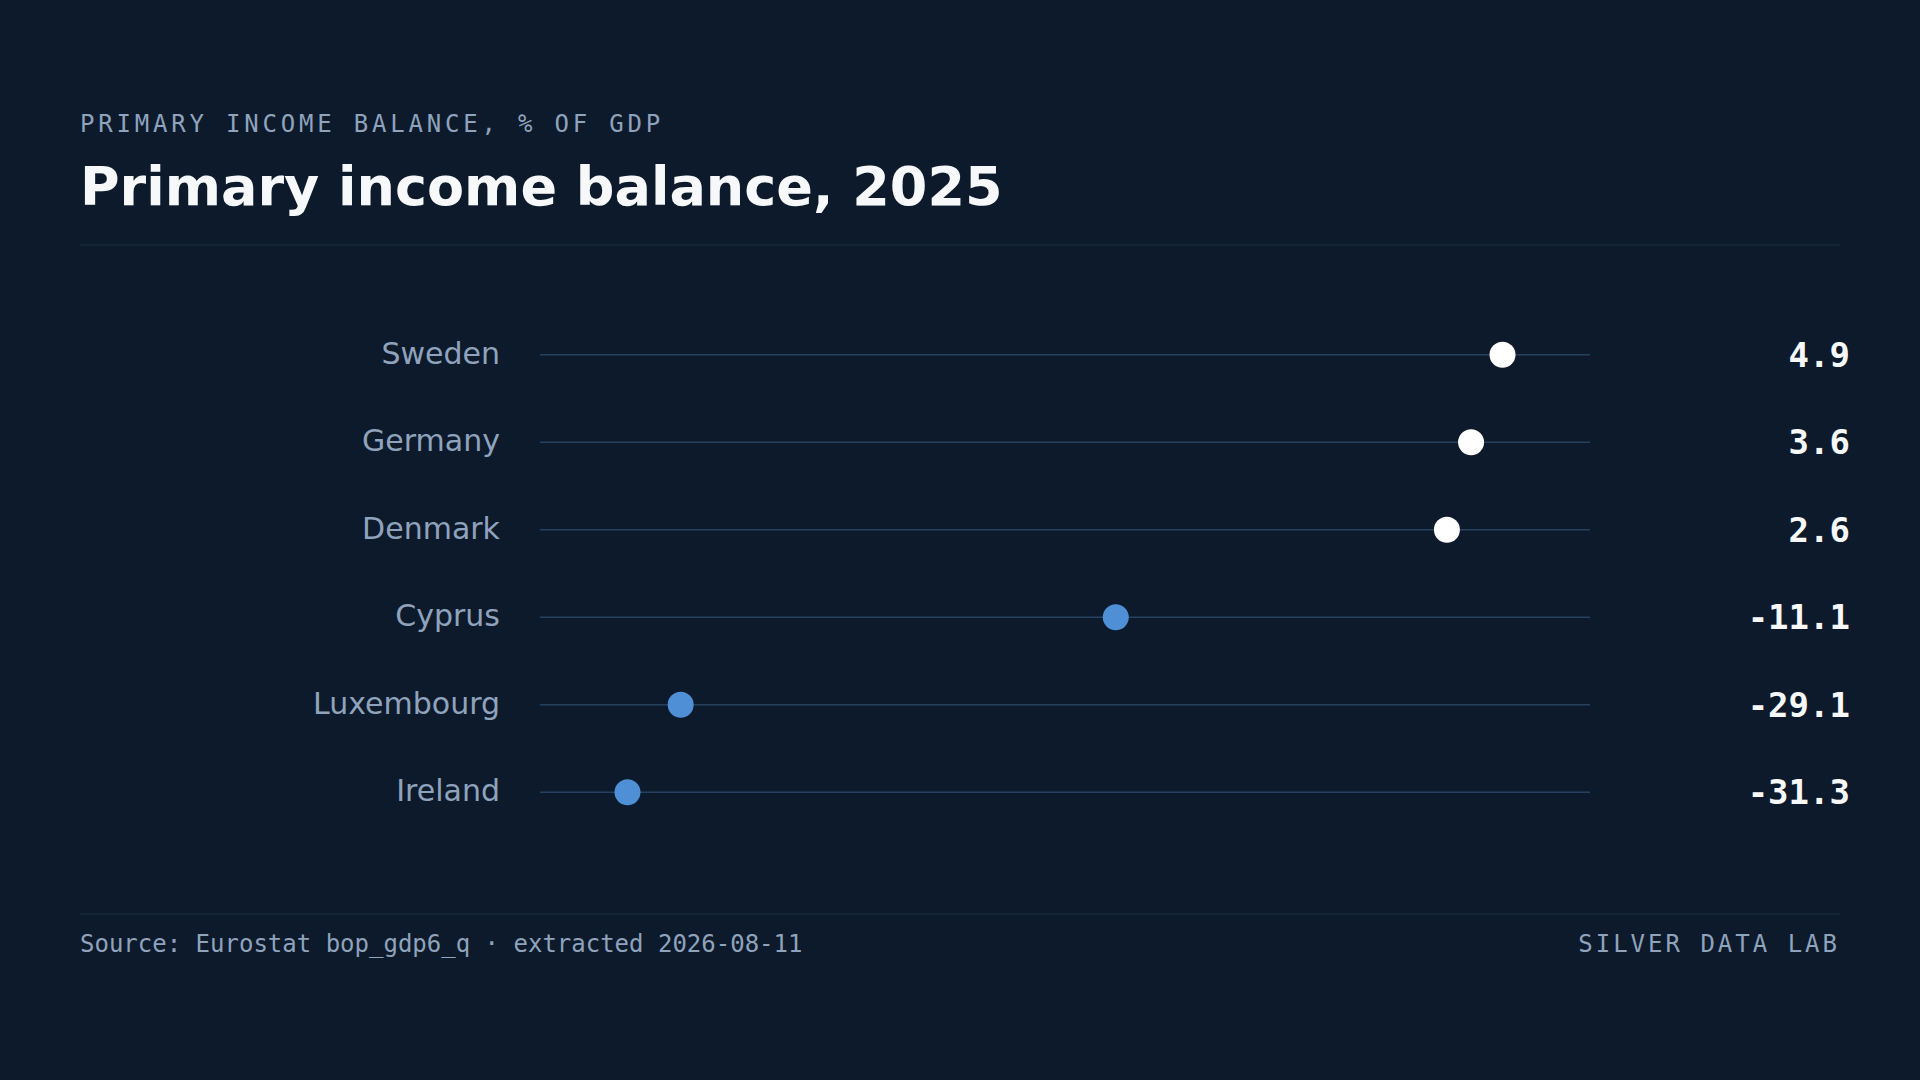
Ireland Pays Out More Income Abroad Than It Receives, a Net 28.6% of GDP
Ireland's net primary income outflow was 28.6% of GDP in 2025, second only to Luxembourg's 29.3%.
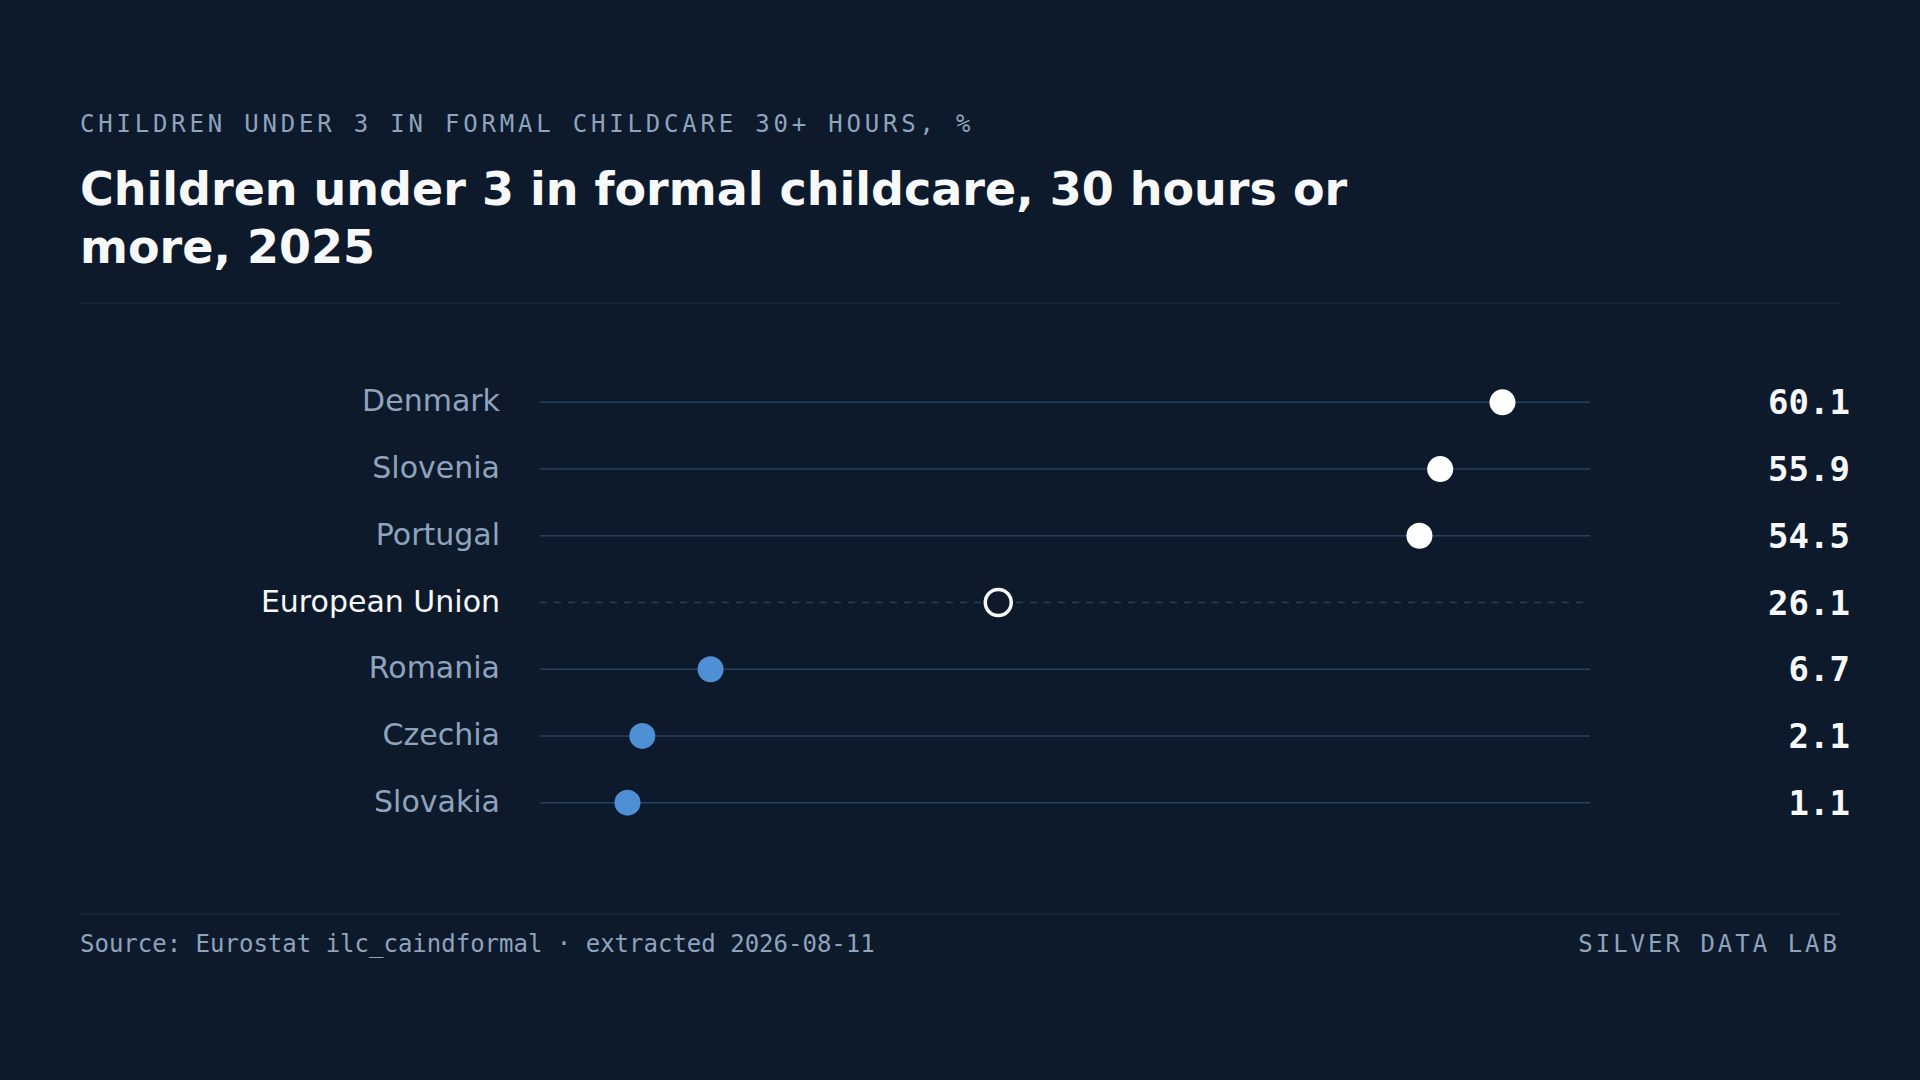
Most Danish Children Under Three Are in Full-Time Childcare
26.1% of EU children under three attended formal childcare for 30 hours a week or more in 2025.